H 2 supply paths in NoordHolland Noord Juliana


- Slides: 47
H 2 supply paths in Noord-Holland Noord Juliana Montoya Cardona j. montoya. cardona@pl. hanze. nl 5 th December 2018 Utrecht
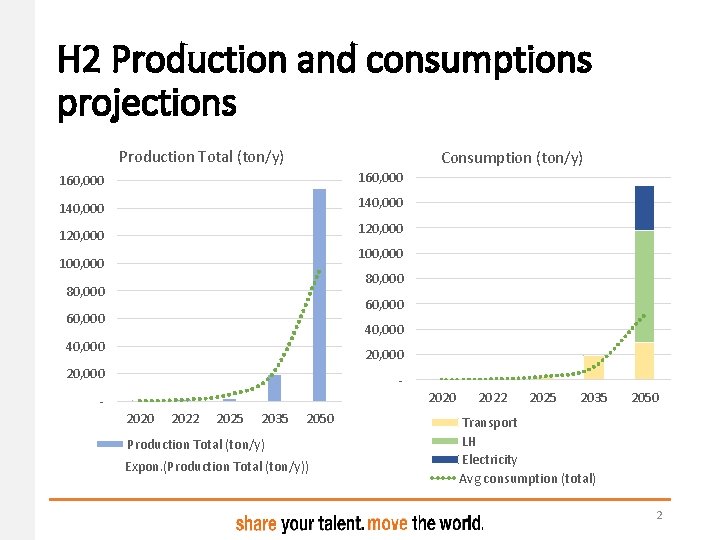
H 2 Production and consumptions projections Production Total (ton/y) Consumption (ton/y) 160, 000 140, 000 120, 000 100, 000 80, 000 60, 000 40, 000 20, 000 2020 2022 2025 2035 2050 Production Total (ton/y) Expon. (Production Total (ton/y)) 2022 2025 2035 2050 Transport LH Electricity Avg consumption (total) 2
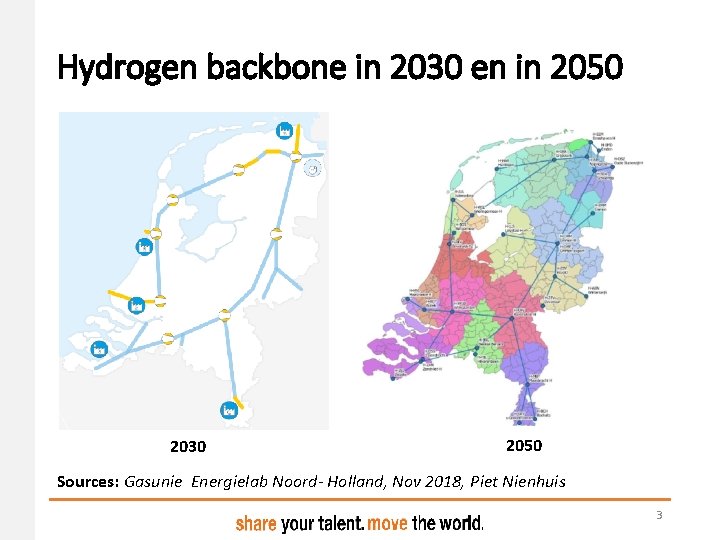
Hydrogen backbone in 2030 en in 2050 2030 2050 Sources: Gasunie Energielab Noord- Holland, Nov 2018, Piet Nienhuis 3
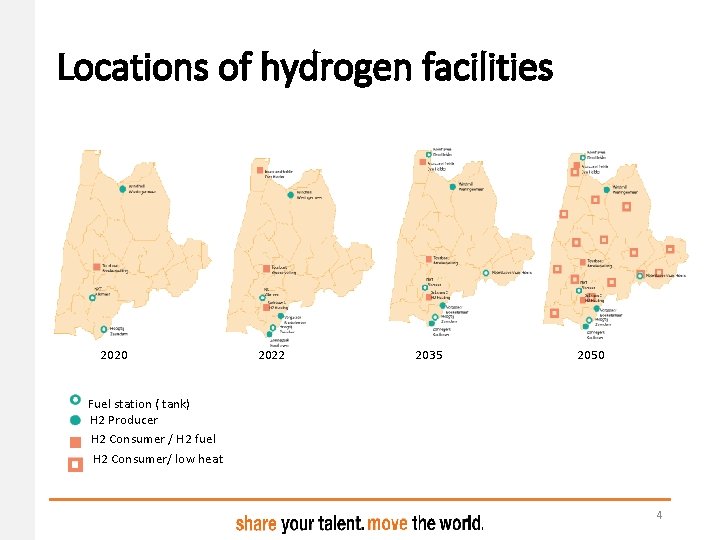
Locations of hydrogen facilities 2020 2022 2035 2050 Fuel station ( tank) H 2 Producer H 2 Consumer / H 2 fuel H 2 Consumer/ low heat 4
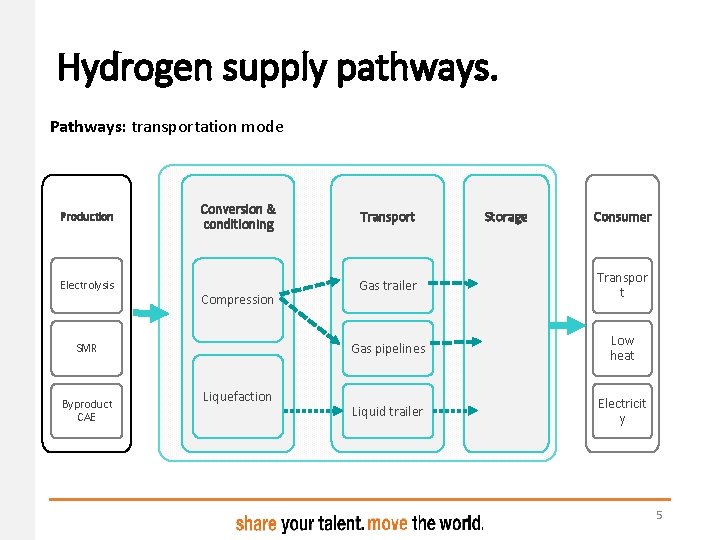
Hydrogen supply pathways. Pathways: transportation mode Production Electrolysis Conversion & conditioning Compression SMR Byproduct CAE Liquefaction Transport Storage Consumer Gas trailer Transpor t Gas pipelines Low heat Liquid trailer Electricit y 5
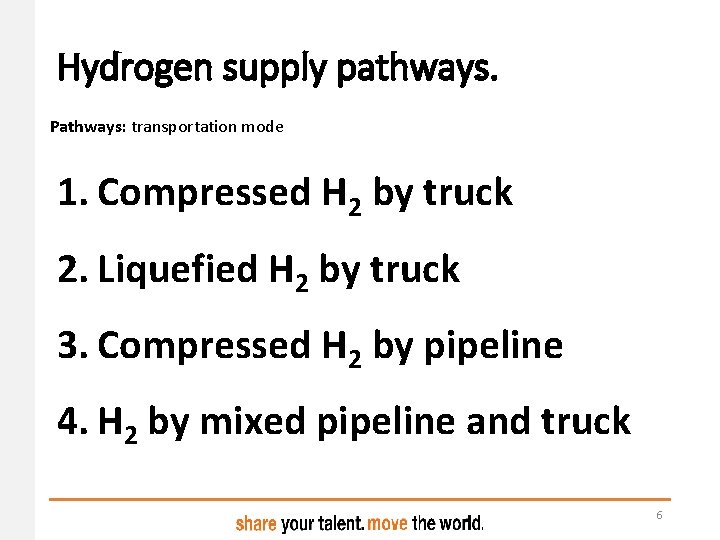
Hydrogen supply pathways. Pathways: transportation mode 1. Compressed H 2 by truck 2. Liquefied H 2 by truck 3. Compressed H 2 by pipeline 4. H 2 by mixed pipeline and truck 6
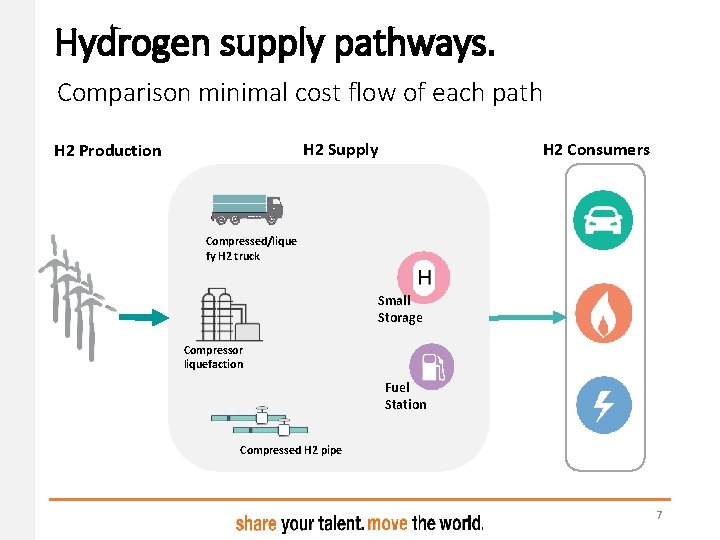
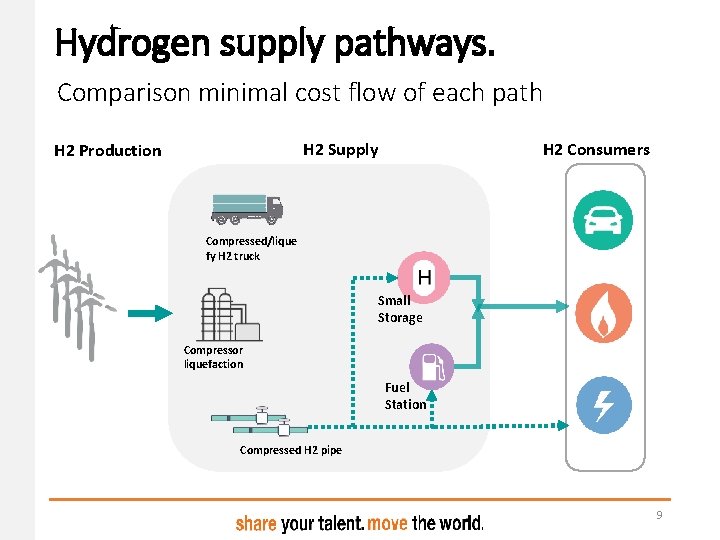
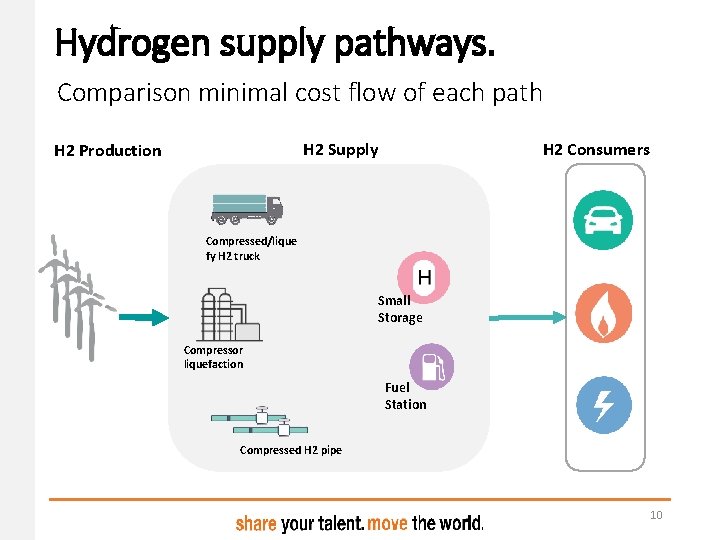
Hydrogen supply pathways. Comparison minimal cost flow of each path H 2 Consumers H 2 Supply H 2 Production Compressed/lique fy H 2 truck Small Storage Compressor liquefaction Fuel Station Compressed H 2 pipe 7
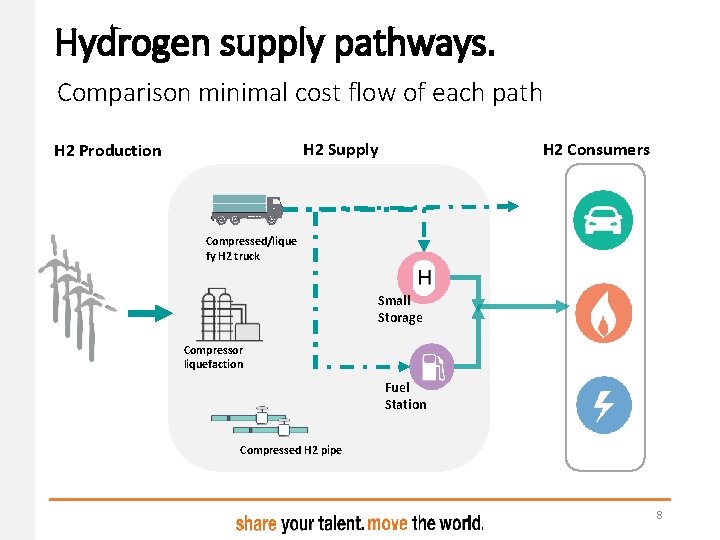
Hydrogen supply pathways. Comparison minimal cost flow of each path H 2 Consumers H 2 Supply H 2 Production Compressed/lique fy H 2 truck Small Storage Compressor liquefaction Fuel Station Compressed H 2 pipe 8
Hydrogen supply pathways. Comparison minimal cost flow of each path H 2 Consumers H 2 Supply H 2 Production Compressed/lique fy H 2 truck Small Storage Compressor liquefaction Fuel Station Compressed H 2 pipe 9
Hydrogen supply pathways. Comparison minimal cost flow of each path H 2 Consumers H 2 Supply H 2 Production Compressed/lique fy H 2 truck Small Storage Compressor liquefaction Fuel Station Compressed H 2 pipe 10
Optimal Hydrogen supply path Comparison of techno-economic metrics for the three paths Levelized cost (LC) (€/kg. H 2) Emissions (kg CO 2/kg H 2) Energy required (%) 11
Optimal Hydrogen supply path 1. Supply-Demand balance 2. Spatial optimization under mincost flow 3. Comparison of techno-economic metrics for the three paths 12
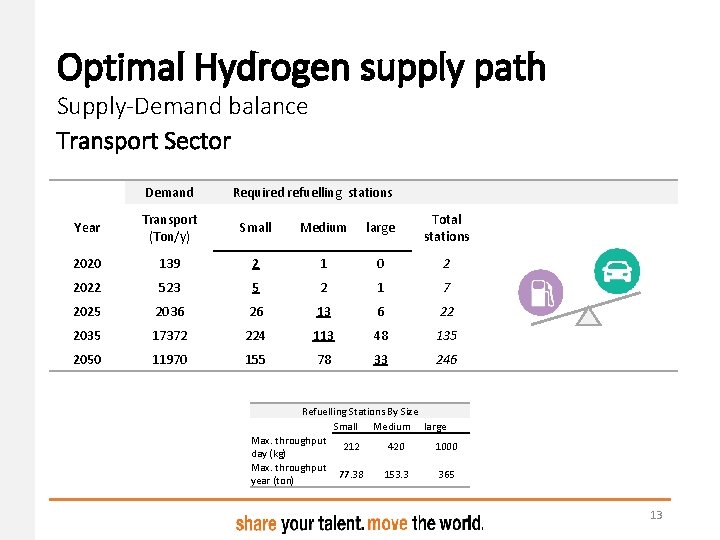
Optimal Hydrogen supply path Supply-Demand balance Transport Sector Demand Required refuelling stations Year Transport (Ton/y) Small Medium large Total stations 2020 139 2 1 0 2 2022 523 5 2 1 7 2025 2036 26 13 6 22 2035 17372 224 113 48 135 2050 11970 155 78 33 246 Refuelling Stations By Size Small Medium large Max. throughput 212 420 1000 day (kg) Max. throughput 77. 38 153. 3 365 year (ton) 13
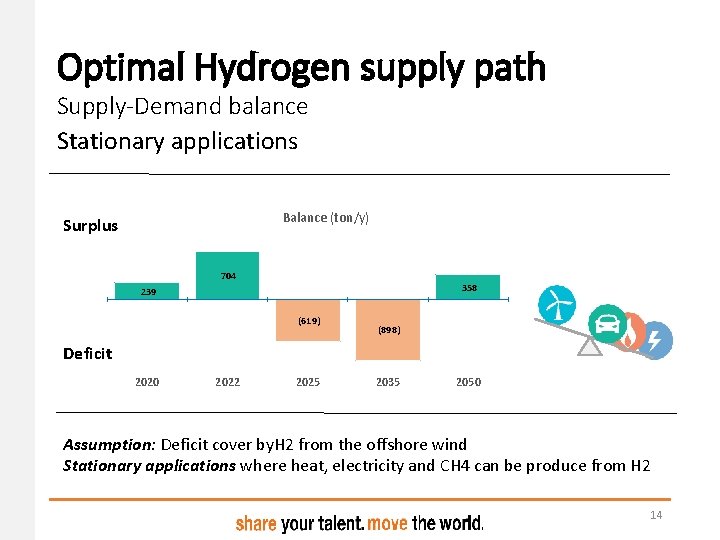
Optimal Hydrogen supply path Supply-Demand balance Stationary applications Balance (ton/y) Surplus 704 358 239 (619) (898) Deficit 2020 2022 2025 2035 2050 Assumption: Deficit cover by. H 2 from the offshore wind Stationary applications where heat, electricity and CH 4 can be produce from H 2 14
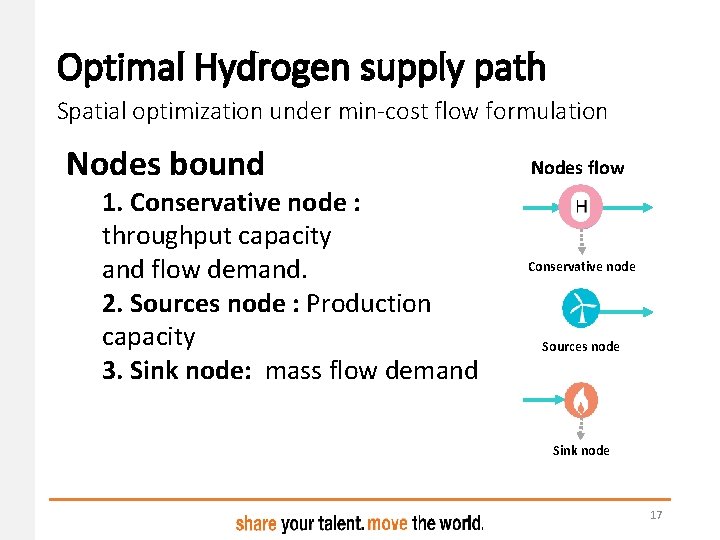
Optimal Hydrogen supply path Spatial optimization under min-cost flow formulation Nodes bound 1. Conservative node : throughput capacity and flow demand. 2. Sources node : Production capacity 3. Sink node: mass flow demand Nodes flow Conservative node Sources node Sink node 17
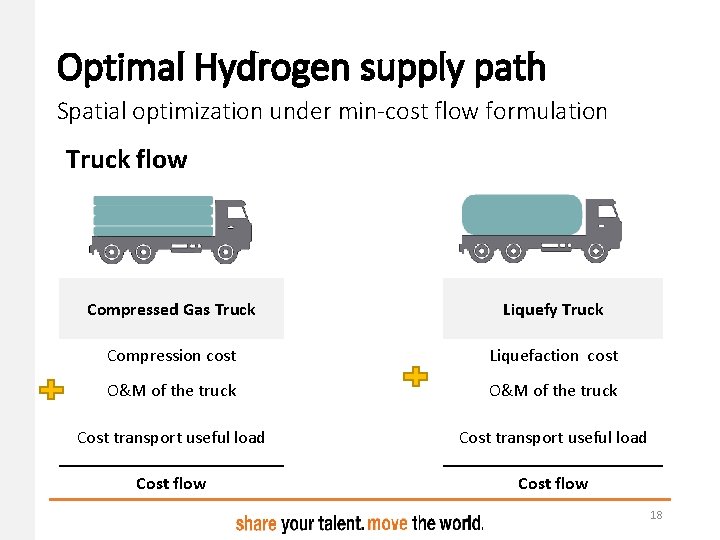
Optimal Hydrogen supply path Spatial optimization under min-cost flow formulation Truck flow Compressed Gas Truck Liquefy Truck Compression cost Liquefaction cost O&M of the truck Cost transport useful load Cost flow 18
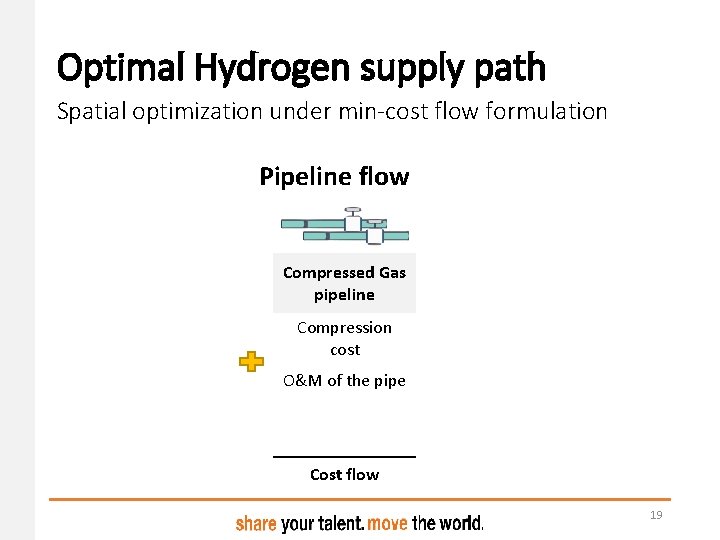
Optimal Hydrogen supply path Spatial optimization under min-cost flow formulation Pipeline flow Compressed Gas pipeline Compression cost O&M of the pipe Cost flow 19
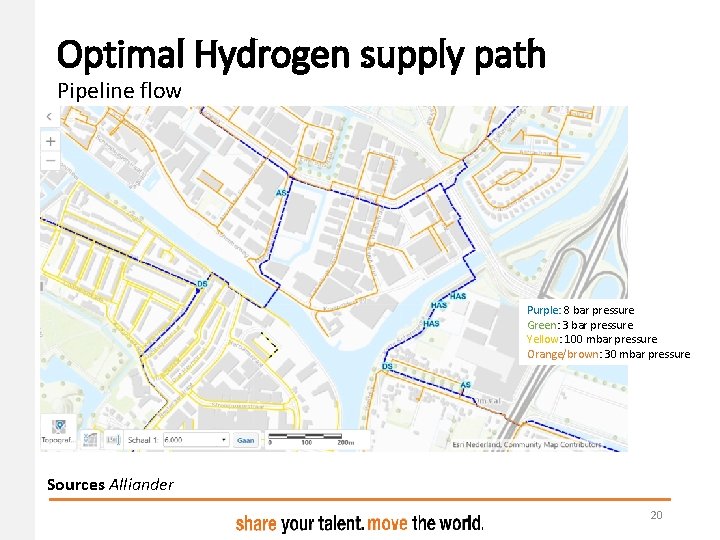
Optimal Hydrogen supply path Pipeline flow Purple: 8 bar pressure Green: 3 bar pressure Yellow: 100 mbar pressure Orange/brown: 30 mbar pressure Sources Alliander 20
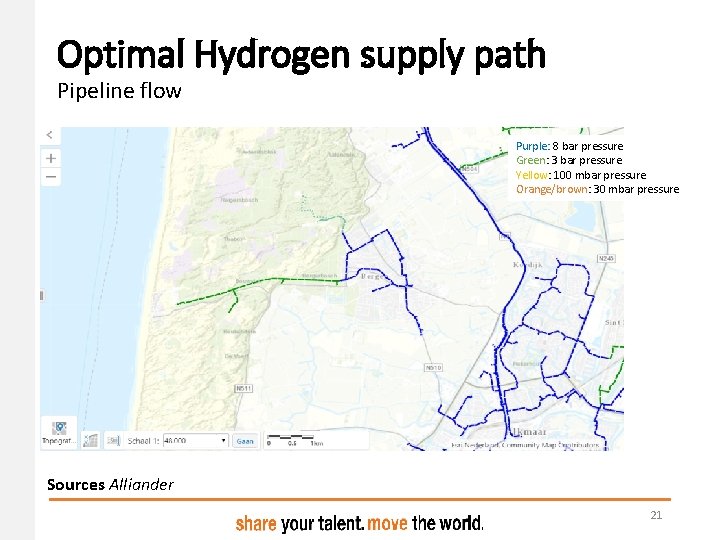
Optimal Hydrogen supply path Pipeline flow Purple: 8 bar pressure Green: 3 bar pressure Yellow: 100 mbar pressure Orange/brown: 30 mbar pressure Sources Alliander 21
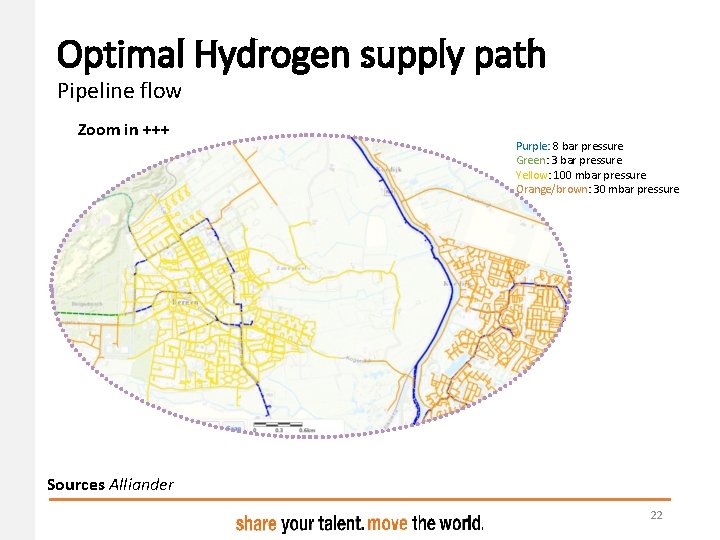
Optimal Hydrogen supply path Pipeline flow Zoom in +++ Purple: 8 bar pressure Green: 3 bar pressure Yellow: 100 mbar pressure Orange/brown: 30 mbar pressure Sources Alliander 22
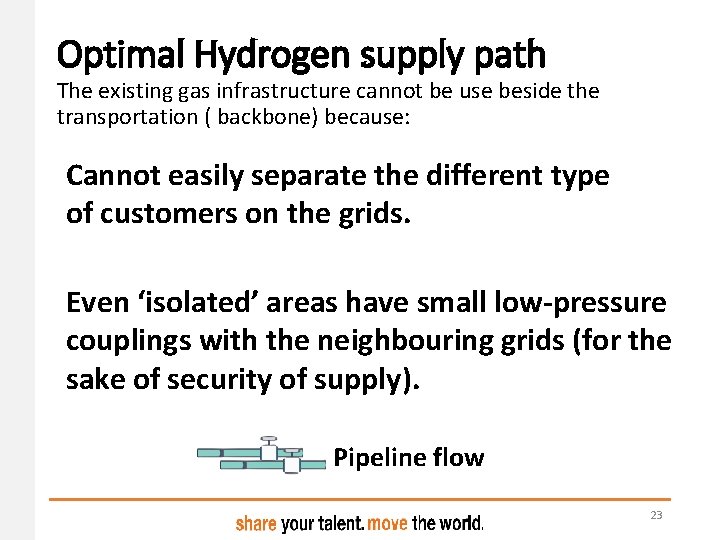
Optimal Hydrogen supply path The existing gas infrastructure cannot be use beside the transportation ( backbone) because: Cannot easily separate the different type of customers on the grids. Even ‘isolated’ areas have small low-pressure couplings with the neighbouring grids (for the sake of security of supply). Pipeline flow 23
Optimal Hydrogen supply path Flow considerations 1. Capacity transportation mode. 2. Distance between nodes. 3. Nodes connections via existing infrastructure only the backbone, other pipeline should be new 24
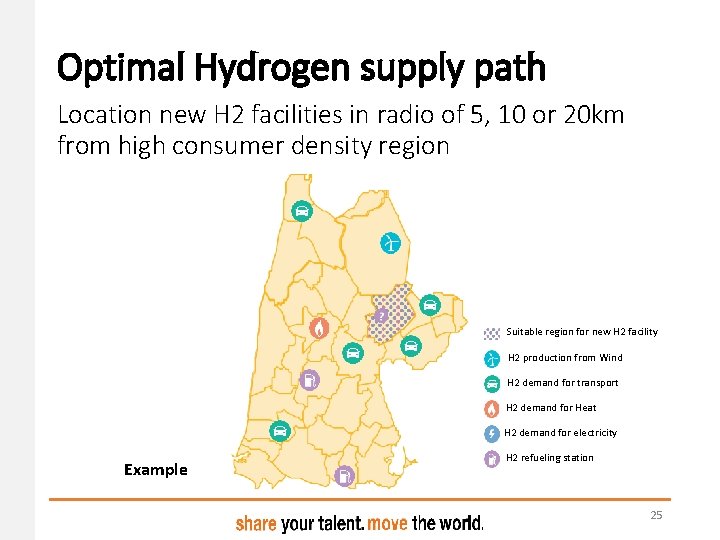
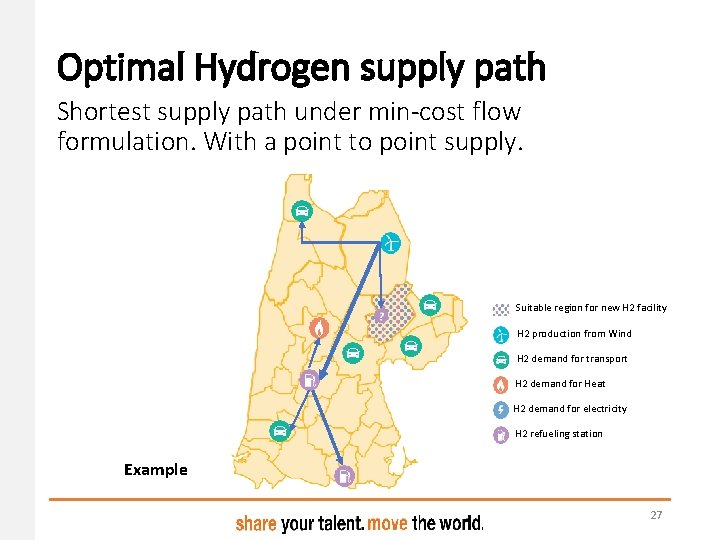
Optimal Hydrogen supply path Location new H 2 facilities in radio of 5, 10 or 20 km from high consumer density region Suitable region for new H 2 facility H 2 production from Wind H 2 demand for transport H 2 demand for Heat H 2 demand for electricity Example H 2 refueling station 25
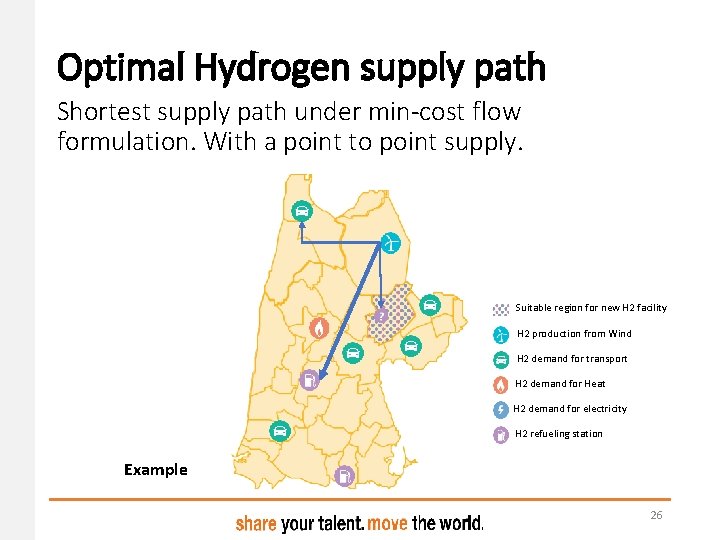
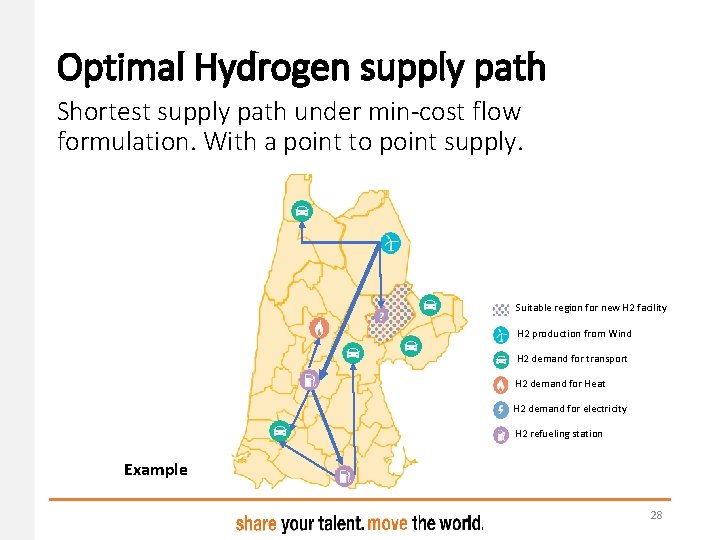
Optimal Hydrogen supply path Shortest supply path under min-cost flow formulation. With a point to point supply. Suitable region for new H 2 facility H 2 production from Wind H 2 demand for transport H 2 demand for Heat H 2 demand for electricity H 2 refueling station Example 26
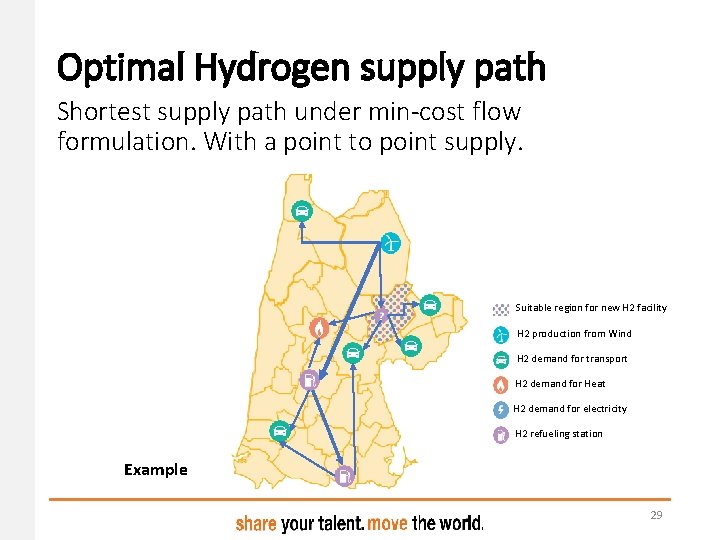
Optimal Hydrogen supply path Shortest supply path under min-cost flow formulation. With a point to point supply. Suitable region for new H 2 facility H 2 production from Wind H 2 demand for transport H 2 demand for Heat H 2 demand for electricity H 2 refueling station Example 27
Optimal Hydrogen supply path Shortest supply path under min-cost flow formulation. With a point to point supply. Suitable region for new H 2 facility H 2 production from Wind H 2 demand for transport H 2 demand for Heat H 2 demand for electricity H 2 refueling station Example 28
Optimal Hydrogen supply path Shortest supply path under min-cost flow formulation. With a point to point supply. Suitable region for new H 2 facility H 2 production from Wind H 2 demand for transport H 2 demand for Heat H 2 demand for electricity H 2 refueling station Example 29
Conclusion • Three H 2 supply path (delivery mode) will be used in this study, based on the relative competitiveness and existing Literature on H 2 distribution • The method used optimize both, node to node supply flow and the location of new H 2 facility under min-cost flow • Compared techno-economics metrics to select the suitable path 30
Further work • Validation the demand production scenarios • Spatial analysis of energy demand-supply density • Validation of techno-economic parameters of each path for the NHN region • Optimization for all the scenarios and the three paths • Selections of the optimal and suitable path regarding the techno-economic metrics • Spatial and temporal analysis ( monthly & daily) 31
Questions & Answers Juliana Montoya Cardona j. montoya. cardona@pl. hanze. nl 5 th December 2018 32
Further work • Validation the demand production scenarios • Spatial analysis of energy demand-supply density • Validation of techno-economic parameters of each path for the NHN region • Optimization for all the scenarios and the three paths • Selections of the optimal and suitable path regarding the techno-economic metrics • Spatial and temporal analysis ( monthly & daily) 33
Further work • Validation the demand production scenarios • Spatial analysis of energy demand-supply density • Validation of techno-economic parameters of each path for the NHN region • Optimization for all the scenarios and the three paths • Selections of the optimal and suitable path regarding the techno-economic metrics • Spatial and temporal analysis ( monthly & daily) 34
Further work • Validation the demand production scenarios • Spatial analysis of energy demand-supply density • Validation of techno-economic parameters of each path for the NHN region • Optimization for all the scenarios and the three paths • Selections of the optimal and suitable path regarding the techno-economic metrics • Spatial and temporal analysis ( monthly & daily) 35
Further work • Validation the demand production scenarios • Spatial analysis of energy demand-supply density • Validation of techno-economic parameters of each path for the NHN region • Optimization for all the scenarios and the three paths • Selections of the optimal and suitable path regarding the techno-economic metrics • Spatial and temporal analysis ( monthly & daily) 36
Further work • Validation the demand production scenarios • Spatial analysis of energy demand-supply density • Validation of techno-economic parameters of each path for the NHN region • Optimization for all the scenarios and the three paths • Selections of the optimal and suitable path regarding the techno-economic metrics • Spatial and temporal analysis ( monthly & daily) 37
Further work • Validation the demand production scenarios • Spatial analysis of energy demand-supply density • Validation of techno-economic parameters of each path for the NHN region • Optimization for all the scenarios and the three paths • Selections of the optimal and suitable path regarding the techno-economic metrics • Spatial and temporal analysis ( monthly & daily) 38
Questions & Answers Juliana Montoya Cardona j. montoya. cardona@pl. hanze. nl 5 th December 2018 40
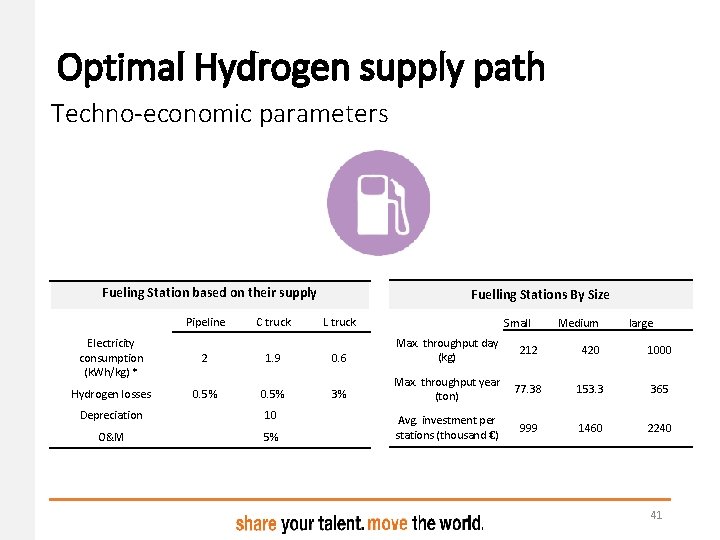
Optimal Hydrogen supply path Techno-economic parameters Fueling Station based on their supply Pipeline C truck Electricity consumption (k. Wh/kg) * 2 1. 9 Hydrogen losses 0. 5% Depreciation 10 O&M 5% Fuelling Stations By Size L truck Small Medium large 0. 6 Max. throughput day (kg) 212 420 1000 3% Max. throughput year (ton) 77. 38 153. 3 365 Avg. investment per stations (thousand €) 999 1460 2240 41
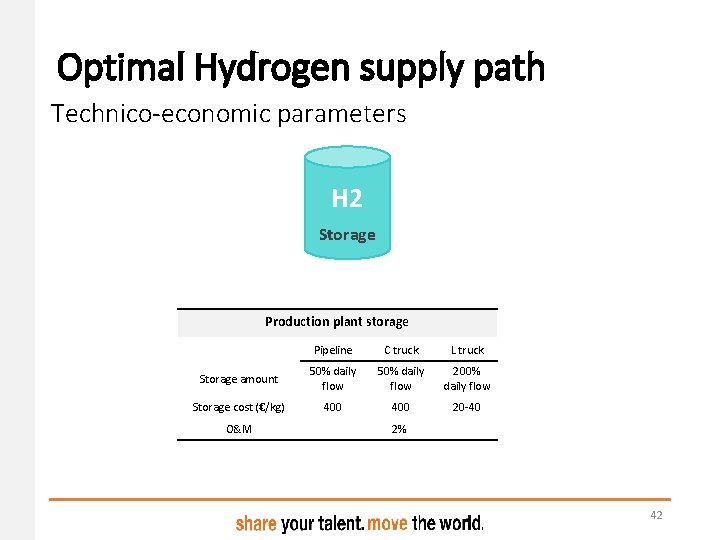
Optimal Hydrogen supply path Technico-economic parameters H 2 Storage Production plant storage Pipeline C truck L truck Storage amount 50% daily flow 200% daily flow Storage cost (€/kg) 400 20 -40 O&M 2% 42
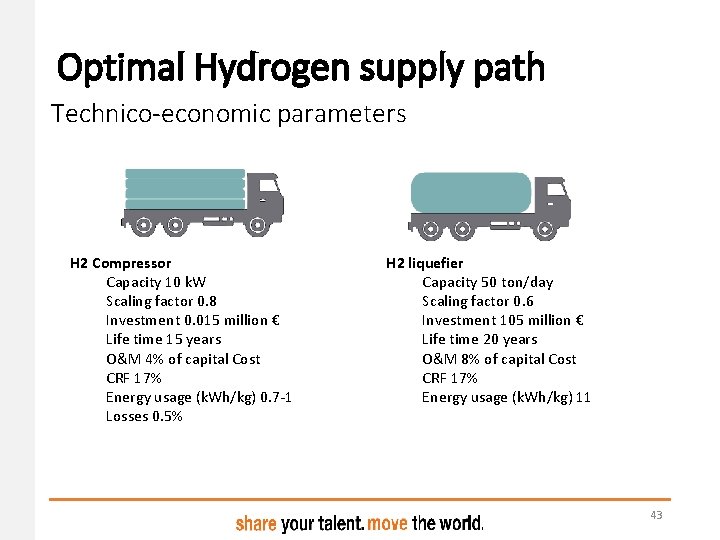
Optimal Hydrogen supply path Technico-economic parameters H 2 Compressor Capacity 10 k. W Scaling factor 0. 8 Investment 0. 015 million € Life time 15 years O&M 4% of capital Cost CRF 17% Energy usage (k. Wh/kg) 0. 7 -1 Losses 0. 5% H 2 liquefier Capacity 50 ton/day Scaling factor 0. 6 Investment 105 million € Life time 20 years O&M 8% of capital Cost CRF 17% Energy usage (k. Wh/kg) 11 43
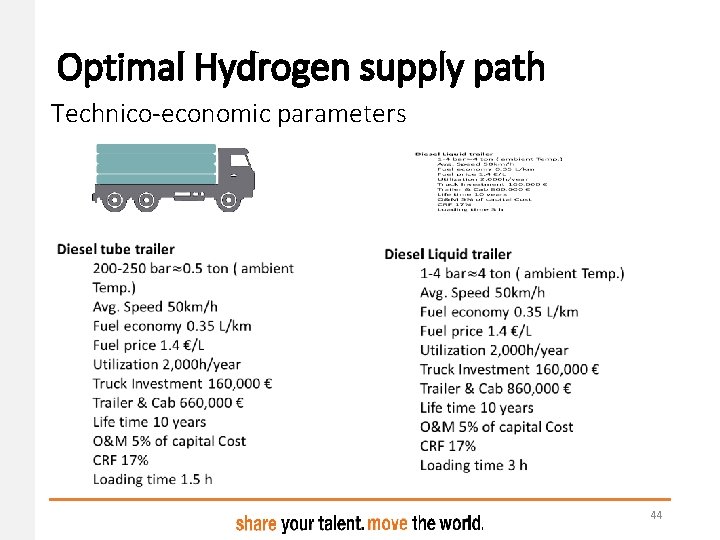
Optimal Hydrogen supply path Technico-economic parameters 44
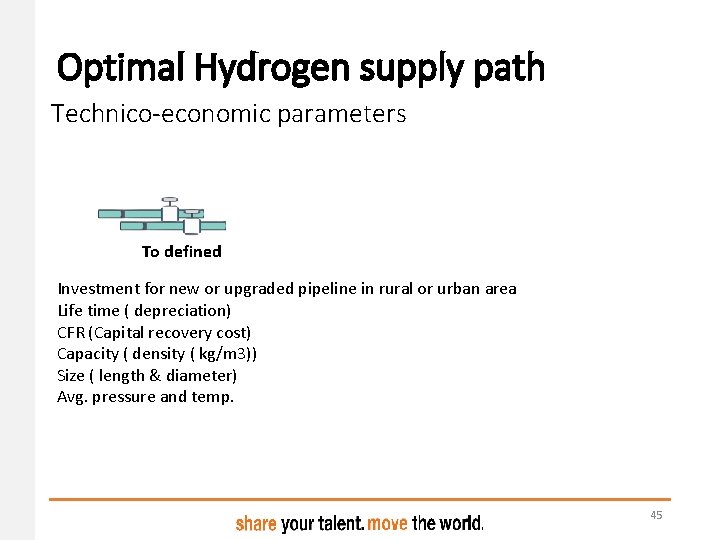
Optimal Hydrogen supply path Technico-economic parameters To defined Investment for new or upgraded pipeline in rural or urban area Life time ( depreciation) CFR (Capital recovery cost) Capacity ( density ( kg/m 3)) Size ( length & diameter) Avg. pressure and temp. 45
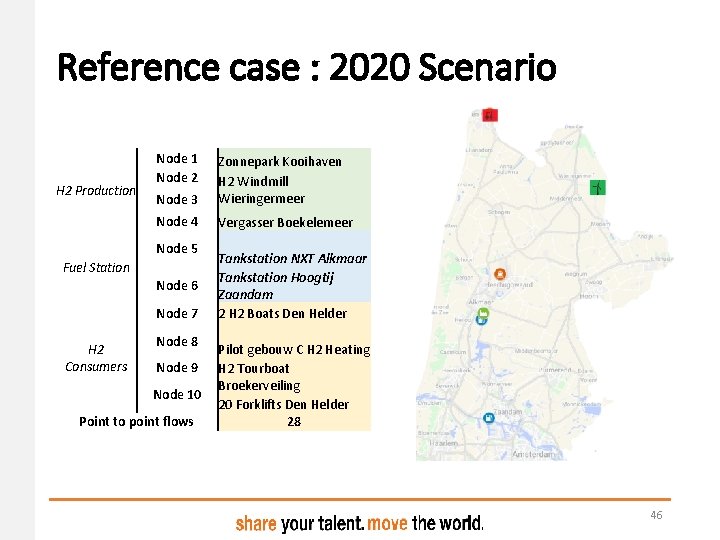
Reference case : 2020 Scenario H 2 Production Node 1 Node 2 Node 3 Zonnepark Kooihaven H 2 Windmill Wieringermeer Node 4 Vergasser Boekelemeer Node 5 Fuel Station Node 6 Node 7 H 2 Consumers Node 8 Node 9 Node 10 Point to point flows Tankstation NXT Alkmaar Tankstation Hoogtij Zaandam 2 H 2 Boats Den Helder Pilot gebouw C H 2 Heating H 2 Tourboat Broekerveiling 20 Forklifts Den Helder 28 46
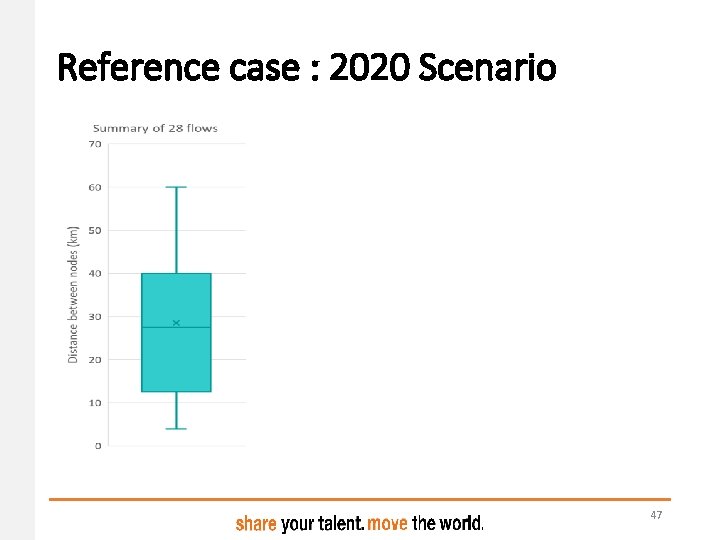
Reference case : 2020 Scenario 47
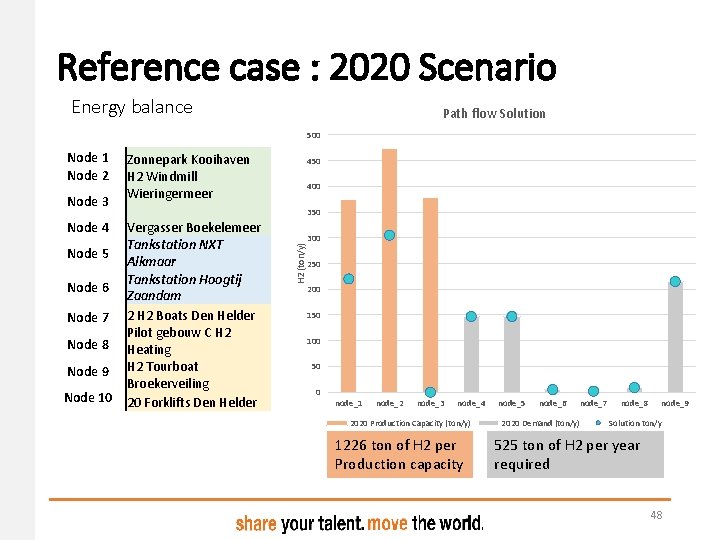
Reference case : 2020 Scenario Energy balance Path flow Solution 500 Node 3 Node 4 Node 5 Node 6 Node 7 Node 8 Node 9 Node 10 Zonnepark Kooihaven H 2 Windmill Wieringermeer 450 400 350 Vergasser Boekelemeer Tankstation NXT Alkmaar Tankstation Hoogtij Zaandam 2 H 2 Boats Den Helder Pilot gebouw C H 2 Heating H 2 Tourboat Broekerveiling 20 Forklifts Den Helder H 2 (ton/y) Node 1 Node 2 300 250 200 150 100 50 0 node_1 node_2 node_3 node_4 2020 Production Capacity (ton/y) 1226 ton of H 2 per Production capacity node_5 node_6 node_7 2020 Demand (ton/y) node_8 node_9 Solution ton/y 525 ton of H 2 per year required 48
Reference case : 2020 Scenario • Solution flows 49
Reference case : 2020 Scenario • Solution metrics 50