Glyco Test Range 30 100 Avg 75 Mean


, pp 3816– 3823")


![Figure 5 A. [M+Na]+: 1705. 862 and 1706. 854 m/z (mono) * 1709. 847](https://slidetodoc.com/presentation_image_h/1b2f47120e0927998c3ac25e921daf58/image-31.jpg "Figure 5 A. [M+Na]+: 1705. 862 and 1706. 854 m/z (mono) * 1709. 847")
![Relative Abundance Figure 5 B. [M+Na]+: 1432. 741 and 1435. 735 m/z (mono) 1432.](https://slidetodoc.com/presentation_image_h/1b2f47120e0927998c3ac25e921daf58/image-32.jpg "Relative Abundance Figure 5 B. [M+Na]+: 1432. 741 and 1435. 735 m/z (mono) 1432.")


 3 sites")
: 897 -907. Precision mapping of an in vivo Nglycoproteome")


")


 Fragmentation Generating oxonium ions Electron")

 Glc.")


- Slides: 70
Glyco. Test Range: 30 -100 Avg: 75 ; Mean: 81 7 6 Glyco-challenged Glyco-literate 5 4 3 2 1 0 Below 60 60 -79 80 s 90+
Glyco. Analytics Complex Carbohydrate Research Center, Department of Biochemistry & Molecular Biology University of Georgia
Compositional Analysis Using Derivitized Glycans often done by GLC Separation —Azadi Summer Course
HPAE-PAD Detection of Monosaccharides
GLC/GC Analysis --Also taught in Azadi’s Summer Courses
Tandem Mass Spectrometry-Based Approaches For the Characterization of Glycopeptides NCRR Biomedical Glycomics
Biological/Technical Challenges ØGlycosylation is a non-template driven process ØMany building blocks are isomers/epimers ØNot one single linkage of building blocks to one another ØMajority of glycans are non-linear (branched) ØFree glycans are extremely hydrophilic ØMicroheterogeneity is the norm on glycoproteins ØGlycosidic linkage to amino acid is labile
Glycan Capping Reactions http: //www. ccrc. uga. edu/~moremen/glycomics/
All MS do one thing: Measure m/z
Site Mapping and Characterization -Glycans, N-linked Sites, O-linked Sites M P Q N G S W E K A F I S Y D P R S T I H C A N G R E S S M K Q N V S L T P G L C
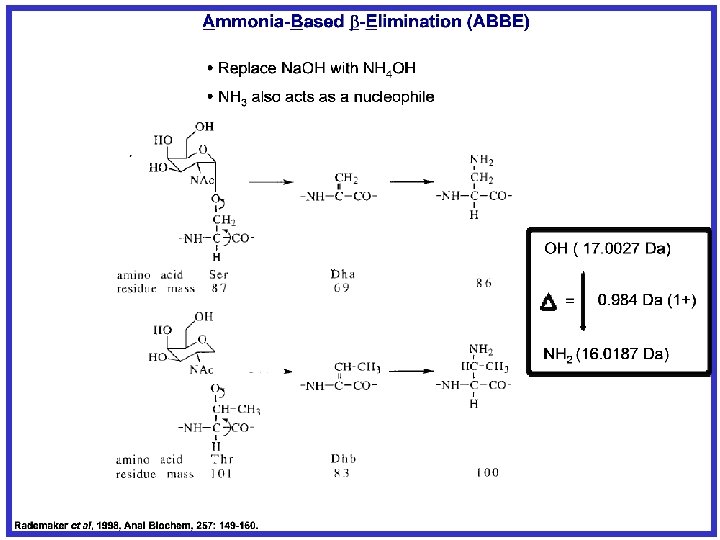
Glycan Release/Permethylation of Glycans • Trypsin digestion of protein • Enzymatic release of N-glycans • b-elimination for O-linked- additon of Na. OH – resulting in release of glycan structure from hydroxyl of Ser or Thr – Reduction with Na. BH 4 prevents re-attaching of glycan • Permethylation of glycan- OH→OMe – Addition of Me. I • Analyzed permethylated glycans by applying MSn fragmentation as needed to completely determine the structure J. Am. Chem. Soc. (2003) 125(52): 16213 -9.
Glycan Analysis
LC-n. SI/MS/MS or Direct Infusion Peptide mixtures HPLC Database Protein Nucleotide ESTs Buffer A Buffer B Capillary Column Nsi LTQ ion trap Mass spectrometer Predicted MS/MS Automated MS/MS 2 Ma 83 R T 0 : 3 T 5 : + cr 3 N 1 SM IF#u 2 ll 1 m s[35. 050. 9 -14 A 750 V. 0: 1 N 0] L: 1. 56 E 7 729. 5 100 95 542. 8 90 85 80 75 70 65 60 55 50 45 40 35 30 25 20 15 10 5 0 400 500 600 700 800 Peptides sequenced, Proteins Identified 542. 5 729. 5 1082. 7 1. Enolase 1082. 7 4. Hypusine 1486. 1 1000 1100 MS 1200 1300 1400 1500 1600 EEALDLIVDAIK 2. Pyruvate kinase NPTVEVELTTEK 3. Hexokinase IEDDPFVFLEDTDDIFQK CID 900 Turbo. SEQUEST Cross-Correlation Comparison 5. BMH 1 1700 MS/MS APEGELGDSLQTAFDEGK QAFDDAIAELDTLSEESYK
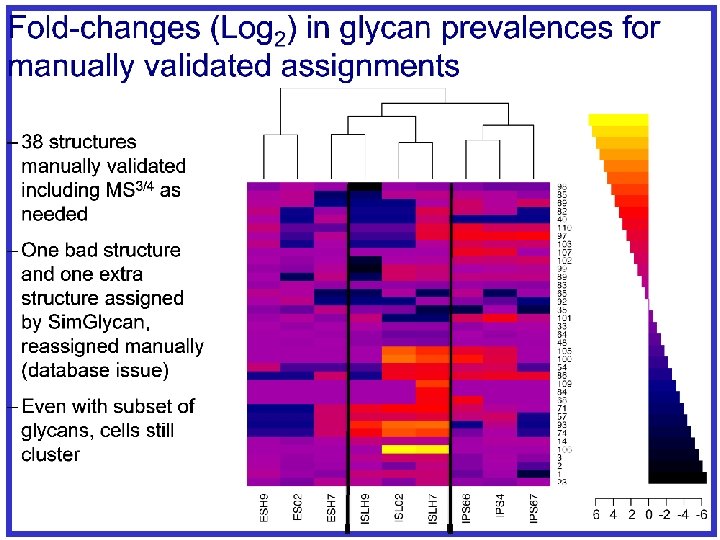
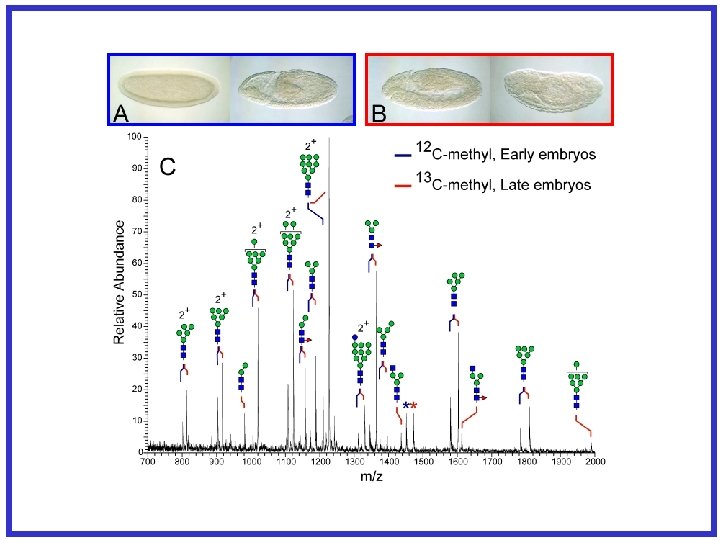
Permethylated Glycans from wildtype Drosophila embryos
POMGn. T 1 appears to be essential for O-Man Extension
GRITs. . CCRC way
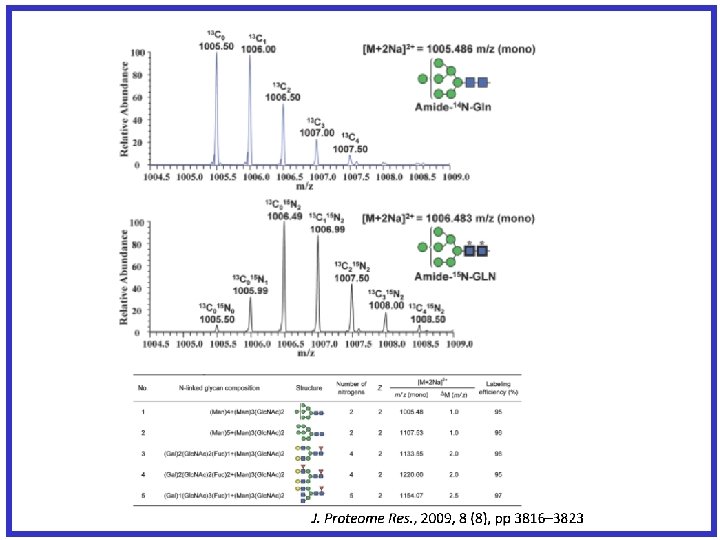
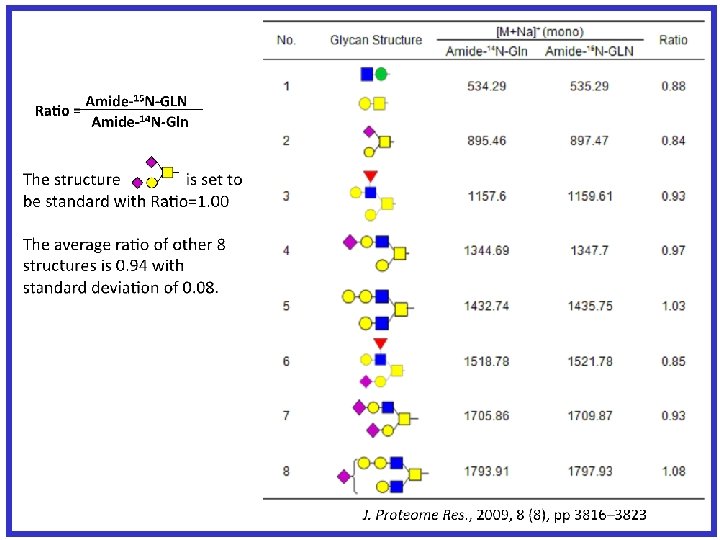
Relative quantification between 2 samples of released and permethylated N-glycans via isotope labeling with light/heavy iodomethane
+1 Dalton J. Proteome Res. , 2009, 8 (8), pp 3816– 3823
Heavy Medium Light Medium Amide-14 N L-glutamine “Gln-14” Amide-15 N L-glutamine “GLN-15” Harvest & Combine Homogenization and delipidation Mixed Protein Powder Tryptic digestion Peptide Mixture C 18 reverse phase PNGase F digestion -elimination N-linked Glycan Mixture O-linked Glycan Mixture C 18 reverse phase Permethylation Deionization Permethylated Glycans Mass Spectrometry Light Gln-14 Heavy GLN-15 Quantification by Full MS Characterization by MS/MS
Figure 5 A. [M+Na]+: 1705. 862 and 1706. 854 m/z (mono) * 1709. 847 100 : 90 1705. 858 * * 1710. 849 80 70 Relative Abundance * h. DE = 1. 74 h. ES 1706. 862 60 50 40 1711. 852 1707. 865 30 20 1708. 859 10 0 1705 1706 1707 1708 1709 1710 m/z 1711 1712 1713 1714
Relative Abundance Figure 5 B. [M+Na]+: 1432. 741 and 1435. 735 m/z (mono) 1432. 736 100 h. DE = 0. 23 h. ES 90 * 80 : 1433. 738 70 * * 60 50 40 1434. 739 30 1435. 729 20 1436. 729 10 0 1431 1437. 733 1432 1433 1434 1435 1436 m/z 1437 1438. 736 1439 1440
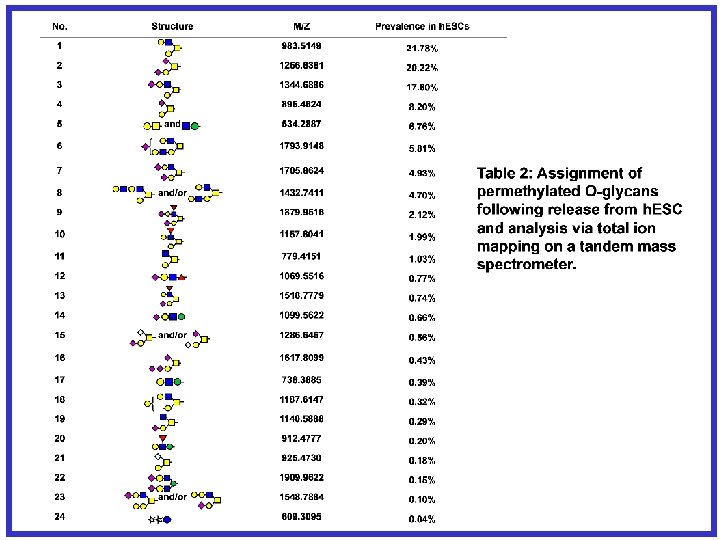
Table 3: Relative quantification of O-glycan expression levels in h. ESCs and h. DE using IDAWG (Ratio=h. DE/h. ESCs) (Prevalence > 1%) Structure and m/z Prevalence Ratio CV 983. 52 21. 78% 1. 11 20. 20% 1256. 64 20. 22% 1. 09 14. 42% 1344. 69 17. 60% 2. 64 30. 21% 895. 46 8. 20% 0. 87 13. 56% 534. 29 6. 76% 1. 04 17. 20% 1793. 91 5. 81% 0. 64 61. 95% 1705. 86 4. 93% 2. 54 29. 48% 1432. 74 4. 70% 0. 41 37. 70% 1879. 95 2. 12% 1. 75 49. 39% 1157. 60 1. 99% 0. 99 29. 78% 779. 42 1. 03% 0. 79 26. 42%
Pulse-Chase experiment designed for dynamic IDAWG X 4 Heavy Media Complete Labeling Harvest X 4 Light Media 0 hr X 1 X 2 Light X 3 Light Media 12 hr 24 hr X 1 Release N- and O-linked glycans Permethylation Media X 1 36 hr X 1
0 hr-- >95% Heavy 1259. 622 100 95 90 85 80 Relative Abundance 75 70 65 60 1260. 626 55 50 45 40 35 30 25 1261. 628 20 15 10 1258. 626 1262. 632 5 0 1255 1256 1257 1258 1259 m/z 1260 1261 1262 1263 1264
6 hr 1259. 626 Relative Abundance 100 95 90 85 80 75 70 65 1260. 629 60 55 50 45 40 1258. 631 35 30 1257. 633 25 1261. 632 20 15 1256. 635 10 1262. 635 5 0 1255 1256 1257 1258 1259 m/z 1260 1261 1262 1263 1264
12 hr 1259. 622 Relative Abundance 100 95 90 85 80 1257. 629 75 70 65 1258. 629 60 1256. 630 55 1260. 625 50 45 40 35 30 25 1261. 627 20 15 10 1262. 628 5 0 1255 1256 1257 1258 1259 1260 m/z 1261 1262 1263 1264
24 hr 1256. 630 Relative Abundance 100 1257. 631 95 90 85 80 75 70 65 60 55 50 1258. 631 45 40 35 1259. 621 30 25 1260. 624 20 15 1261. 627 10 1262. 633 5 0 1255 1256 1257 1258 1259 1260 m/z 1261 1262 1263 1264
36 hr 1256. 629 Relative Abundance 100 95 1257. 630 90 85 80 75 70 65 60 55 50 45 1258. 631 40 35 30 25 20 1259. 622 15 1260. 623 10 1261. 626 5 0 1255 1256 1257 1258 1259 m/z 1260 1261 1262. 626 1263 1264
50% degradation time and proportion of remodeling at 50% degradation time for 9 major O-glycans Structure 50% degradation time (hours) Proportion of remodeling at 50% degradation time (%) Rep 1 Rep 2 18. 6 19. 4 1. 6 1. 1 20. 7 22. 6 0. 0 7. 7 8. 4 0. 0 16. 2 15. 6 9. 0 9. 7 14. 9 14. 1 26. 8 25. 4 20. 4 18. 1 16. 9 21. 2 18. 4 19. 8 9. 3 8. 4 21. 3 25. 3 21. 5 16. 9 22. 1 19. 4 27. 9 27. 0
Site Mapping and Characterization -Glycans, N-linked Sites, O-linked Sites M P Q N G S W E K A F I S Y D P R S T I H C A N G R E S S M K Q N V S L Focus on Site-Mapping T P G L C
PNGase F Treatment and N-linked Glycosylation Site-mapping N-X-S/T Secreted Proteins from Adipocytes (insulin responsive vs insulin resistant) Sulfated glycoprotein 1 precursor (SGP-1) gi|3914939 (K)TVVTEAGNLLKDN#ATQEEILHYLEK (K)FSELIVNN#ATEELLVK (K)LVLYLEHNLEKN#STKEEILAALEK Follistatin-related protein 1 precursor gi|2498391 (K)GSN#YSEILDK Haptoglobin gi|8850219 lipoprotein lipase gi|12832783 (R)TPEDTAEDTCHLIPGLADSVSNCHFN#HSSK vimentin gi|2078001 (R)QVQSLTCEVDALKGTN#ESLER Adipsin gi|673431 (K)VVLHPN#HSVVDIGLIK (K)NLFLN#HSETASAK (K)CVVHYEN#STVPEKK (K)LSQN#ASLGPHVRPLPLQYEDK Decorin gi|6681143 Hemopexin gi|1881768 (R)ISDTN#ITAIPQGLPTSLTEVHLDGNK (R)SWSTVGN#CTAALR 56 proteins with 83 N-linked sites
N-linked Site Mapping from Con. A-enriched glycopeptides from Drosophila heads--272 sites mapped from 197 Proteins Pileup of the 272 N-linked Sites to Determine Consensus beyond N-X-S/T Concerns: PNGase. F/A, Deamidation, C-terminal O-18
PGIP N-linked Site Mapping with PNGase F/A PNGase F (red = coverage) 3 sites identified DLCNPDDKKV LLQIKKAFGD PYVLASWKSD TDCCDWYCVT CDSTTNRINS LTIFAGQVSG QIPALVGDLP YLETLEFHKQ PNLTGPIQPA IAKLKGLKSL RLSWTNLSGS VPDFLSQLKN LTFLDLSFNN LTGAIPSSLS ELPNLGALRL DRNKLTGHIP ISFGQFIGNV PDLYLSHNQL SGNIPTSFAQ MDFTSIDLSR NKLEGDASVI FGLNKTTQIV DLSRNLLEFN LSKVEFPTSL TSLDINHNKI YGSIPVEFTQ LNFQFLNVSY NRLCGQIPVG GKLQSFDEYS YFHNRCLCGA PLPSCK PNGase A (red=coverage) 7 sites identified DLCNPDDKKV LLQIKKAFGD PYVLASWKSD TDCCDWYCVT CDSTTNRINS LTIFAGQVSG QIPALVGDLP YLETLEFHK Q PNLTGPIQPA IAKLKGLKSL RLSWTNLSGS VPDFLSQLKN LTFLDLSFNN LTGAIPSSLS ELPNLGALRL DRNKLTGHIP ISFGQFIGNV PDLYLSHNQL SGNIPTSFAQ MDFTSIDLSR NKLEGDASVI FGLNKTTQIV DLSRNLLEFN LSKVEFPTSL TSLDINHNKI YGSIPVEFTQ LNFQFLNVSY NRLCGQIPVG GKLQSFDEYS YFHNRCLCGA PLPSCK High Stringency Filter
Cell. 2010 May 28; 141(5): 897 -907. Precision mapping of an in vivo Nglycoproteome reveals rigid topological and sequence constraints. Zielinska DF, Gnad F, Wiśniewski JR, Mann M. >6, 000 Sites Mapped from Mouse Organs >99% of Sites Match N-X-S/T(C), X is not Pro, ~1% of sites used Cys in place of S/T Small percentage of sites (<1%) were N-X-V or NG (Real of False-Positives? ? ? )
O-Glycopeptides Gal. NAc Man Fuc Glc Gal Xyl Glc. NAc Ser/Thr Hyl Ser Hyp Ser/Thr No PNGase. F equivalent for O-Glycanse has very restricted specificity
Glycan H N H CH 2 C C DTT CH 2 O -Elimination OH- H Michael Addition N H C C O DTT N H CH 2 C C O O --Can enrich glycopeptides before --Can map via the dehydro-amino acid --Can enrich the peptides after
Differential isotopic tagging of both cysteine and post-translationally modified ser/thr through -elimination/Michael addition with light (d 0) and heavy (d 6) DTT. O S H ICH 2 C N H C NH 2 -Elimination C CH 2 H O Alkylated Cysteine N H C C Light DTT (d 0) O Dehydroalanine (or (Glc. NAc or phosphate) O H N H CH 2 C DTT (d 0 or d 6) Michael Addition -Elimination or Heavy DTT (d 6) N H OH OH HSCH 2 CHCHCH 2 SH OH HSCd 2 Cd. Cd 2 SH OH C O O-Glc. NAc or O-phosphate Modified Serine (or threonine) Concerns: Specificity, efficiency, recovery CH 2 C C O
Quantifying Peptides with D 0 - and D 6 -DTT Theoretical: 1 to 1 ; Experimental 1 to 0. 98, 1 fmol scale
Site Mapping and Characterization -Where we want to be! M P Q N G S W E K A F S Y D P R S I T I H C A N G R E S S M K Q N V S L (75%) (25%) T P G L C
Alpha-Dystroglycan (O-Man/O-Gal. NAc-initiated glycans)
N- and O-linked glycan structures determined by “Total Ion Mapping” with manual interpretation • Full MS and TIM spectra were obtained for mouse ES, EB, and Ex. E • Spectra analyzed, glycans identified, and quantitated • Directed MSn analysis performed as necessary to clarify structures • Expressed as “% of total” glycan profile Method described in: Aoki, K. , Perlman, M. , Lim, J. M. , Cantu, R. , Wells, L. , and Tiemeyer, M. (2007) J Biol Chem 282, 9127 -9142
Figure 2. Released O-Man and O-Gal. NAc linked glycans
Identification of Glycans using TIM-MS
Pseudo Neutral Loss Activated Data Dependant MS 3 for Glycopeptide Mapping MS Survey Scan MS survey scan MS/MS scan Neutral loss? No Yes Top N peaks? Yes No SEQUEST ID MS/MS/MS scan If we have purified protein and glycomics data http: //www. thermo. com
Figure 3. Fragmentation of O-Gal. NAc a-DG glycopeptide
Assignment of Glycan Structure by Residue JBC 2010, 285: 24882
Assignment of Modified Glycopeptide Assignment of the phosphorylated trisaccharide structure to a specific glycopeptide of alpha-dystroglycan using MSn approaches. Displayed is a MS 3 spectra demonstrating the presence of the phoshotrisaccharide. Science 2010 327: 88
Another O-Glycan site mapping solution High Collision Dissociation (HCD) Fragmentation Generating oxonium ions Electron Transfer Dissociation (ETD) Fragmentation Targeting Modified peptides Peptide Sequencing and Modification Site Mapping JPR 2011 10: 4088
657. 83 MH, 1313. 48 y 11, 1216. 61 y 10, 1129. 55 y 11 -Hex. NAc, 1013. 54 y 9, 1030. 51 y 10 -Hex. NAc, 926. 50 y 6, 544. 28 y 7, 834. 40 Hex. NAc-66+1, 138. 05 y 7 y 6 Glc. NAc b 7, 827. 43 y 9 -HHex. NAc, 827. 43 MH-Hex. NAc+2, 555. 80 b 3 -H 2 O, 266. 15 Hex. NAc+1, 204. 09 y 9 -Hex. NAc+2, 414. 22 MH-Hex. NAc, 1110. 58 y 7 -Hex. NAc, 631. 31 y 8 -Hex. NAc, 730. 38 MH+2, y 5, 487. 26 b 3, 284. 16 Hex. NAc-78+1, 126. 05 144. 06 b 2 -H 2 O, 167. 08 Hex. NAc-H 2 O+1, 186. 07 y 10 -Hex. NAc+2, 463. 75 y 3, 329. 19 Hex. NAc-60+1, S+Hex. NAc 290. 12 m/z HCD spectra PSVPV S GSAPGR
201. 85 8 D b 2, 154. 548 100 90 HCD (zoomed in) Glc. NAc 80 PGGSTPVSSANMM 70 138. 054 [C 7 H 8 O 2 N]+ 50 30 126. 054 [C 6 H 8 O 2 N]+ 168. 064 [C 8 H 10 O 3 N]+ 144. 064 [C 6 H 10 O 3 N]+ 172. 74 1 179. 02 4 122. 11 2 40 186. 075 [C 8 H 12 O 4 N]+ 204. 084 Hex. NAc+1 [C 8 H 14 O 5 N]+ 239. 00 7 Relative Abundance 60 20 10 0 110 130 150 170 m/z 190 210 230 250
c 11, 1155. 37 z 10 -H 2 O, 1094. 79 z 10, 1113. 58 z 11, 1200. 57 y 11, 1216. 62 y 9, 1030. 77 z 6, 529. 60 MH-H 2 O, 1297. 53 z 7, 819. 61 S+Hex. NAc 290. 01 m/z z 8, 918. 54 c 11 -Hex. NAc, 952. 43 b 6, 769. 57 z 5, 472. 66 z 4, 385. 51 z 7 -Hex. NAc, 616. 57 y 8+3, 312. 50 y 2, 232. 33 Glc. NAc MH+2, 657. 51 MH, 1314. 58 z 6 z 7 PSVPV S GSAPGR ETD spectra
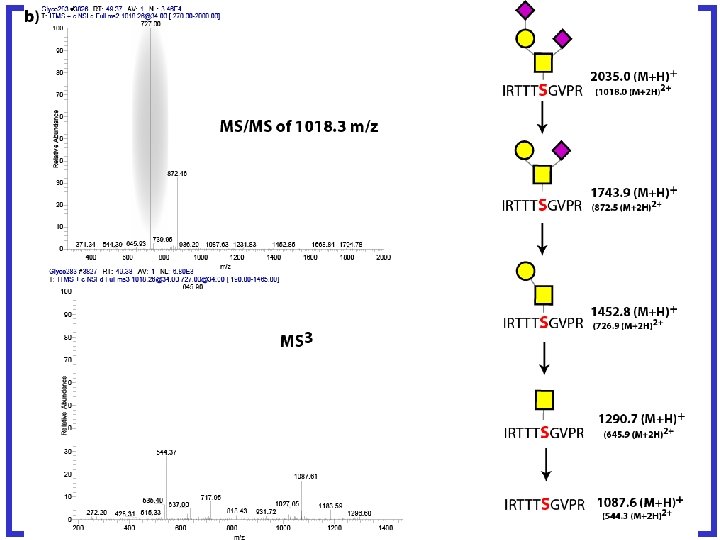
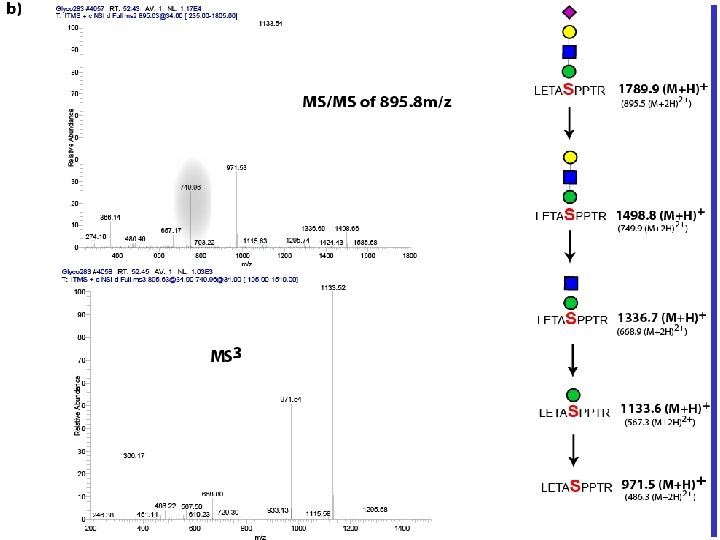
Simultaneous O-Man and O-Gal. NAc Analysis by ETD MS/MS +3, 620. 6 m/z +1, 1857. 9 m/z Ac-IRT*T*T^S^GVPR-NH 2 * Man ^ Gal. NAc C 9 (Z 10) Z 10 Z 3 C 7 C 3* Z 9 C 2 C 5^ Z 7* Z 5^ Z 4 C 4* Z 6^ (C 10) C 6^ Z 8* C 8 C 10
Take Home Points 1. Quantitative Glycomic Platforms Exist 2. Automation of Analysis for HTG well under development 3. Glycopeptide analysis can use glycomics and proteomics to confine the search space and for structural determination 4. Pseudo-NL MSn approaches work for direct glycopeptide analysis 5. Ex. D (ETD, ECD, etc. ) are very promising for glycopeptides 6. HCD-triggered ETD approaches for mining deep and can aid in confident assignment