ICCS eNewsletter CSI Yao Schmidt MD Department of

- Slides: 36
ICCS e-Newsletter CSI Yao Schmidt, MD Department of Pathology University of Texas Southwestern Medical Center Dallas, Texas 03/23/2014
Clinical History • The patient is a 78 year-old female with anemia and neutropenia. • On physical exam, the patient was slightly pale, otherwise unremarkable without hepatosplenomegaly or lymphadenopathy
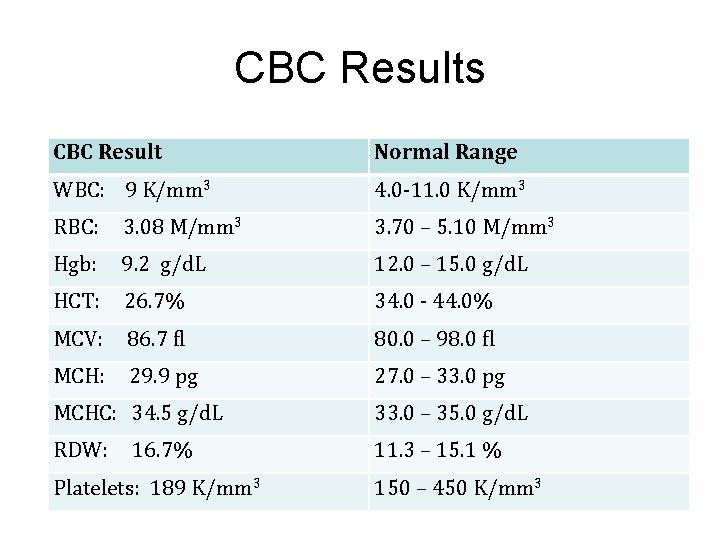
CBC Results CBC Result Normal Range WBC: 9 K/mm 3 4. 0 -11. 0 K/mm 3 RBC: 3. 08 M/mm 3 3. 70 – 5. 10 M/mm 3 Hgb: 9. 2 g/d. L 12. 0 – 15. 0 g/d. L HCT: 26. 7% 34. 0 - 44. 0% MCV: 86. 7 fl 80. 0 – 98. 0 fl MCH: 29. 9 pg 27. 0 – 33. 0 pg MCHC: 34. 5 g/d. L 33. 0 – 35. 0 g/d. L RDW: 11. 3 – 15. 1 % 16. 7% Platelets: 189 K/mm 3 150 – 450 K/mm 3
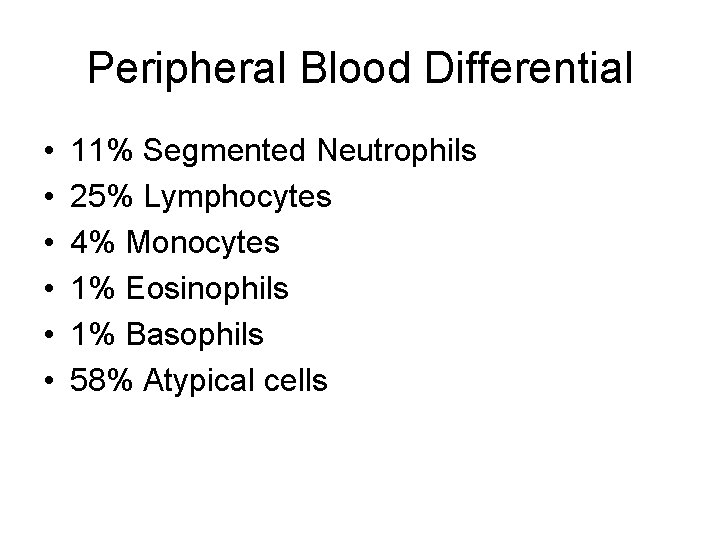
Peripheral Blood Differential • • • 11% Segmented Neutrophils 25% Lymphocytes 4% Monocytes 1% Eosinophils 1% Basophils 58% Atypical cells
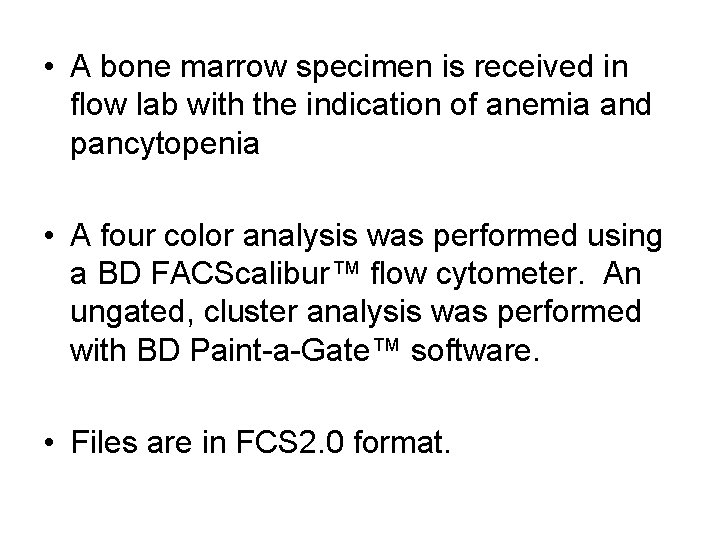
• A bone marrow specimen is received in flow lab with the indication of anemia and pancytopenia • A four color analysis was performed using a BD FACScalibur™ flow cytometer. An ungated, cluster analysis was performed with BD Paint-a-Gate™ software. • Files are in FCS 2. 0 format.
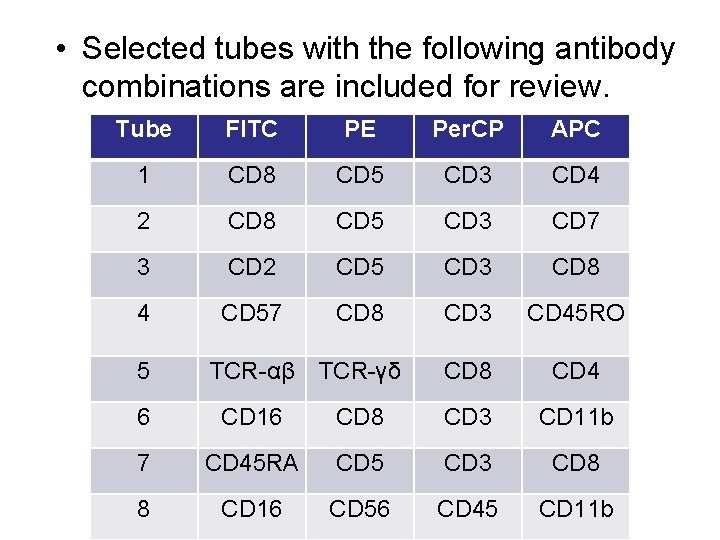
• Selected tubes with the following antibody combinations are included for review. Tube FITC PE Per. CP APC 1 CD 8 CD 5 CD 3 CD 4 2 CD 8 CD 5 CD 3 CD 7 3 CD 2 CD 5 CD 3 CD 8 4 CD 57 CD 8 CD 3 CD 45 RO 5 TCR-αβ TCR-γδ CD 8 CD 4 6 CD 16 CD 8 CD 3 CD 11 b 7 CD 45 RA CD 5 CD 3 CD 8 8 CD 16 CD 56 CD 45 CD 11 b
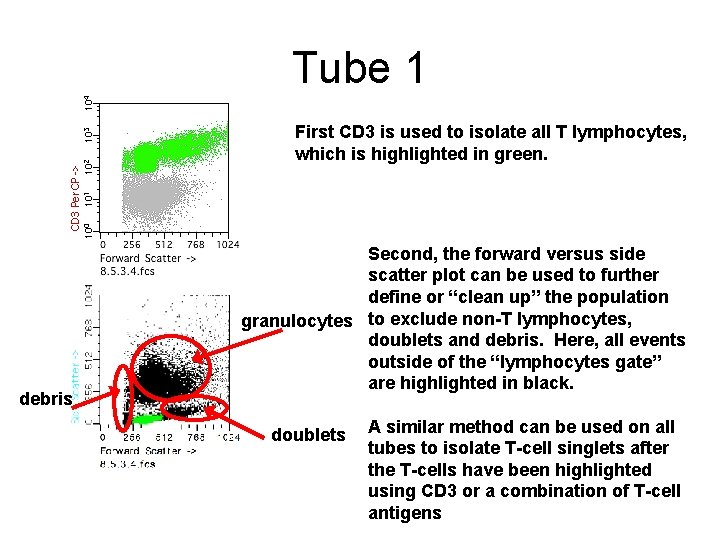
Tube 1 First CD 3 is used to isolate all T lymphocytes, which is highlighted in green. debris Second, the forward versus side scatter plot can be used to further define or “clean up” the population granulocytes to exclude non-T lymphocytes, doublets and debris. Here, all events outside of the “lymphocytes gate” are highlighted in black. doublets A similar method can be used on all tubes to isolate T-cell singlets after the T-cells have been highlighted using CD 3 or a combination of T-cell antigens
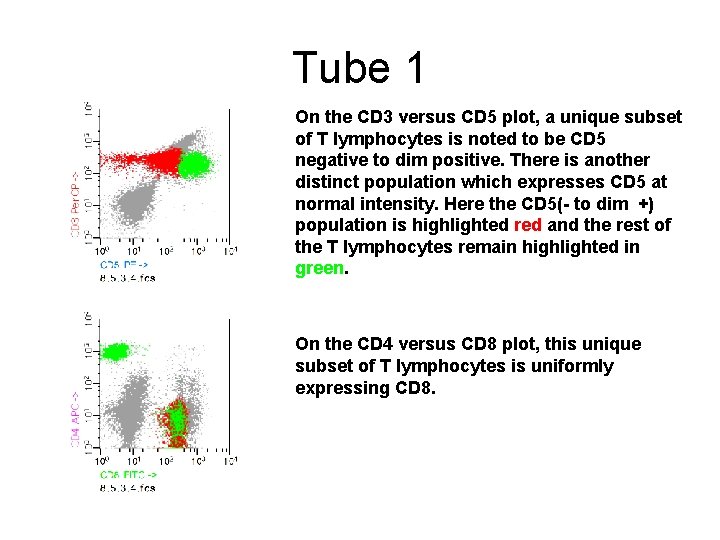
Tube 1 On the CD 3 versus CD 5 plot, a unique subset of T lymphocytes is noted to be CD 5 negative to dim positive. There is another distinct population which expresses CD 5 at normal intensity. Here the CD 5(- to dim +) population is highlighted red and the rest of the T lymphocytes remain highlighted in green. On the CD 4 versus CD 8 plot, this unique subset of T lymphocytes is uniformly expressing CD 8.
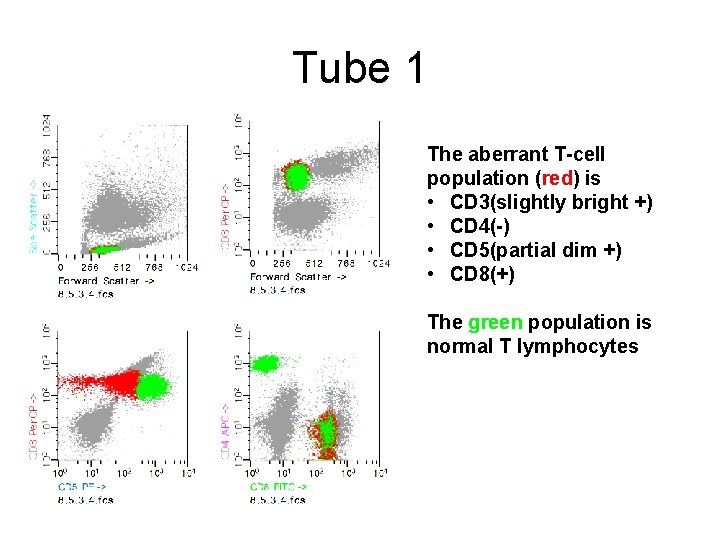
Tube 1 The aberrant T-cell population (red) is • CD 3(slightly bright +) • CD 4(-) • CD 5(partial dim +) • CD 8(+) The green population is normal T lymphocytes
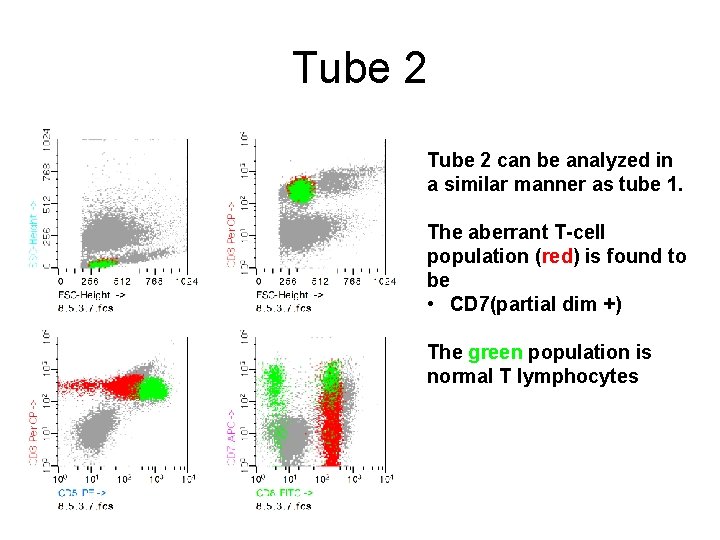
Tube 2 can be analyzed in a similar manner as tube 1. The aberrant T-cell population (red) is found to be • CD 7(partial dim +) The green population is normal T lymphocytes
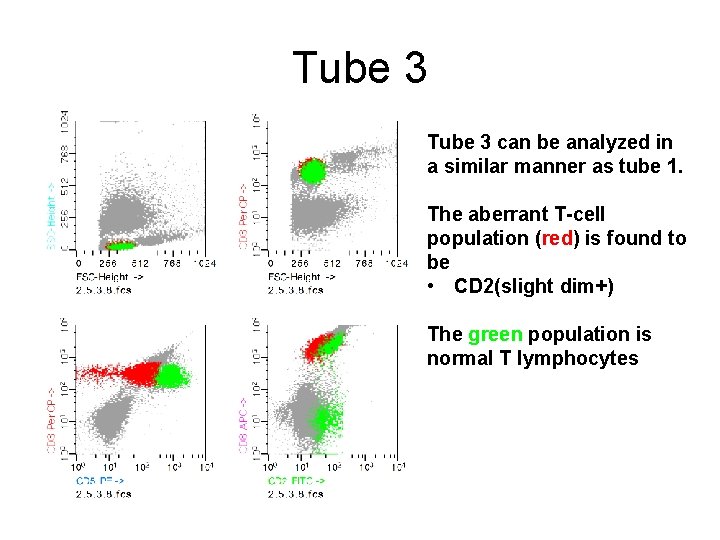
Tube 3 can be analyzed in a similar manner as tube 1. The aberrant T-cell population (red) is found to be • CD 2(slight dim+) The green population is normal T lymphocytes
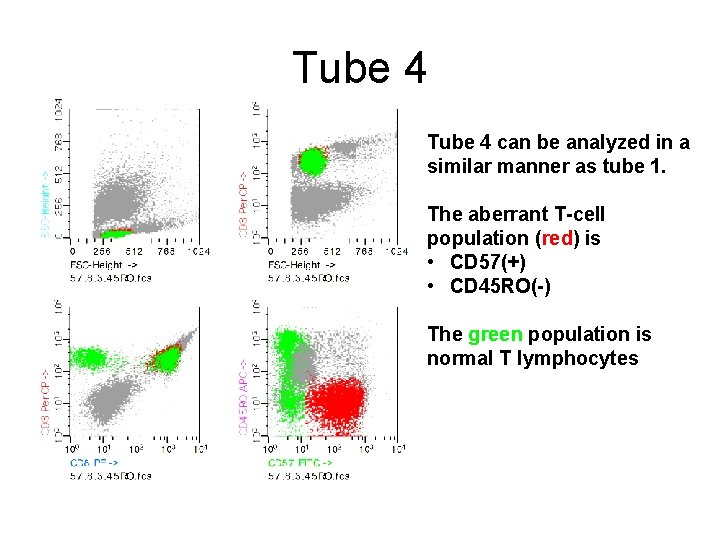
Tube 4 can be analyzed in a similar manner as tube 1. The aberrant T-cell population (red) is • CD 57(+) • CD 45 RO(-) The green population is normal T lymphocytes
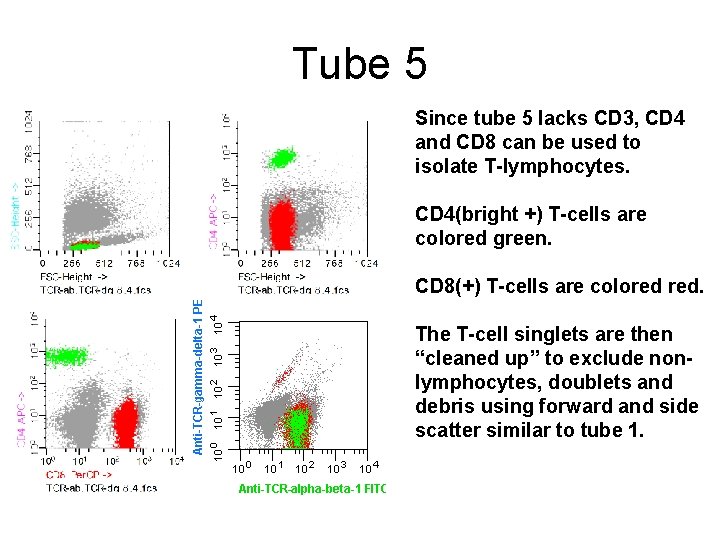
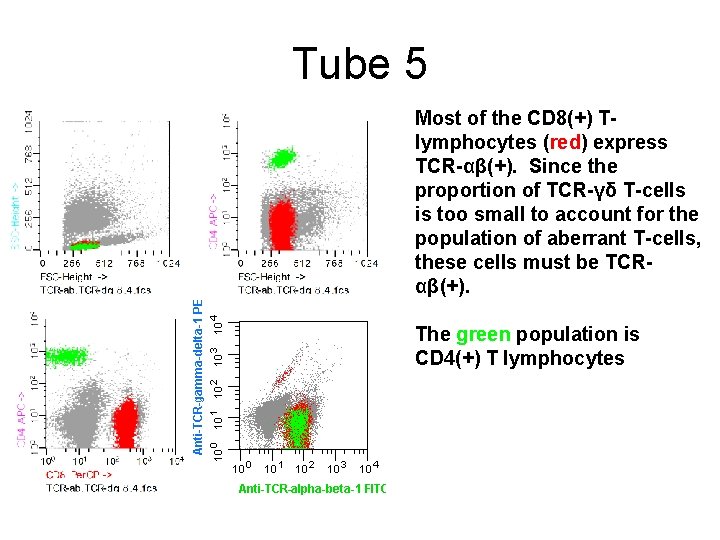
Tube 5 Since tube 5 lacks CD 3, CD 4 and CD 8 can be used to isolate T-lymphocytes. CD 4(bright +) T-cells are colored green. CD 8(+) T-cells are colored red. The T-cell singlets are then “cleaned up” to exclude nonlymphocytes, doublets and debris using forward and side scatter similar to tube 1.
Tube 5 Most of the CD 8(+) Tlymphocytes (red) express TCR-αβ(+). Since the proportion of TCR-γδ T-cells is too small to account for the population of aberrant T-cells, these cells must be TCRαβ(+). The green population is CD 4(+) T lymphocytes
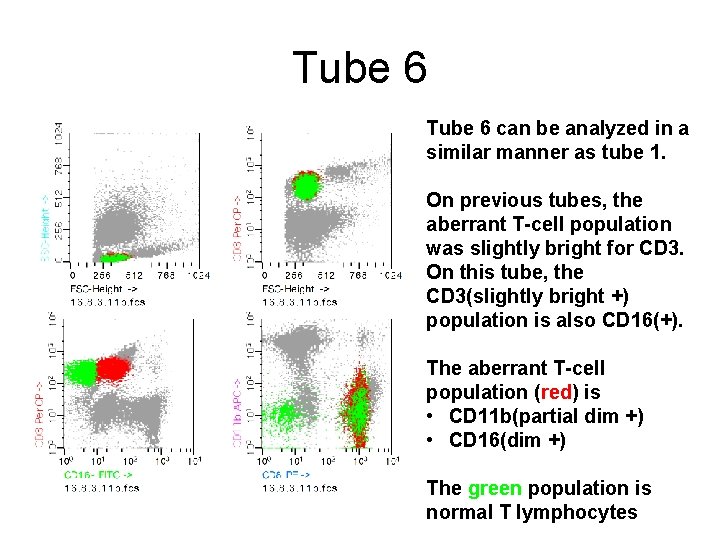
Tube 6 can be analyzed in a similar manner as tube 1. On previous tubes, the aberrant T-cell population was slightly bright for CD 3. On this tube, the CD 3(slightly bright +) population is also CD 16(+). The aberrant T-cell population (red) is • CD 11 b(partial dim +) • CD 16(dim +) The green population is normal T lymphocytes
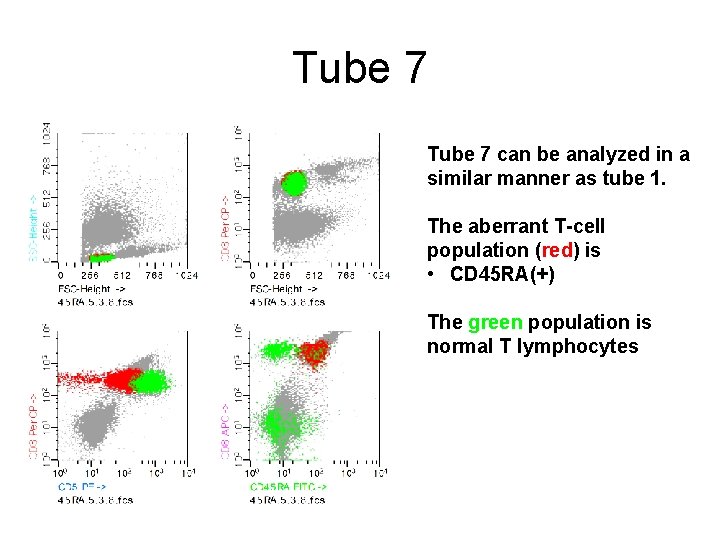
Tube 7 can be analyzed in a similar manner as tube 1. The aberrant T-cell population (red) is • CD 45 RA(+) The green population is normal T lymphocytes
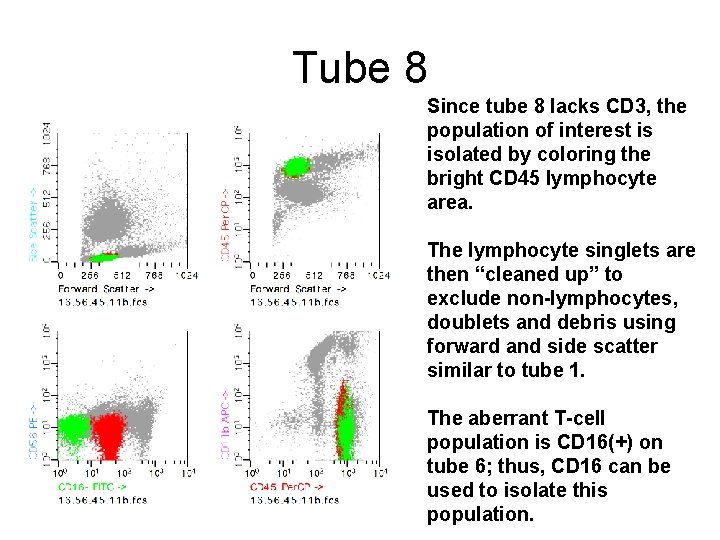
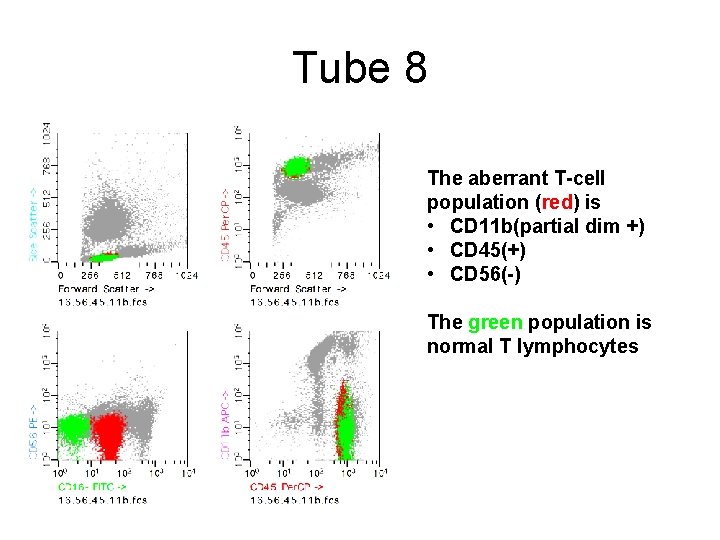
Tube 8 Since tube 8 lacks CD 3, the population of interest is isolated by coloring the bright CD 45 lymphocyte area. The lymphocyte singlets are then “cleaned up” to exclude non-lymphocytes, doublets and debris using forward and side scatter similar to tube 1. The aberrant T-cell population is CD 16(+) on tube 6; thus, CD 16 can be used to isolate this population.
Tube 8 The aberrant T-cell population (red) is • CD 11 b(partial dim +) • CD 45(+) • CD 56(-) The green population is normal T lymphocytes
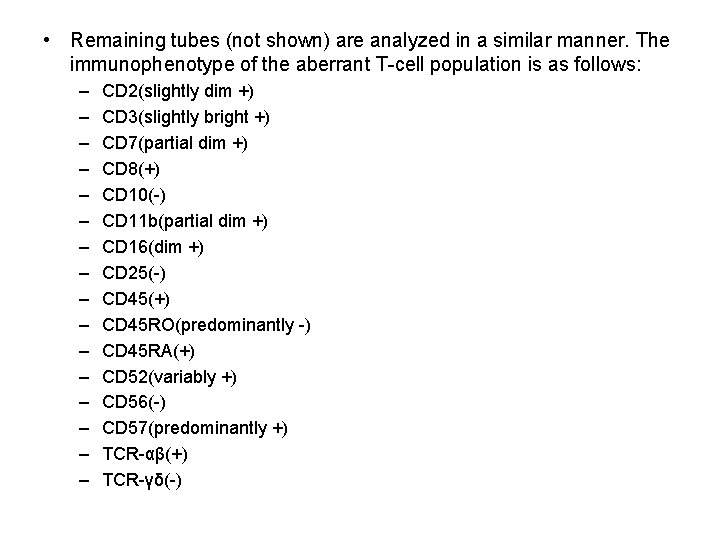
• Remaining tubes (not shown) are analyzed in a similar manner. The immunophenotype of the aberrant T-cell population is as follows: – – – – CD 2(slightly dim +) CD 3(slightly bright +) CD 7(partial dim +) CD 8(+) CD 10(-) CD 11 b(partial dim +) CD 16(dim +) CD 25(-) CD 45(+) CD 45 RO(predominantly -) CD 45 RA(+) CD 52(variably +) CD 56(-) CD 57(predominantly +) TCR-αβ(+) TCR-γδ(-)
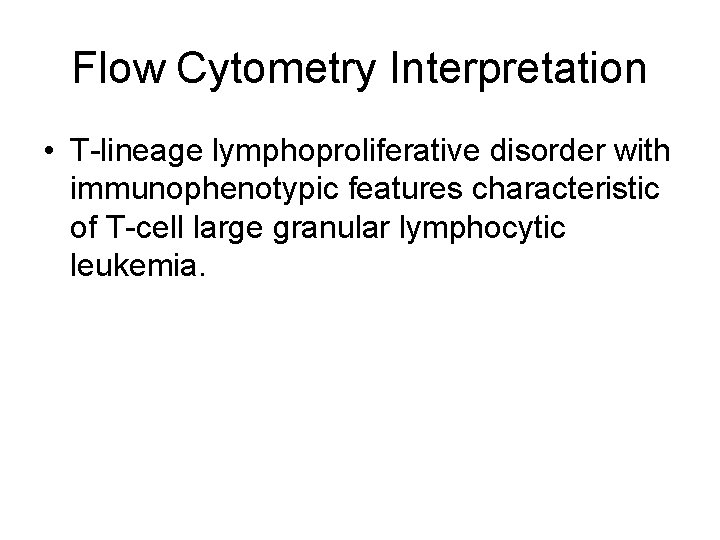
Flow Cytometry Interpretation • T-lineage lymphoproliferative disorder with immunophenotypic features characteristic of T-cell large granular lymphocytic leukemia.
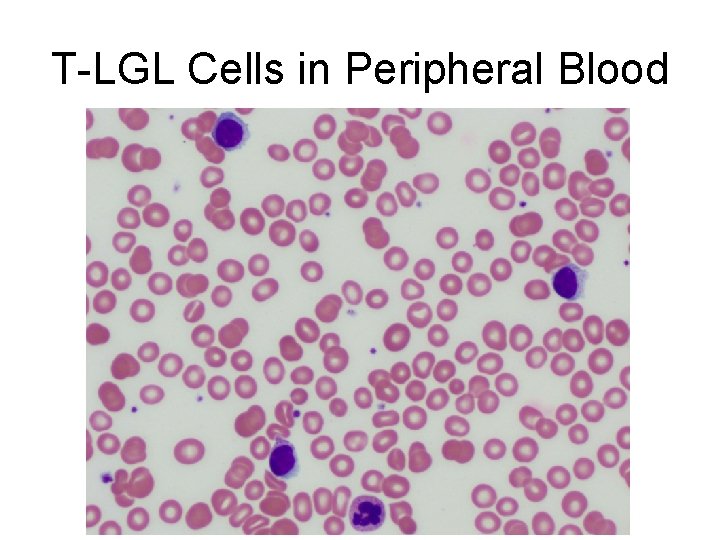
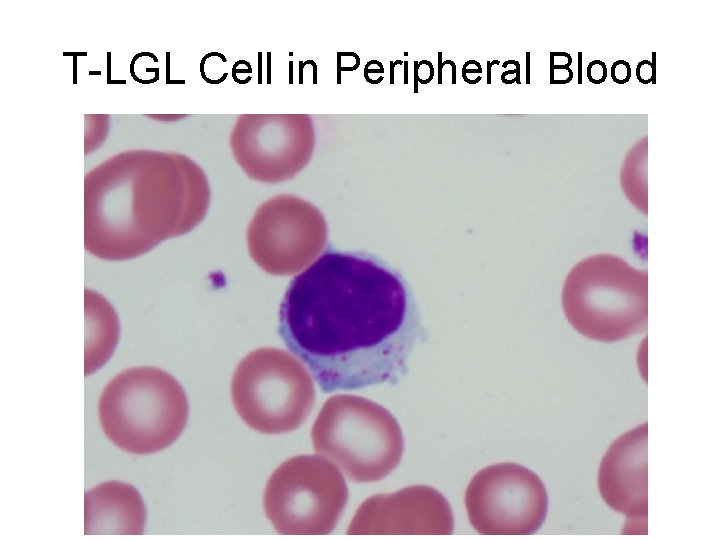
T-LGL Cells in Peripheral Blood
T-LGL Cell in Peripheral Blood
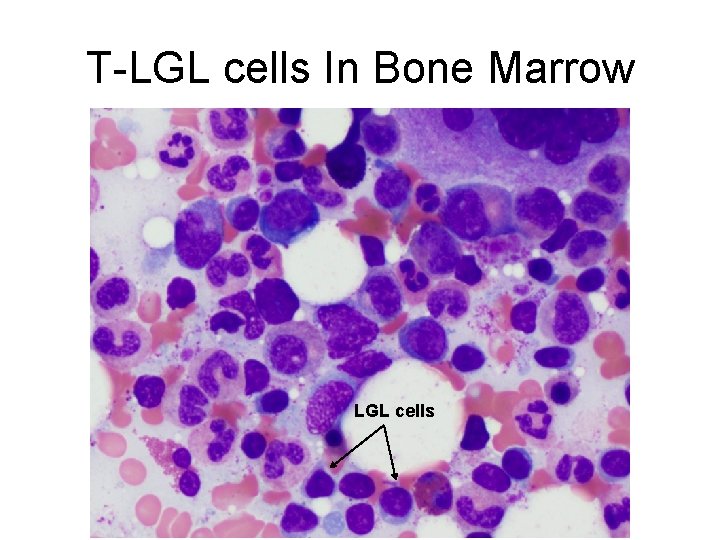
T-LGL cells In Bone Marrow LGL cells
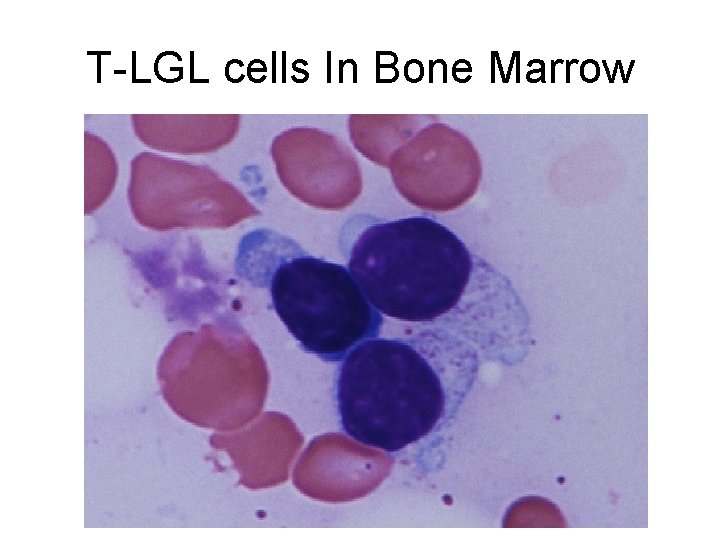
T-LGL cells In Bone Marrow
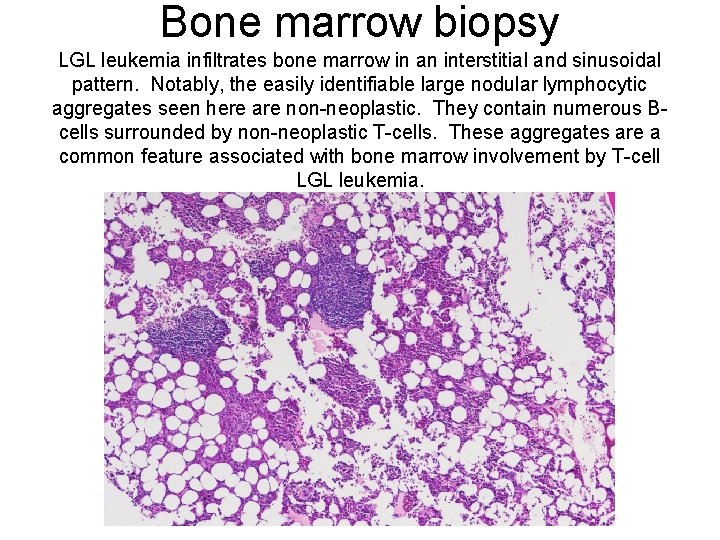
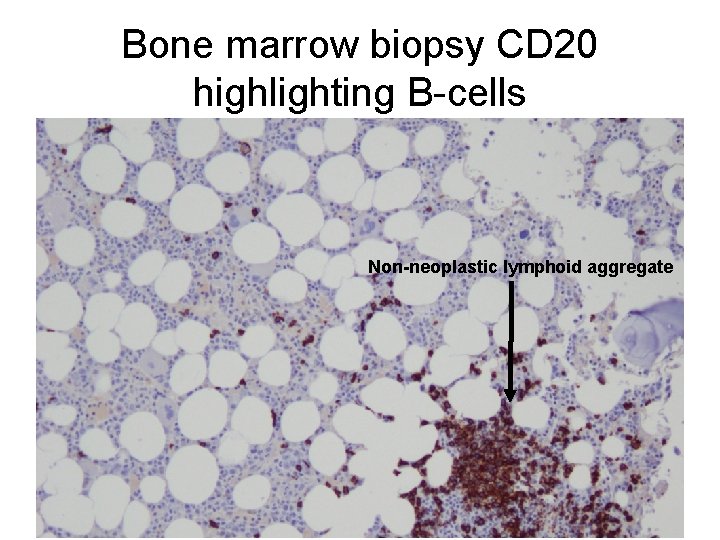
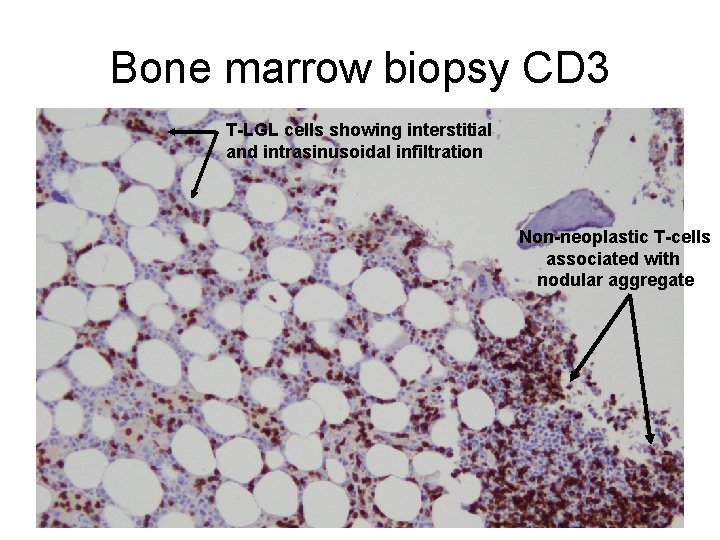
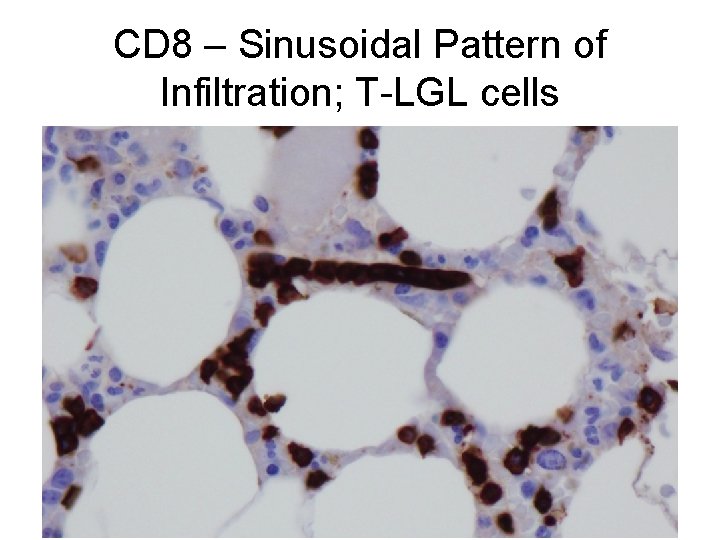
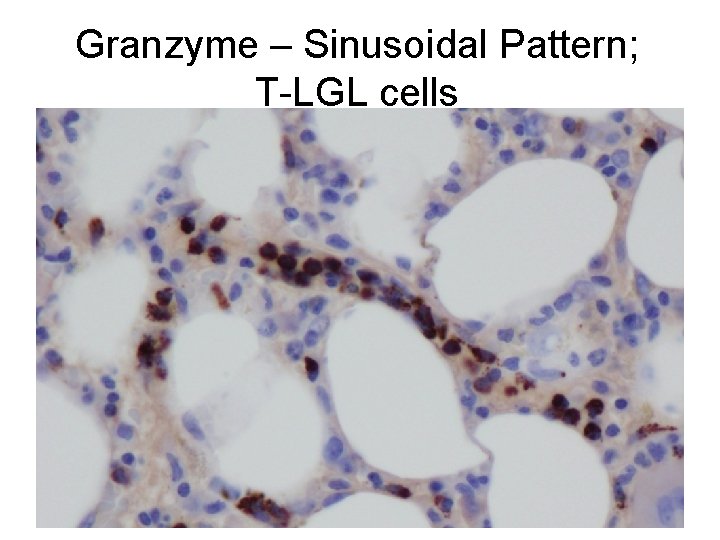
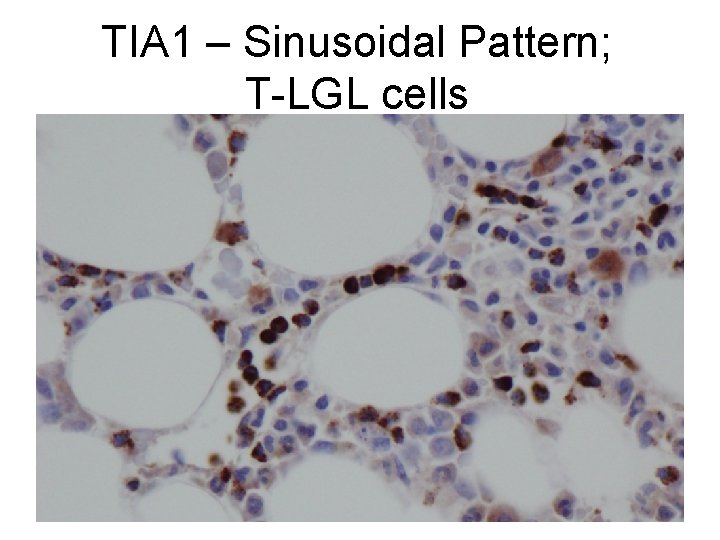
Bone marrow biopsy LGL leukemia infiltrates bone marrow in an interstitial and sinusoidal pattern. Notably, the easily identifiable large nodular lymphocytic aggregates seen here are non-neoplastic. They contain numerous Bcells surrounded by non-neoplastic T-cells. These aggregates are a common feature associated with bone marrow involvement by T-cell LGL leukemia.
Bone marrow biopsy CD 20 highlighting B-cells Non-neoplastic lymphoid aggregate
Bone marrow biopsy CD 3 T-LGL cells showing interstitial and intrasinusoidal infiltration Non-neoplastic T-cells associated with nodular aggregate
CD 8 – Sinusoidal Pattern of Infiltration; T-LGL cells
Granzyme – Sinusoidal Pattern; T-LGL cells
TIA 1 – Sinusoidal Pattern; T-LGL cells
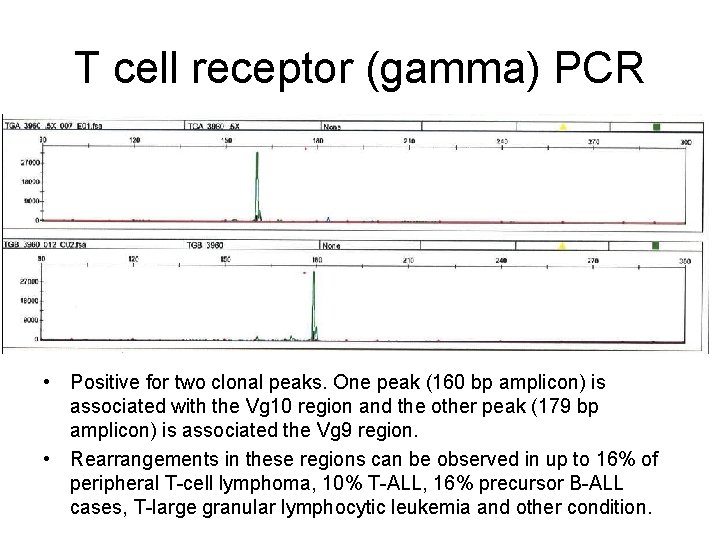
T cell receptor (gamma) PCR • Positive for two clonal peaks. One peak (160 bp amplicon) is associated with the Vg 10 region and the other peak (179 bp amplicon) is associated the Vg 9 region. • Rearrangements in these regions can be observed in up to 16% of peripheral T-cell lymphoma, 10% T-ALL, 16% precursor B-ALL cases, T-large granular lymphocytic leukemia and other condition.
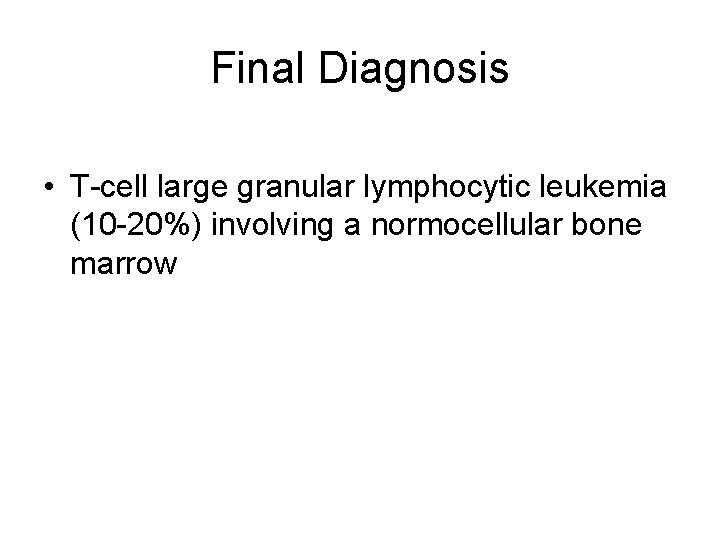
Final Diagnosis • T-cell large granular lymphocytic leukemia (10 -20%) involving a normocellular bone marrow
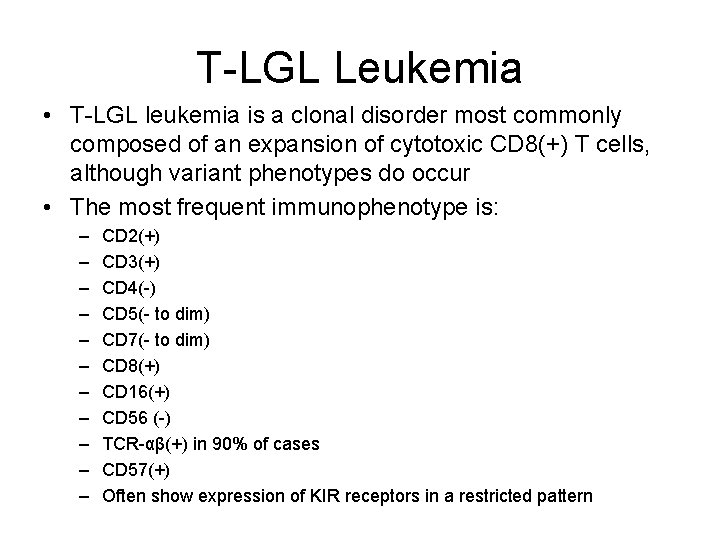
T-LGL Leukemia • T-LGL leukemia is a clonal disorder most commonly composed of an expansion of cytotoxic CD 8(+) T cells, although variant phenotypes do occur • The most frequent immunophenotype is: – – – CD 2(+) CD 3(+) CD 4(-) CD 5(- to dim) CD 7(- to dim) CD 8(+) CD 16(+) CD 56 (-) TCR-αβ(+) in 90% of cases CD 57(+) Often show expression of KIR receptors in a restricted pattern
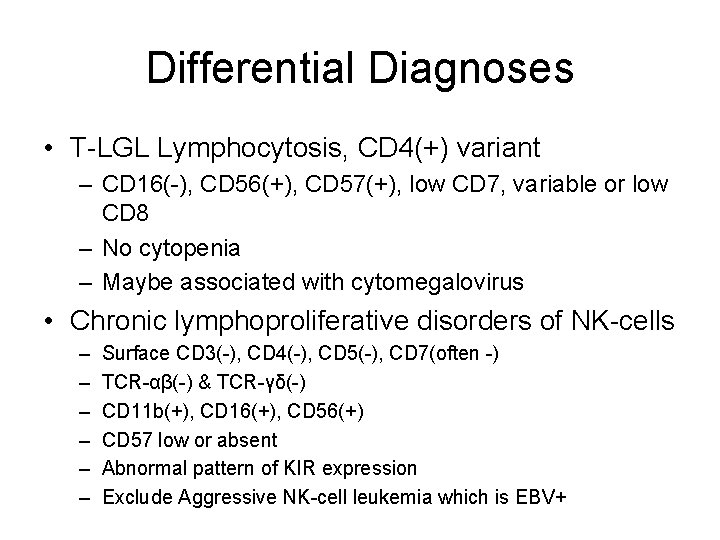
Differential Diagnoses • T-LGL Lymphocytosis, CD 4(+) variant – CD 16(-), CD 56(+), CD 57(+), low CD 7, variable or low CD 8 – No cytopenia – Maybe associated with cytomegalovirus • Chronic lymphoproliferative disorders of NK-cells – – – Surface CD 3(-), CD 4(-), CD 5(-), CD 7(often -) TCR-αβ(-) & TCR-γδ(-) CD 11 b(+), CD 16(+), CD 56(+) CD 57 low or absent Abnormal pattern of KIR expression Exclude Aggressive NK-cell leukemia which is EBV+
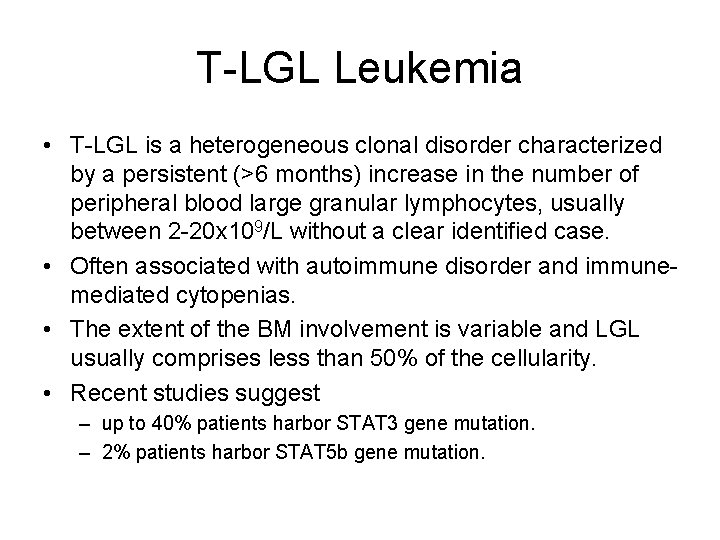
T-LGL Leukemia • T-LGL is a heterogeneous clonal disorder characterized by a persistent (>6 months) increase in the number of peripheral blood large granular lymphocytes, usually between 2 -20 x 109/L without a clear identified case. • Often associated with autoimmune disorder and immunemediated cytopenias. • The extent of the BM involvement is variable and LGL usually comprises less than 50% of the cellularity. • Recent studies suggest – up to 40% patients harbor STAT 3 gene mutation. – 2% patients harbor STAT 5 b gene mutation.
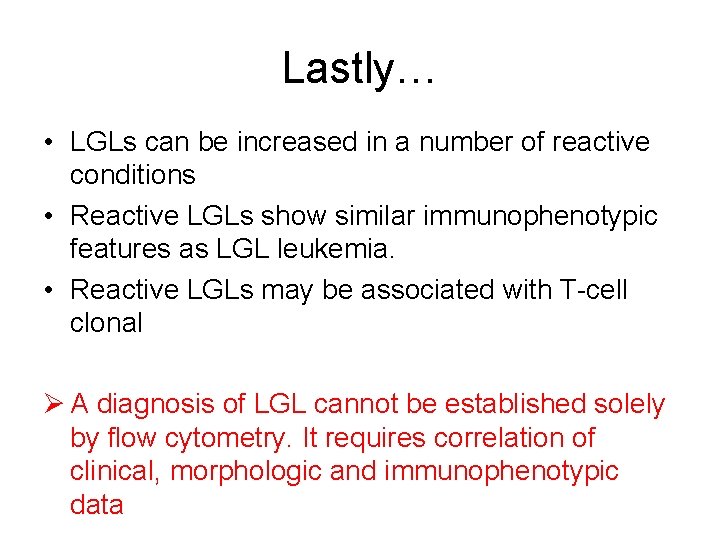
Lastly… • LGLs can be increased in a number of reactive conditions • Reactive LGLs show similar immunophenotypic features as LGL leukemia. • Reactive LGLs may be associated with T-cell clonal Ø A diagnosis of LGL cannot be established solely by flow cytometry. It requires correlation of clinical, morphologic and immunophenotypic data