Box Plots Higher GCSE Questions AQA These questions

Box Plots – Higher – GCSE Questions – AQA These questions are the same format as previous GCSE exams. COPY means they use the exact same numbers as the original GCSE question. Otherwise, they are clone questions using different numbers. The worksheets are provided in 2 sizes.

Printing To print handouts from slides Select the slide from the left. Then click: File > Print > ‘Print Current Slide’ To print multiple slides Click on a section title to highlight all those slides, or press ‘Ctrl’ at the same time as selecting slides to highlight more than one. Then click: File > Print > ‘Print Selection’ To print double-sided handouts Highlight both slides before using ‘Print Selection’. Choose ‘Print on Both Sides’ and ‘Flip on Short Edge’.

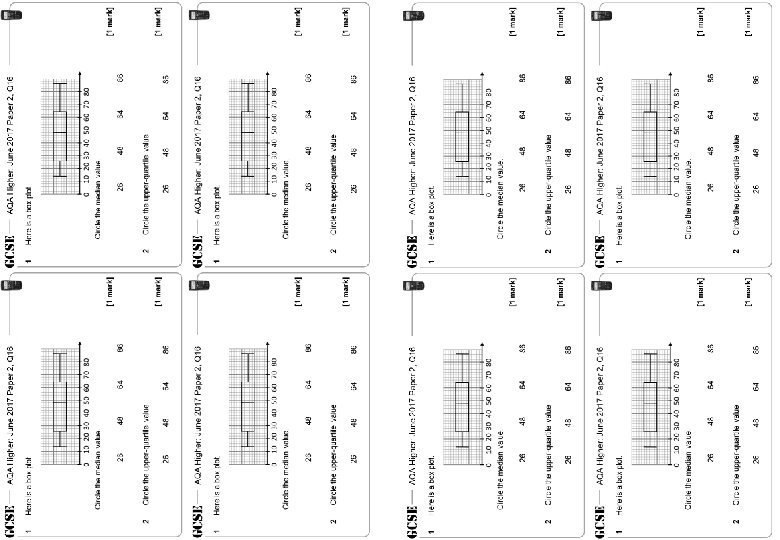
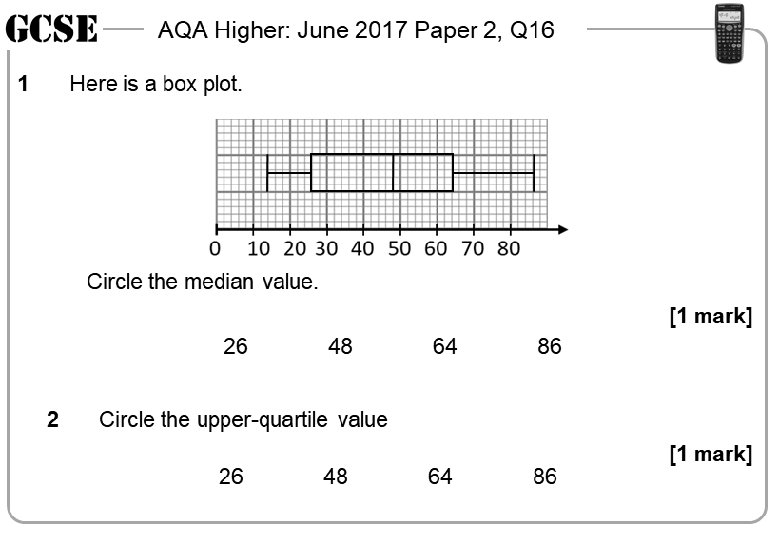
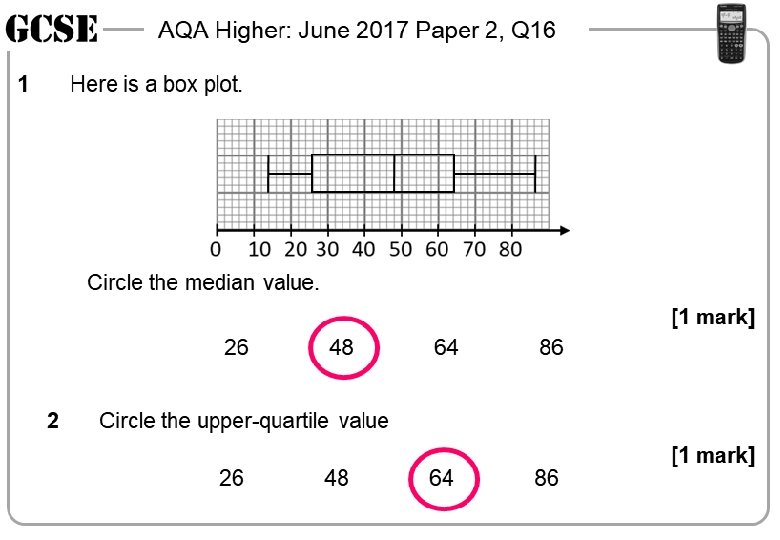
AQA Higher: June 2017 Paper 2, Q 16 1 AQA Higher: June 2017 Paper 2, Q 16 Here is a box plot. 1 Here is a box plot. Circle the median value. [1 mark] 26 2 48 64 [1 mark] 86 26 Circle the upper-quartile value 26 48 2 64 86 [1 mark] 1 64 86 Circle the upper-quartile value 26 AQA Higher: June 2017 Paper 2, Q 16 48 48 AQA Higher: June 2017 Paper 2, Q 16 Here is a box plot. 1 Here is a box plot. Circle the median value. [1 mark] 26 2 48 64 48 [1 mark] 86 26 Circle the upper-quartile value 26 [1 mark] 2 64 86 [1 mark] 48 64 86 Circle the upper-quartile value 26 48 [1 mark]

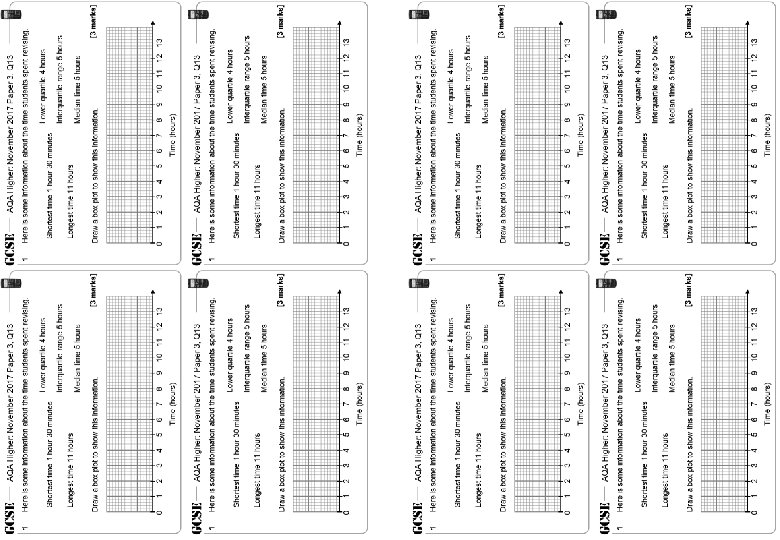
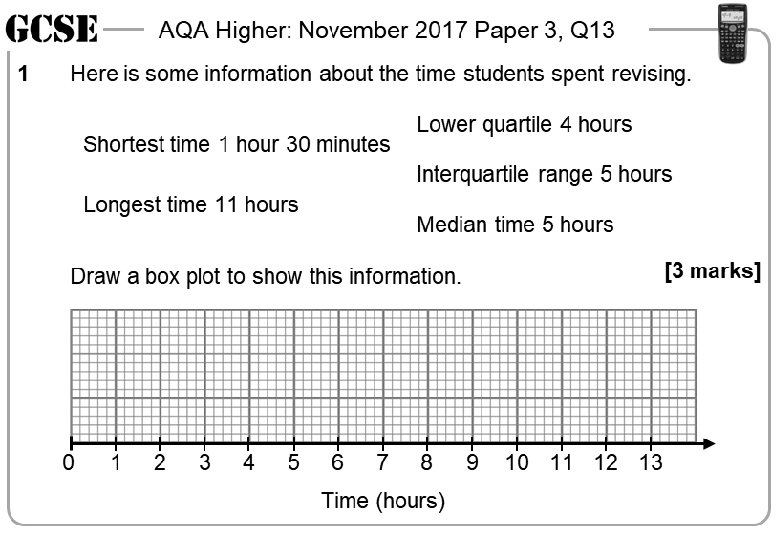
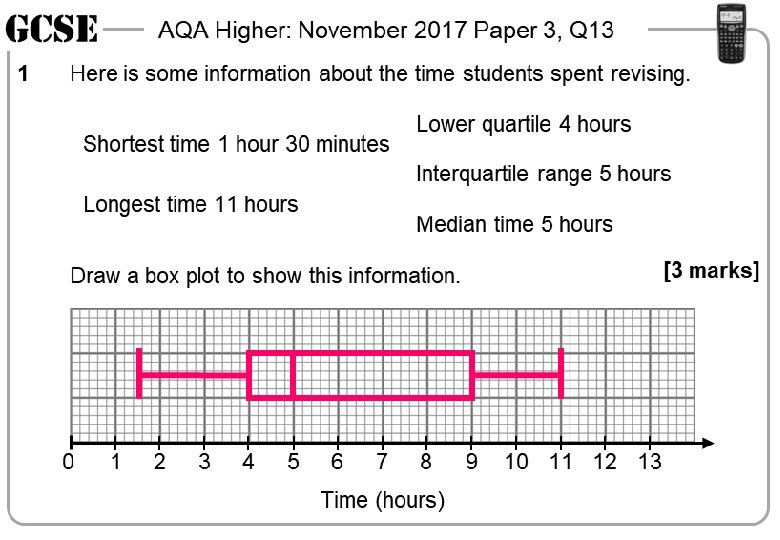
AQA Higher: November 2017 Paper 3, Q 13 1 AQA Higher: November 2017 Paper 3, Q 13 Here is some information about the time students spent revising. Shortest time 1 hour 30 minutes 1 Here is some information about the time students spent revising. Lower quartile 4 hours Shortest time 1 hour 30 minutes Interquartile range 5 hours Longest time 11 hours 0 1 1 2 3 4 5 Interquartile range 5 hours Longest time 11 hours Median time 5 hours [3 marks] Draw a box plot to show this information. 6 7 8 9 Median time 5 hours 0 1 2 3 4 5 6 7 8 9 10 11 12 13 Time (hours) AQA Higher: November 2017 Paper 3, Q 13 Shortest time 1 hour 30 minutes 1 Here is some information about the time students spent revising. Lower quartile 4 hours Shortest time 1 hour 30 minutes Interquartile range 5 hours Longest time 11 hours [3 marks] 2 3 4 5 6 7 8 Time (hours) 9 10 11 12 13 Lower quartile 4 hours Interquartile range 5 hours Longest time 11 hours Median time 5 hours Draw a box plot to show this information. 1 [3 marks] Draw a box plot to show this information. 10 11 12 13 Here is some information about the time students spent revising. 0 Lower quartile 4 hours Median time 5 hours [3 marks] Draw a box plot to show this information. 0 1 2 3 4 5 6 7 8 Time (hours) 9 10 11 12 13

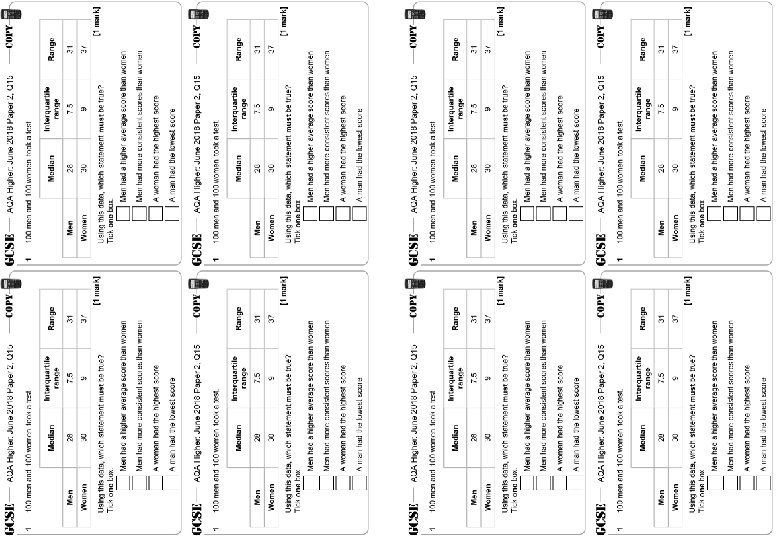
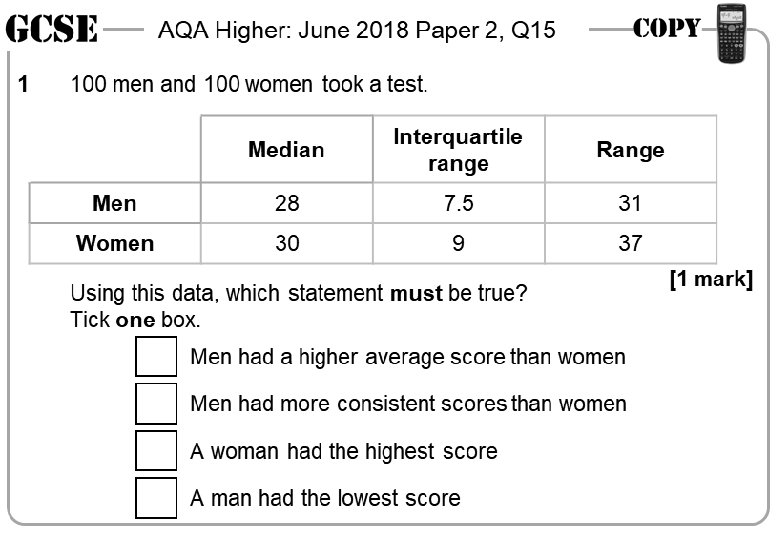
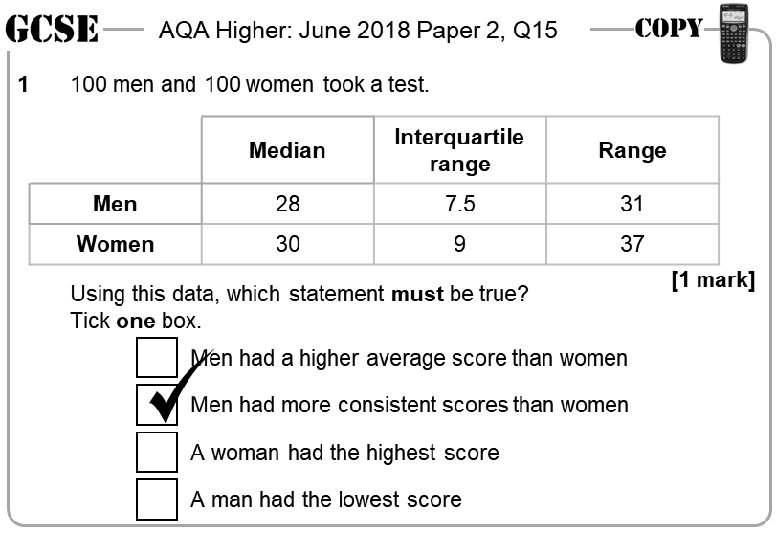
AQA Higher: June 2018 Paper 2, Q 15 100 men and 100 women took a test. 1 Median Interquartile range Range Men 28 7. 5 31 Women 30 9 37 [1 mark] Using this data, which statement must be true? Tick one box. 100 men and 100 women took a test. Median Interquartile range Range Men 28 7. 5 31 Women 30 9 37 Men had a higher average score than women Men had more consistent scores than women A woman had the highest score A man had the lowest score AQA Higher: June 2018 Paper 2, Q 15 1 [1 mark] Using this data, which statement must be true? Tick one box. AQA Higher: June 2018 Paper 2, Q 15 100 men and 100 women took a test. 1 Median Interquartile range Range Men 28 7. 5 31 Women 30 9 37 Using this data, which statement must be true? Tick one box. [1 mark] 100 men and 100 women took a test. Median Interquartile range Range Men 28 7. 5 31 Women 30 9 37 Using this data, which statement must be true? Tick one box. Men had a higher average score than women Men had more consistent scores than women A woman had the highest score A man had the lowest score [1 mark]

Questions? Comments? Suggestions? …or have you found a mistake!? Any feedback would be appreciated . Please feel free to email: tom@goteachmaths. co. uk
- Slides: 15