Avg Diff Min Diff Big Firms N50 211

 211. 08% 1. 34% Small")
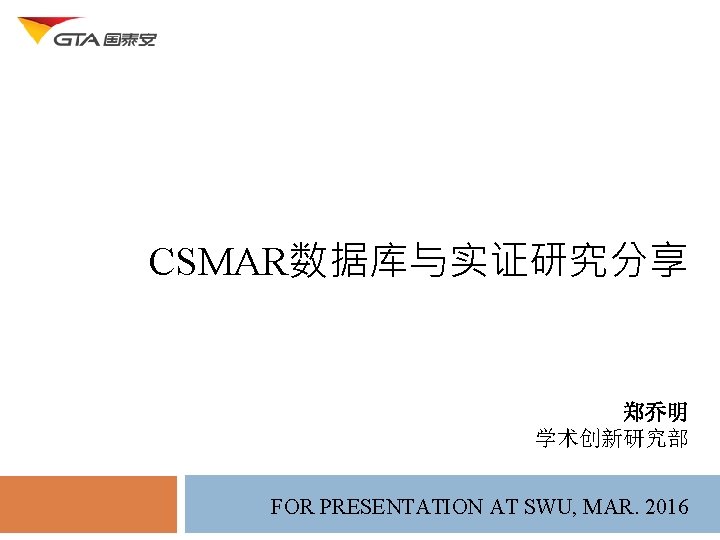
实证案例 实证结果 Avg. Diff Min. Diff Big Firms (N=50) 211. 08% 1. 34% Small Firms (N=50) 260. 26% 2. 76%
 TA(2014) (10 K) Avg. Diff Max. Diff Min. Diff 上海医药 6434056")
实证案例 同业对比(2008 -2014) TA(2014) (10 K) Avg. Diff Max. Diff Min. Diff 上海医药 6434056 28. 93% 93. 63% 0. 62% 京新药业 206466 63. 25% 128. 57% 14. 75% 150. 00% 100. 00% 京新�� 上海医� 50. 00% 2008 -12 -31 2009 -12 -31 2010 -12 -31 2011 -12 -31 2012 -12 -31 2013 -12 -31 2014 -12 -31


实证案例 实证结果 0. 35% 0. 32% Average Abnormal Returns 0. 30% 0. 25% 0. 22% 0. 20% 0. 16% 0. 15% 0. 08% 0. 10% 0. 05% 0. 04% 0. 03% 0. 02% 0. 01% 0. 00% -10 -9 -8 -7 -6 -5 -4 0. 00% -3 -2 -1 0 1 -0. 05% -0. 10% 2 -0. 01% 3 4 5 -0. 01% 6 7 -0. 04% -0. 06% Trade days -0. 03% 8 9 10 -0. 04% -0. 06%

实证案例 实证结果 1. 40% Cumulative Average Abnormal Returns 1. 20% 1. 15% 1. 13% 1. 08% 1. 04% 1. 03% 0. 94% 1. 00%1. 00% 0. 95% 0. 89% 0. 80% 0. 63% 0. 60% 0. 41% 0. 40% 0. 22% 0. 20% 0. 01% 0. 08% 0. 03% 0. 05% 0. 10% 0. 13% 0. 00% -10 -9 -8 -7 -6 -5 -4 -3 -2 -1 0 1 2 3 4 5 6 7 8 9 10
![实证研究案例 Portfolio Complexity by Firm Number Days [-10, -2] Groups High Low DIFF (H](http://slidetodoc.com/presentation_image/789ba25122b63acb1b241b8364ee9fcb/image-10.jpg "实证研究案例 Portfolio Complexity by Firm Number Days [-10, -2] Groups High Low DIFF (H")
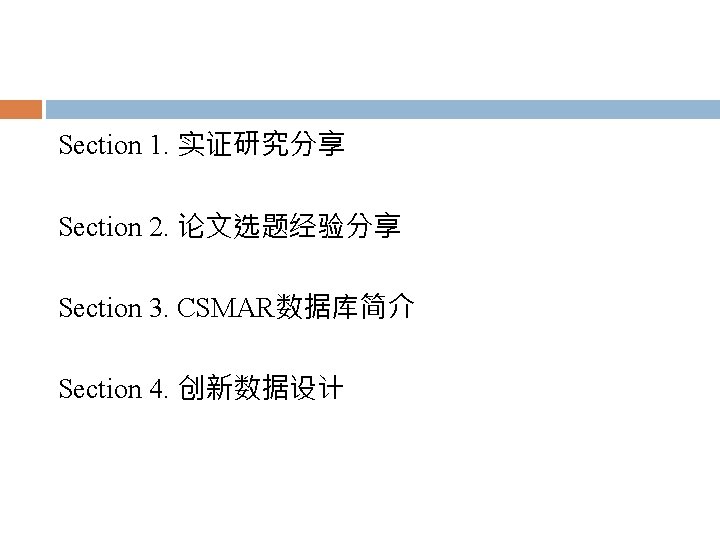
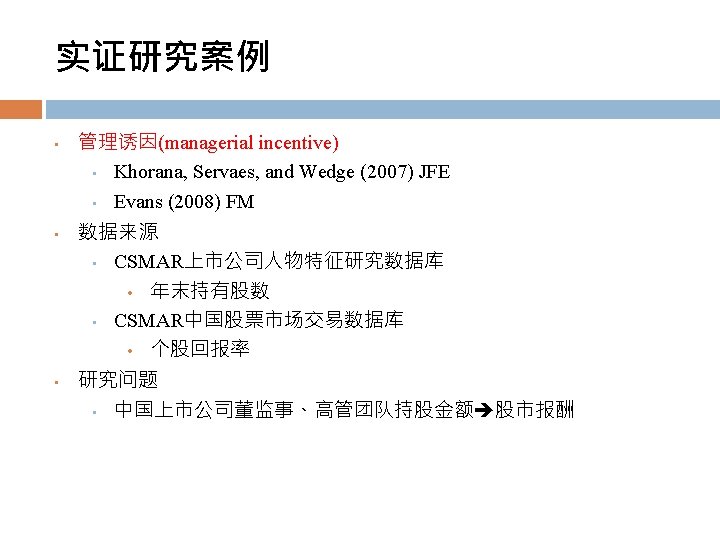
实证研究案例 Portfolio Complexity by Firm Number Days [-10, -2] Groups High Low DIFF (H minus L) [-1, -1] -0. 25%* High Low 0. 66%*** 0. 73%*** -0. 07% High Low -0. 31%** -0. 10% -0. 21%*** High Low 0. 64%** 1. 15%*** -0. 51%* DIFF (H minus L) [2, 10] DIFF (H minus L) [-10, 10] DIFF (H minus L) Mean CAR 0. 29%*** 0. 54%***
![实证研究案例 Prior Performance by Analyst Days [-10, -2] Groups High Low DIFF (H minus](http://slidetodoc.com/presentation_image/789ba25122b63acb1b241b8364ee9fcb/image-11.jpg "实证研究案例 Prior Performance by Analyst Days [-10, -2] Groups High Low DIFF (H minus")
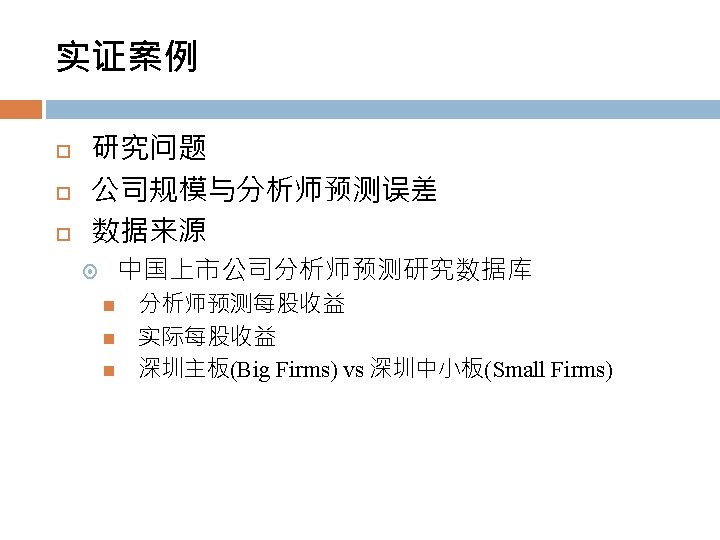
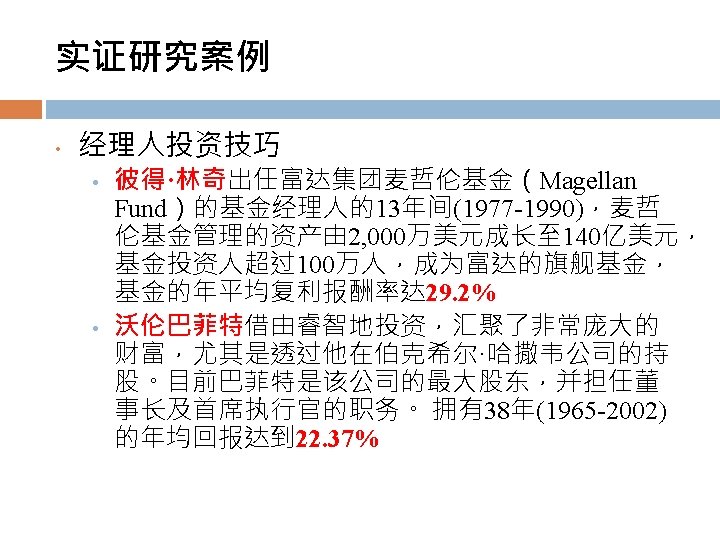
实证研究案例 Prior Performance by Analyst Days [-10, -2] Groups High Low DIFF (H minus L) [-1, -1] -0. 34%** High Low 0. 68%*** 0. 75%*** -0. 07% High Low -0. 39%** 0. 06% -0. 45%** High Low 0. 61%** 1. 47%*** -0. 86%** DIFF (H minus L) [2, 10] DIFF (H minus L) [-10, 10] DIFF (H minus L) Mean CAR 0. 32%*** 0. 67%***

实证研究案例 Morningstar Do managers eat their own cooking?
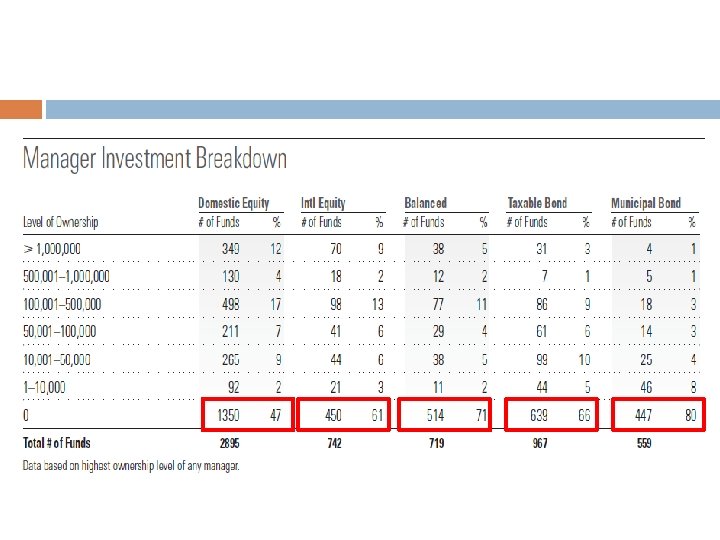

实证研究案例 2012 Group Avg. Group Ownership Ranking Ownership Value Low 2013 Avg. Monthly Returns 10, 259 1. 65% Medium 36, 802, 259 1. 84% High 328, 993, 670 2. 52% H-L Dif. Of Annualized Returns=10. 95%

实证研究案例 2011 Fund Name Avg. Monthly Ret. 银华瑞吉 银华金利 建信稳健 深成收益 中银中小盘成 0. 60 0. 53 0. 52 0. 37 0. 20 Ranking (N=403) 1 2 3 4 5
 Avg. Monthly Ret. Ranking")
实证研究案例 2011 2012 Avg. Ranking Fund Name Monthly Ret. (N=403) Avg. Monthly Ret. Ranking (N=556) 银华瑞吉 0. 60 1 0. 43 337 银华金利 0. 53 2 -0. 27 494 建信稳健 0. 52 3 0. 20 401 深成收益 0. 37 4 0. 45 328 中银中小盘成 0. 20 5 -0. 36 507
")
实证研究案例 Fund Name 银华鑫利 交银等认 深成进取 国投瑞银瑞福 上投优先 2012 Avg. Monthly Ret. Ranking (N=556) 19. 19 1 14. 88 2 6. 70 3 6. 68 4 5. 30 5
 Avg. Monthly Ret. Ranking")
实证研究案例 2012 2013 Avg. Ranking Fund Name Monthly Ret. (N=556) Avg. Monthly Ret. Ranking (N=638) 银华鑫利 19. 19 1 -2. 14 620 交银等认 14. 88 2 0. 06 453 深成进取 6. 70 3 -2. 69 624 国投瑞银瑞福 6. 68 4 0. 01 464 上投优先 5. 30 5 3. 04 30

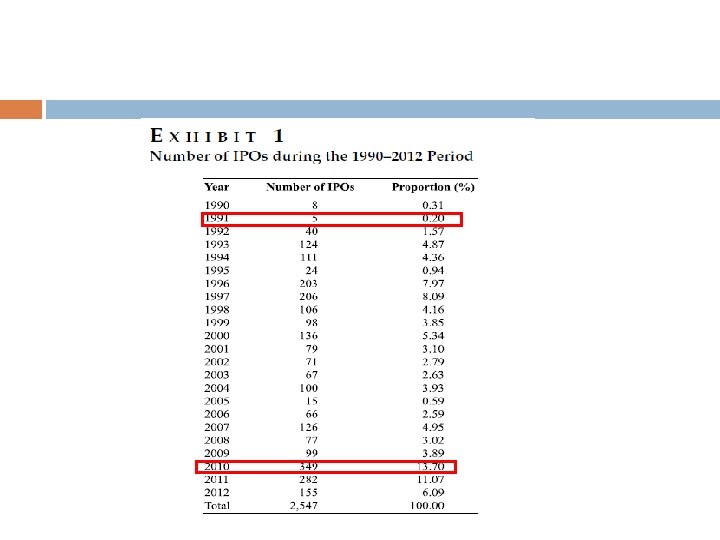
中国的新上市股长期绩效真的较差吗? DO CHINESE IPOS REALLY UNDERPERFORM IN THE LONG RUN? By Shen, Chen, and Sun (2015) Journal of Portfolio Management, 41, 54 -91.

Do Chinese IPOs Really Underperform in the Long Run? By Shen, Chen, and Sun (2015, JPM) Previous studies show that Chinese initial public offerings (IPOs) underperform relative to some benchmarks for three years after the first trading date consistent with findings in the U. S. [Chan et al. , 2004; Fan et al. , 2007; Kao et al. , 2009; Shen et al. , 2013; Shen et al. , 2014; Piotroski and Zhang, 2014]
 argue that long-run abnormal returns should be")
Event Studies Barber and Lyon (1997, JFE) argue that long-run abnormal returns should be calculated as the long-run buy-and-hold abnormal return (BHAR) of a sample firm in excess of the contemporaneous return of a benchmark, instead of biased and unintuitive cumulative abnormal returns (CAR). Three bias New-listing bias Rebalancing bias Skewness bias
![Lyon et al. [1999, JF] identify two general methods for tests of long-run](http://slidetodoc.com/presentation_image/789ba25122b63acb1b241b8364ee9fcb/image-26.jpg "Lyon et al. [1999, JF] identify two general methods for tests of long-run")
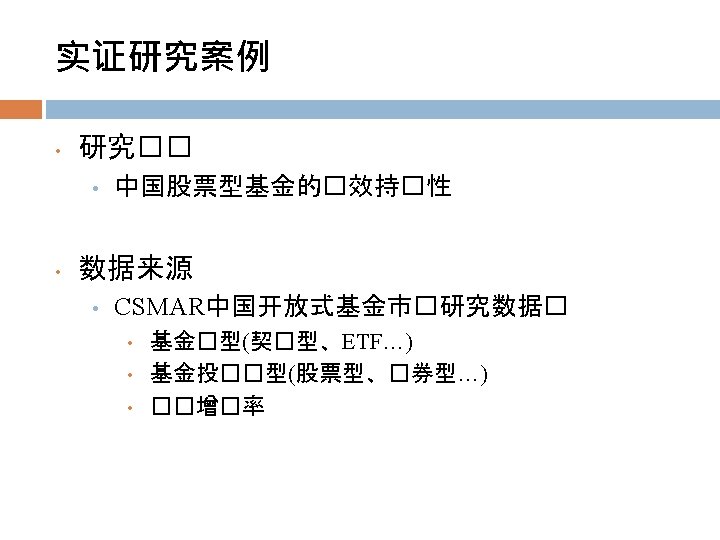
Lyon et al. [1999, JF] identify two general methods for tests of long-run abnormal returns which control for these three possible sources of bias and yield well -specified test statistics the event-time BHARs using a carefully constructed reference portfolio and the calendar-time portfolio abnormal returns.
![Following Lyandres et al. [2008, RFS], we estimate the Jensen’s alpha, our proxy](http://slidetodoc.com/presentation_image/789ba25122b63acb1b241b8364ee9fcb/image-27.jpg "Following Lyandres et al. [2008, RFS], we estimate the Jensen’s alpha, our proxy")
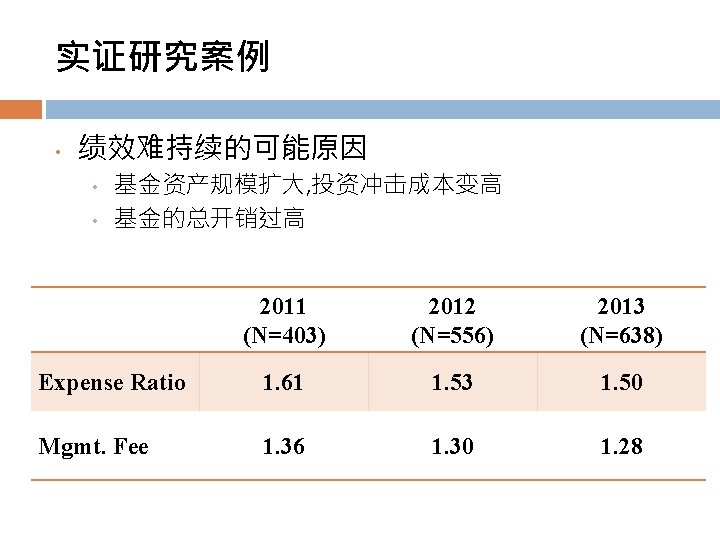
Following Lyandres et al. [2008, RFS], we estimate the Jensen’s alpha, our proxy for long-term abnormal returns, from the CAPM, the Fama-French three-factor model, and their investment-augmented models. But different from Lyandres et al. (2008, RFS), we also consider correcting for the new listing bias more explicitly.

Data IPOs data CSMAR and WIND database Sample covers all IPOs listed on the Shanghai Stock Exchange and the Shenzhen Stock Exchange Other data Monthly risk-free returns from PBOC, Monthly stock returns and accounting information from CSMAR. Sample Period from 1990 to 2012.
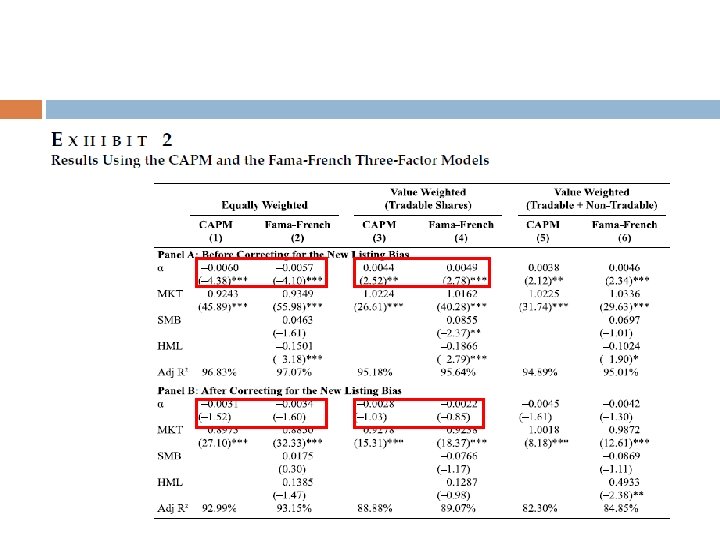

Reference portfolio To address the new listing bias, we do not follow suit using market indexes to estimate market returns, we choose to construct a modified market portfolio that excludes firms that issue new shares in the preceding 36 months.
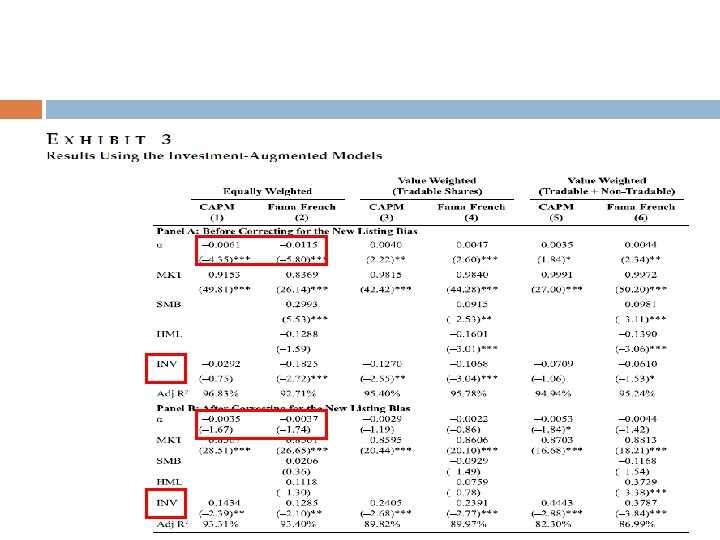

Conclusions We find that, without adjusting for the new-listing bias, long-term performance is very sensitive to weighting specifications in portfolio formation. We also find that after adjusting for the new listing bias, in almost all cases IPOs do not seem to either underperform or outperform relative to their non-IPO benchmarks.


LET’S START FROM LITERATURE REVIEW

经济領域国际期刊分级及排序 编号 1 2 3 期刊名称 American Economic Review Econometrica International Economic Review 4 5 6 7 8 Journal of Econometrics Journal of Economic Literature Journal of Economic Perspectives Journal of Economic Theory Journal of International Economics

财务領域国际期刊分级及排序 编号 1 2 3 期刊名称 Journal of Finance Journal of Financial Economics Review of Financial Studies 4 5 6 7 Journal of Financial & Quantitative Analysis Journal of Corporate Financial Management Journal of Banking & Finance

会计領域国际期刊分级及排序 编号 1 2 3 期刊名称 The Accounting Review Journal of Accounting and Economics Journal of Accounting Research 4 5 6 Contemporary Accounting Research Accounting, Organizations and Society Review of Accounting Studies
 We")
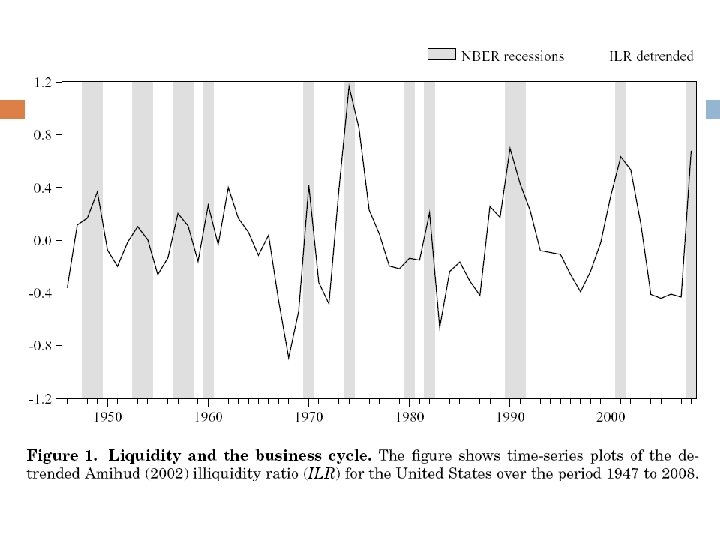
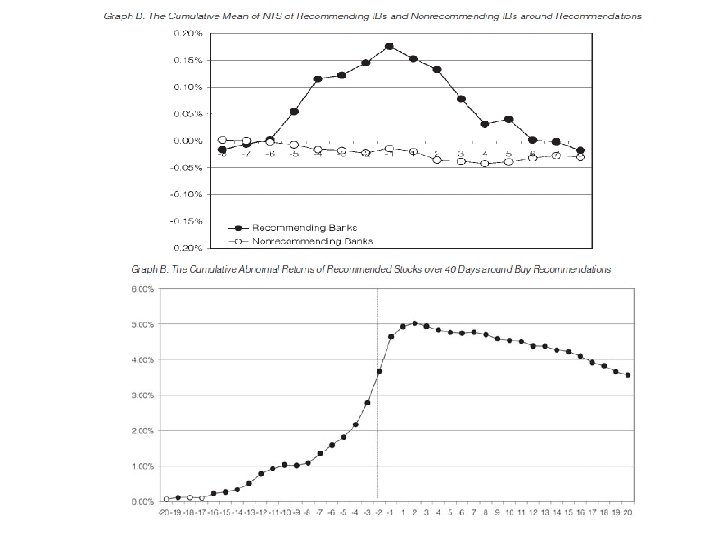
Market Liquidity and the Business Cycle by Næs, Skjeltorp and Ødegaard (2011, JF) We find a strong relation between stock market liquidity and the business cycle. We also show that investors’ portfolio compositions change with the business cycle and that investor participation is related to market liquidity. This suggests that systematic liquidity variation is related to a “flight to quality” during economic downturns. “flight to quality” or “flight to liquidity” hypothesis.

Conflicts of interest in the stock recommendations of investment banks and their determinants by Shen and Chih (2009, JFQA) Conflicts of interest exist because security analysts are dependent on investment banks, which will seek to increase their revenue through accessing sensitive analysis information prior to public release. Shen and Chih (2009) demonstrated that analysts frequently allow their investment banking to buy shares ahead of the release of recommendations, and then sell for profit after the recommendations push up the share price.

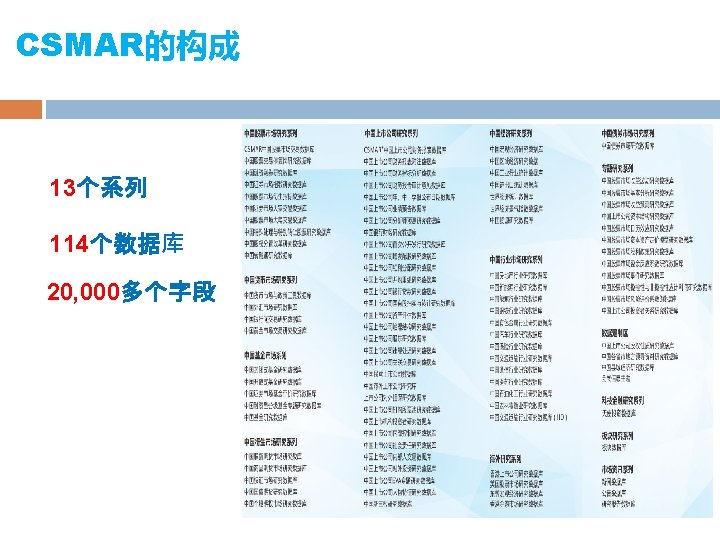
SECTION 3. CSMAR数据库简介


用CSMAR数据库发表的实证论文 截至 2016年 3月 ,中国知网检索到引用 CSMAR 25, 数据的论文多达 知网文献引用CSMAR次数 30000 733篇 25000 2563525733 22044 17722 20000 13691 15000 10299 10000 7622 5000 0 2010201120122013201420152016 年度
 Ø Ø Ø Ø Ø The Brain Gain of Corporate Boards")
用CSMAR数据库发表的国外高素质期刊 (2014 -2015部分) Ø Ø Ø Ø Ø The Brain Gain of Corporate Boards Evidence from China, Journal of Finance, (2015), 70, 16291682. Do property rights matter Evidence from a property law enactment, Journal of Financial Economics, (2015), 116, 583 -593. Political Incentives to Suppress Negative Information: Evidence from Chinese Listed Firms, Journal of Accounting Research, (2015), 53, 405 -459. The effect of audit adjustments on earnings quality: Evidence from China, Journal of Accounting and Economics, (2015), forthcoming. Media Coverage and Firm Valuation: Evidence from China, Journal of Business Ethics, (2015), 127, 501 -511. Equity Incentives and Corporate Fraud in China, Journal of Business Ethics, (2015), 1 -20. Do Chinese IPOs Really Underperform in the Long Run? Journal of Portfolio Management, (2015), 41, 54 -91. Politicians and the IPO decision: The impact of impending political promotions on IPO activity in China, Journal of Financial Economics, (2014), 111 -136. China's secondary privatization: Perspectives from the Split-Share Structure Reform, Journal of Financial Economics, (2014), 113, 500 -518.


创新数据 21世纪资本论 Capital in the Twenty-First Century r>g This tends to lead to high concentration of wealth. Financial transparency Progressive wealth tax rates

25 15 10 0 Year 1915 1918 1921 1924 1927 1930 1933 1936 1939 1942 1945 1948 1951 1954 1957 1960 1963 1966 1969 1972 1975 1978 1981 1984 1987 1990 1993 1996 1999 2002 2005 2008 2011 Percentages 创新数据 Top 1% Income Share by Year 20 United States China Taiwan Japan 5

CSMAR微信公众号每周更新研究熱點 AER, JEL, QJE, Econometrica JF, JFE, RFS, JFQA TAR, JAE, JAR, CAR, RAS 金融研究、会计研究、管理世界等

Thank you for listening!
- Slides: 59