f MRI Study Design Efficiency Alexandra Hopkins Part


 experiment is")


 Imagine an experiment…")
 and the different levels of each variable")


")


= 16 s • Detection of signal in background noise")


 Ø High-pass")


 Efficiency Convenient way of creating a")


 ❖ Leads to reproducible and ‘statistically")


- Slides: 51
f. MRI Study Design & Efficiency Alexandra Hopkins
Part I - Study Design
Study Design ❖ “The strategy in an f. MRI (and indeed any) experiment is based on an intervention in a system (brain) and observation of the modulation of the system response (BOLD effect) resulting from this ‘provocation’ (cognitive task, or in this context, paradigm)” Amaro & Barker 2006 (Brain & Cognition) ❖ ❖ i. e. have to manipulate the participants’ experience and behaviour in some way that is likely to produce a functionally specific neural response and make inference about that response Does our design allow us to test our hypothesis?
What can we manipulate? ❖ Stimulus type, e. g. visual/auditory/tactile ❖ Stimulus properties ❖ ❖ ❖ Physical properties e. g. the frequency of a tone Cognitive properties e. g. whether a stimulus is associated with reward or not Stimulus timing, e. g. inter-stimulus interval
STUDY DESIGN Image time-series Kernel Design matrix Realignment Smoothing General linear model Statistical parametric map (SPM) Statistical inference Normalisation Gaussian field theory p <0. 05 Template Parameter estimates
Contrasts
Comparison Strategies ❖ Subtraction ❖ Factorial ❖ Parametric
Subtraction ❖ ❖ Compares neural signal from task that activates process of interest and a second task that controls for all but the process of interest Any BOLD signal difference between images (above set statistical limits) is assumed to represent all brain regions involved in that task
However…. CHALLENGE Very hard to find a good control task ❖ ◦ ‘pure insertion’ – assumes that adding more cognitive components does not affect other processes in the task – asserts no interactions ◦ This assumption is false most of the time (if not always!) – better at low level processes
Problem with Subtraction Example (taken from Friston et al. , 1996) Imagine an experiment… -> Visual stimuli that are in motion Selectively attend to motion or not [Selective attention – no selective attention] Found V 5 activation! -> Conclude V 5 is activated when asked to attend to motion Actually represents interaction! V 5 activation in response to motion; enhanced by selectively attending to motion.
Factorial Two or more variables (or factors) and the different levels of each variable are matched Test for interactions explicitly ‘…perform a task where the cognitive components are intermingled in one moment, and separated in another’ (Amaro & Barker, 2006) 2 factors x 2 levels = 4 conditions
Factorial approach ->With subtraction – erroneously concluded that V 5 is activated when being asked to attend to motion Extra conditions --> task X stimuli interaction v 5 activate to motion and enhanced activation to motion with selective attention No v 5 activation to no motion with selective attention Visual Now we can see that being asked to Stimuli Motion selectively attend to motion only activates V 5 area if visual motion is No Visual actually present Motion Task Attend to motion Do not attend to motion Interaction Main effect motion Main effect Neither attention
Parametric Vary parameter of interest along continuum and relate to BOLD signal Can incrementally increase difficulty of task Any changes in BOLD between trials would imply a heavy association between active regions and parameter being manipulated e. g. Working memory task (Seidman et al. , 1998) ◦ Baseline: respond to all letters ◦ Task 1: respond if A preceded by Q (e. g. QA) ◦ Task 2: respond if A preceded by Q, separated by three letters (e. g. Qrct. A) However, other circuits may be recruited at higher cognitive demand, still assumes that parameter of interest is only thing changing
Summary Amaro & Barker (2006)
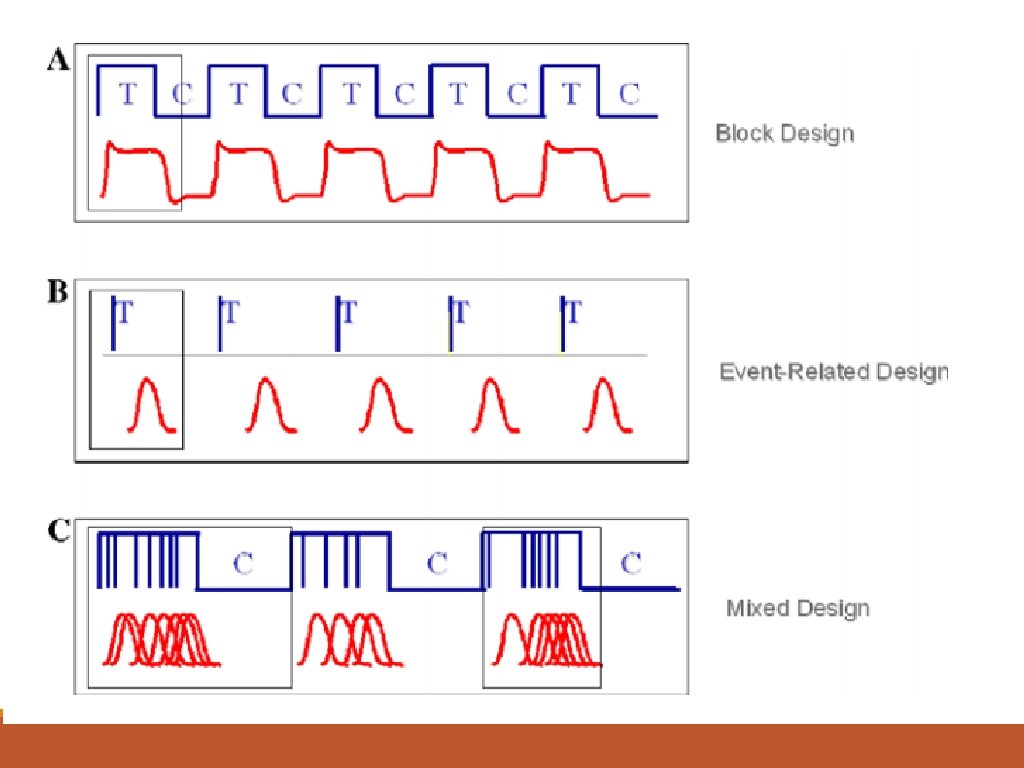
Stimulus presentation strategies ❖ Blocked ❖ Event Related ❖ Mixed
Block design Alternating between task conditions e. g. [ Task A rest Task B rest ] ◦ Typically 20 -60 seconds, optimally around 20 seconds ◦ Ignore details of HRF and set up steady state of neuronal change Based on Huettel (Chapter 9)
❖ ❖ PROS: Simple and easy to analyse ❖ ❖ Strong detection/statistical power Don’t need to have accurate estimation of HRF ❖ ❖ CONS: Not all hypotheses can be probed in this manner, e. g. the ‘oddball’ paradigm Habituation/expectanc y effects Might be cumulative effects on mood
Event Related Design ❖ ❖ ❖ Evoke process of interest transiently by brief presentation of individual stimuli Trials presented in a randomised order, rather then being blocked together by condition Takes into account HRF shape and timing
❖ ❖ PROS: Can randomize trials Avoids expectation and habituation Allows post-hoc classification - to differentiate trials not defined at the time of scanning e. g. encoding strength to memory performance Some tasks cant be blocked e. g. oddball ❖ ❖ ❖ CONS: More complex design and analysis (especially timing issues) Reduced statistical power ❖ Smaller evoked changes in BOLD signal Larger switching cost between conditions?
Mixed designs Combination of blocked and event-related designs Stimulus present in regular blocks; >1 types of events per block Analysis of IVs on different time scale ◦ Block -> state-related processes (e. g. attention) ◦ Event -> item-related processes (e. g. button press) Example of a mixed design: Within task block, subject pressed button in response to infrequent target circles, ignoring non-target square. Difficult analysis! – very sensitive to errors in HRF modeling
Part II: Efficiency and optimisation of f. MRI designs
General advice For group-level inference larger sample sizes are better ◦ Power depends more heavily on number of subjects than number of scans per subject Run each scan as long as possible (40 -60 min) – increase power due to higher number of scans Keep subject as busy as possible Fewer conditions/contrasts are better – easier and more power
Technical considerations A good f. MRI experiment needs 2 things: 1. Induce subject to do or experience the psychological state that you want to study (psychological) 2. Effectively detect brain signals related to those psychological states (statistical) ØYou can have a great psychological experiment with huge neuronal response, but be completely unable to identify this in f. MRI-signal
Reminder GLM General Linear Model: Y = X. β + Data Design Matrix Parameters error ε Efficiency(e) is the ability to estimate β, given the design matrix (X) for a particular contrast (c) and the given noise variance (σ2) e (c, X) = inverse (σ2 c. T Inverse(XTX) c) 1. 2. The efficiency for each contrast is different We can calculate the efficiency just based on the contrast and design matrix before we have seen any data! 3. We can directly influence our efficiency by manipulating the timing and sequence of stimuli
Stimulus timing SIMPLEST CASE: ONE CONDITION AGAINST BASELINE
BOLD response The relation between a burst of neuronal activity and the BOLD signal is captured by Haemodynamic Response Function (HRF) HRF Peak 2 difficulties for design timing: Undershoot • BOLD response is very sluggish • Low frequency drifts in f. MRI signal, need to be filtered out by high-pass filter Rik Henson’s SPM guide: http: //imaging. mrc-cbu. cam. ac. uk/imaging/Design. Efficiency Alessandro G. Allievi et al. Cereb. Cortex 2015
Fixed stimulus onset asychrony (SOA)= 16 s • Detection of signal in background noise works best if variability of neural signal is maximised • Signal that varies little will be difficult to detect not particularly efficient design Rik Henson’s SPM guide: http: //imaging. mrc-cbu. cam. ac. uk/imaging/Design. Efficiency
Fixed SOA = 4 s Rik Henson’s SPM guide: http: //imaging. mrc-cbu. cam. ac. uk/imaging/Design. Efficiency • Because the responses to events now overlap considerably, we see an initial build up followed by small oscillations around a ‘raised baseline’. • Overall signal is high, but variance is low less efficient design
Stochastic and blocked event presentation ->very efficient Random SOA minimum 4 s e. g. event-related: larger variability in signal HRF Blocked, SOA 4 s: larger variability in signal HRF
Fourier transform • HRF acts as low pass filter and removes high frequencies • FT converts time function into sum of sine waves of different frequencies – represent signal in frequency space Rik Henson’s SPM guide: http: //imaging. mrc-cbu. cam. ac. uk/imaging/Design. Efficiency • FT helps to see which components will pass the HRF filter
Most efficient design Want majority of signal to be let through by HRF The most efficient design has a stimulus frequency that matches the maximum frequency amplitude of the HRF Modulate neural activity in sinusoidal fashion e. g. sinusoidally vary luminance of visual stimuli Rik Henson’s SPM guide: http: //imaging. mrc-cbu. cam. ac. uk/imaging/Design. Efficiency Peak of the amplitude spectrum of the HRF filter (0. 03 Hz)/30 seconds
Revisiting stochastic design, SOA = min 4 • Randomise onset • Signal is spread across a range of frequencies • Some signal is lost due to filtering, but a lot of it is passed • Best practice for event related designs Rik Henson’s SPM guide: http: //imaging. mrc-cbu. cam. ac. uk/imaging/Design. Efficiency
High-pass filtering Low frequency noise in f. MRI (e. g. scanner drifts) Ø High-pass filter cut-off in SPM 0. 01 Hz High-pass filter • Don’t design blocks of too much length (not longer than 50 sec), because high pass filtering would remove most of the signal • Don’t contrast conditions too separate in time
2 or more conditions THINGS GET MORE COMPLICATED….
Different efficiency for different contrasts Randomised design 2 events: Common effect e. g. faces vs baseline Differential effect e. g. sad vs happy faces • Optimal SOA for main effect (A+B): long SOA • Optimal SOA for differential effect (A-B): short SOA • Trade off! Rik Henson’s SPM guide: http: //imaging. mrc-cbu. cam. ac. uk/imaging/Design. Efficiency
Timing: Null events not different from baseline (A-B) Efficiency Convenient way of creating a stochastic design by randomising the SOA between the components of interest (A+B) Efficient for main AND differential effects at short SOAs – reduces trade off between contrasts SOA (s) Rik Henson’s SPM guide: http: //imaging. mrc-cbu. cam. ac. uk/imaging/Design. Efficiency
Correlation between regressors Fixed SOA Jittered SOA Fixed with half of trials • High correlation between regressors can reduce efficiency to separate brain activity • If 2 events (e. g. stimulus and response in working memory paradigm) are highly correlated, you can’t determine which of both caused the BOLD signal
Conclusions Optimal design for one contrast might not be optimal for another Block design (short block length ~20 sec) are most efficient Block designs are often psychological not possible: stochastic designs with jittered SOA or null-events are also very efficient Don’t have too long blocks/ contrast too separate in time, since it will be filtered out by high-pass filter Estimate efficiency before experiment!
References • Rik Henson’s SPM guide: http: //imaging. mrc-cbu. cam. ac. uk/imaging/Design. Efficiency • Amaro Jr. , E. , & Barker, G. J. (2006). Study design in f. MRI: Basic principles. Brain and Cognition, 60, 220 -232. doi: 10. 1016/j. bandc. 2005. 11. 009 • Calamante F. et al. (1999) Measuring cerebral blood flow using magnetic resonance techniques. J Cereb Blood Flow Metab 19, 701 -35. • Dougherty D. , Rauch S. , Rosenbaum JF. (2004). Essentials of Neuroimaging for Clinical Practice • Huettel S. , Song A. , Mc. Carthy G. (2009). Functional Magnetic Resonance Imaging Mc. Robbie D. et al. (2008). MRI From Picture to Proton • Previous Mf. D slides Thanks to our expert Tobias Hauser 19
MISC SLIDES
❖ Modelling the BOLD response is simple (comparatively) ❖ Leads to reproducible and ‘statistically confident’ data
Don’t forget BOLD is a signal based in physiology…
Maturational changes in the temporal characteristics and amplitude of the identified functional brain activity (a). Alessandro G. Allievi et al. Cereb. Cortex 2015; cercor. bhv 203 © The Author 2015. Published by Oxford University Press.
❖ e. g: being presented with different nouns and deciding whether each is animate or inanimate Categorical goa t bucke t Stimulus
Subtraction approach ‘Is the inferotemporal region sensitive to both object recognition and phonological retrieval of object names? (Friston et al. , 1997) [1] Say ‘yes’ when you Results: see an abstract image (visual analysis, speech) [2] Say ‘yes’ when you see an object (visual analysis, speech, object recognition) [3] Name the object (visual analysis, speech, [1] [2] [3] object recognition, phonological retrieval) Subtraction: [2] – [1] = object recognition [3] – [2] = phonological retrieval Assumes object recognition activates IT to the same degree independent of phonological retrieval
Slides from 2016 SPM course Factorial approach Vary object recognition & phonological retrieval independently ◦ Add condition: [4] Name the colour of the presented shape speech, phonological retrieval) (visual analysis, ‘Say yes’ (Object vs Non-objects) interaction effect (Stimuli x Task) Phonological retrieval (Object vs Non-objects) In the absence of object recognition, phonological retrieval deactivates IT
Main considerations before starting… ❖ METHOD OF ANALYSIS AND CONTRAST ❖ The simpler the better ❖ Test hypotheses generated from animal research and prior human work ❖ Within-subject or between subjects (e. g. matched healthy controls) ❖ Need a resting baseline to compare tasks to
Multimodal integration Can potentially integrate results with MEG or EEG – tools with greater temporal resolution
An example • Simple Main effect: A-B simple main effect of motion V no motion under context of low cognitive load • Main Effect: (A+B) - (C+D) Main effect of low cognitive load vs. high cognitive load, irrelevant of motion • Interaction effect: (A-B) - (C - D) Investigates whether the interaction effect of motion (vs. no motion) is greater under high or low cognitive loads Motion (Low) No motion (Low) A B Motion (High) No Motion (High) C D
General advice From Rik Henson: • Scan for as long as possible and keep subject as busy as possible • If group study, number of subjects more important than time per subject (though additional set-up time may encourage multiple experiments per subject) • Do not contrast trials that are far apart in time • Randomise the order, or SOA, of trials close together in time 18