
EEG MEG Experimental Design Preprocessing Alexandra Hopkins Jennifer



- Slides: 51
EEG / MEG: Experimental Design & Preprocessing Alexandra Hopkins Jennifer Jung
Outline Experimental Design Preprocessing in SPM 12 • f. MRI M/EEG • Analysis • • – Oscillatory activity – EP • • Design Inferences Limitations Combined Measures Data Conversion Montage Mapping Epoching Downsampling Filtering Artefact Removal Referencing
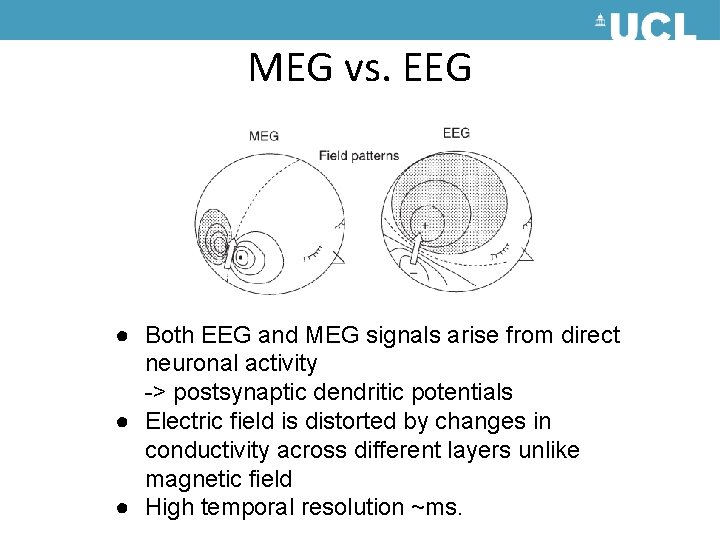
MEG vs. EEG ● Both EEG and MEG signals arise from direct neuronal activity -> postsynaptic dendritic potentials ● Electric field is distorted by changes in conductivity across different layers unlike magnetic field ● High temporal resolution ~ms.
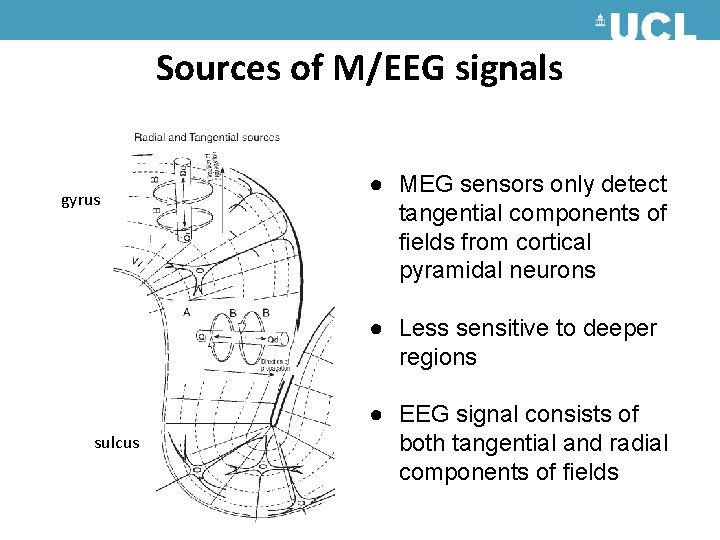
Sources of M/EEG signals gyrus ● MEG sensors only detect tangential components of fields from cortical pyramidal neurons ● Less sensitive to deeper regions sulcus ● EEG signal consists of both tangential and radial components of fields
Two types of MEG/EEG analysis Event related changes (EP / ERP – ERF) Time locked to stimulus Oscillatory activity – cortical rhythms (Time-frequency analysis) Otten, L. (2012, November 21). EEG/MEG Acquisition, Analysis and Interpretation, MSc Cognitive Neuroscience, UCL
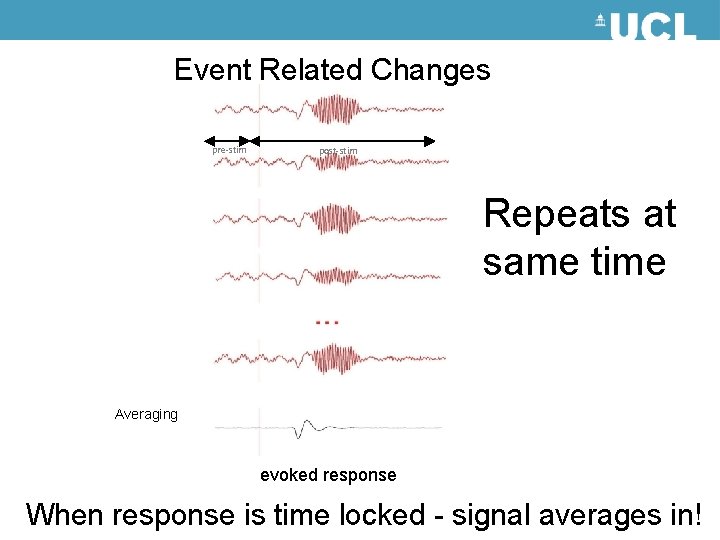
Event Related Changes pre-stim post-stim Repeats at same time Averaging evoked response When response is time locked - signal averages in!
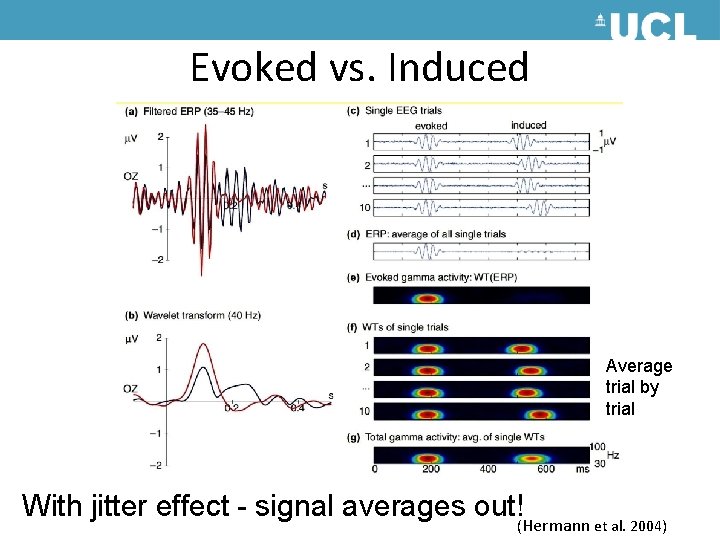
Evoked vs. Induced Average trial by trial With jitter effect - signal averages out!(Hermann et al. 2004)
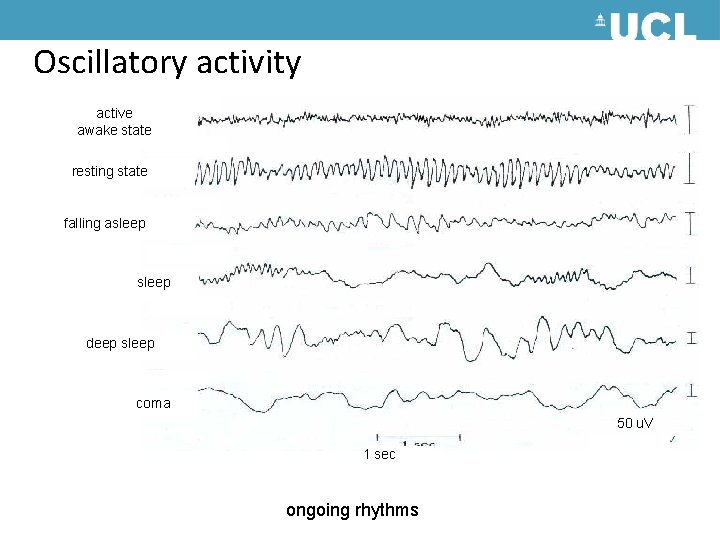
Oscillatory activity active awake state resting state falling asleep deep sleep coma 50 u. V 1 sec ongoing rhythms
Oscillations • Non-averaged data collected during continuous stimulation or task performance (or during rest) lends itself to analysis of spectral power. • Signals can be decomposed into a sum of pure frequency components which gives information on the signal power at each frequency. • i. e. We can do Fourier analysis and look at spectra (not-event related – break data in arbitrary segments and do some averaging
(8 – 12 or 13 Hz) Cortical and behavioral deactivation or inhibition Closed eyes (12 – 30 Hz) Alert, REM sleep Attention, and higher cognitive function (30 – 80 Hz) Visual awareness Binding of information Encoding, retention and (0 – 4 Hz) Attentional and syntactic language processes Deep sleep (4 – 8 Hz) Codes locations in space, navigation Declarative/episodic memory
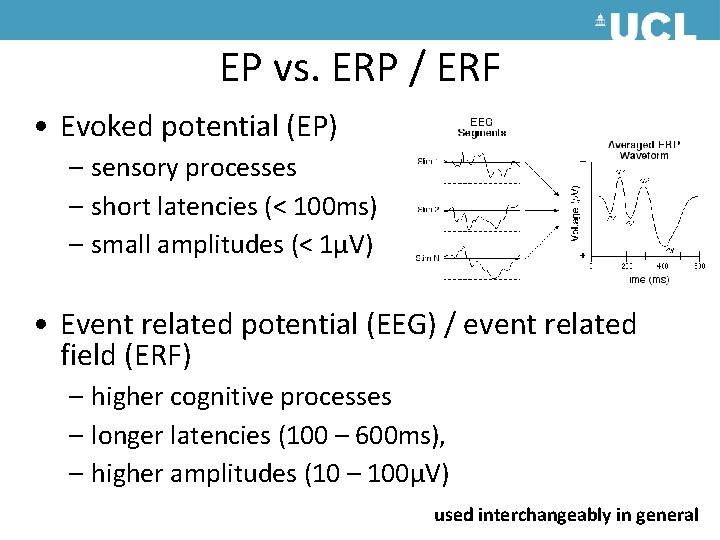
EP vs. ERP / ERF • Evoked potential (EP) – sensory processes – short latencies (< 100 ms) – small amplitudes (< 1μV) • Event related potential (EEG) / event related field (ERF) – higher cognitive processes – longer latencies (100 – 600 ms), – higher amplitudes (10 – 100μV) used interchangeably in general
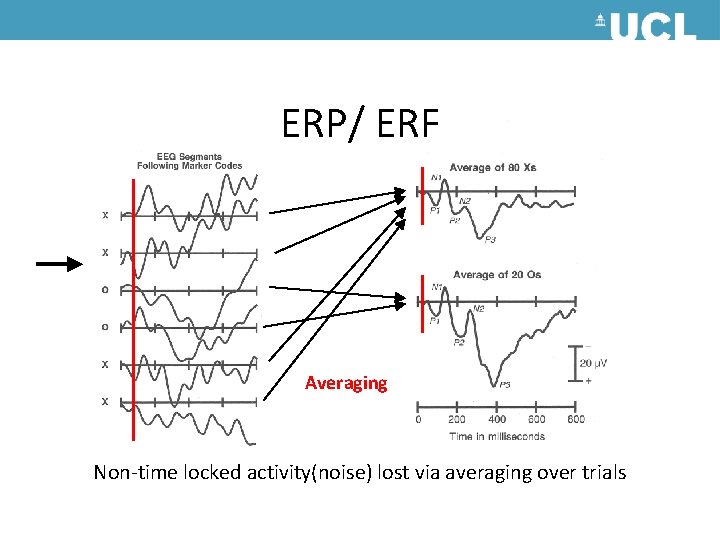
ERP/ ERF Averaging Non-time locked activity(noise) lost via averaging over trials
Experimental design • Number of trials – EP: 120 trials, 15 -20% will be excluded – Oscillatory activity: 40 -50 trials • Duration of stimuli / task – Short: Averaged EP is fine – (Very) long: spectrotemporal analysis on averaged EP or non-averaged data • Collecting Behavioral Responses
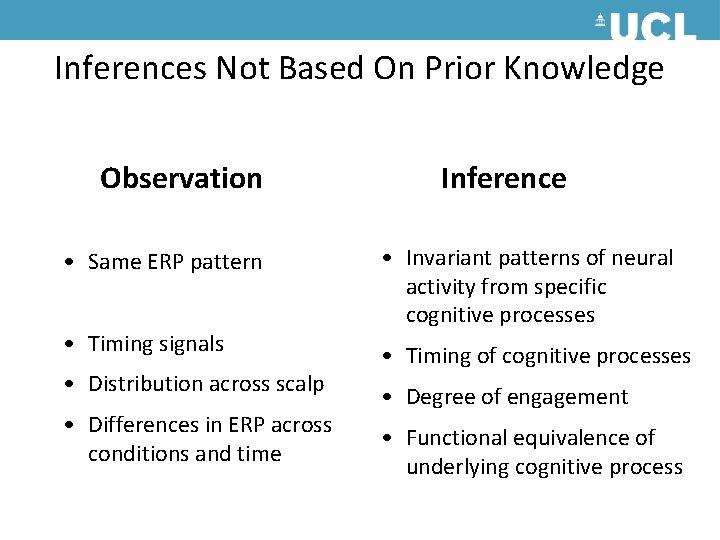
Inferences Not Based On Prior Knowledge Observation • Same ERP pattern • Timing signals • Distribution across scalp • Differences in ERP across conditions and time Inference • Invariant patterns of neural activity from specific cognitive processes • Timing of cognitive processes • Degree of engagement • Functional equivalence of underlying cognitive process
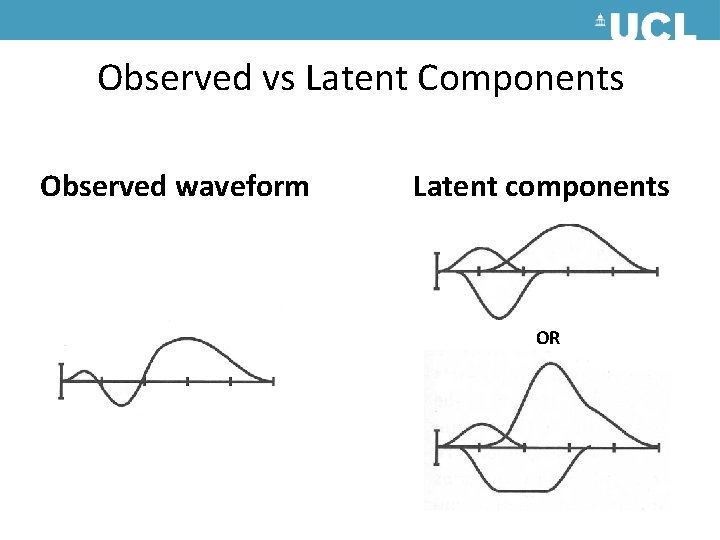
Observed vs Latent Components Observed waveform Latent components OR
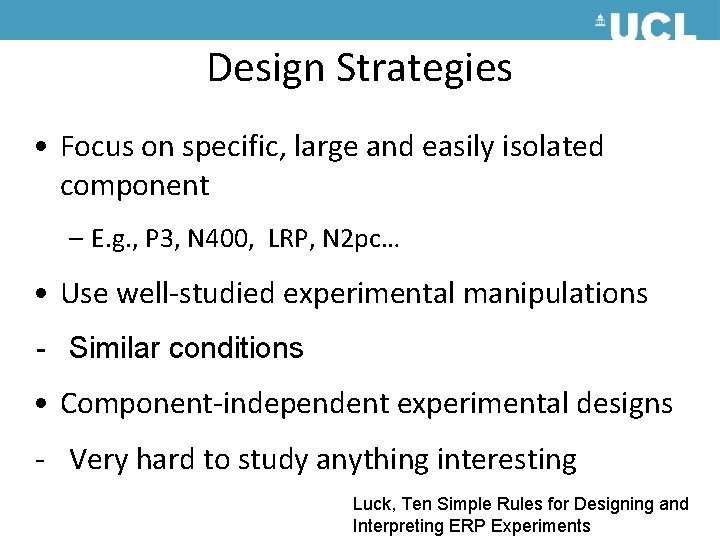
Design Strategies • Focus on specific, large and easily isolated component – E. g. , P 3, N 400, LRP, N 2 pc… • Use well-studied experimental manipulations - Similar conditions • Component-independent experimental designs - Very hard to study anything interesting Luck, Ten Simple Rules for Designing and Interpreting ERP Experiments
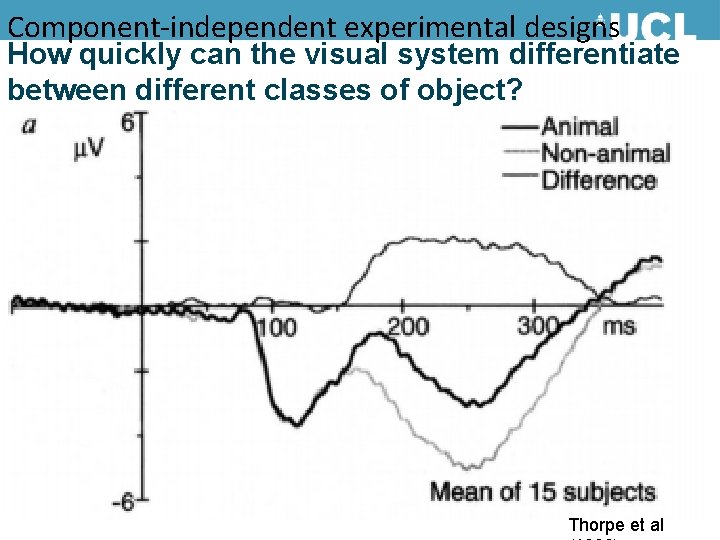
Component-independent experimental designs How quickly can the visual system differentiate between different classes of object? Thorpe et al
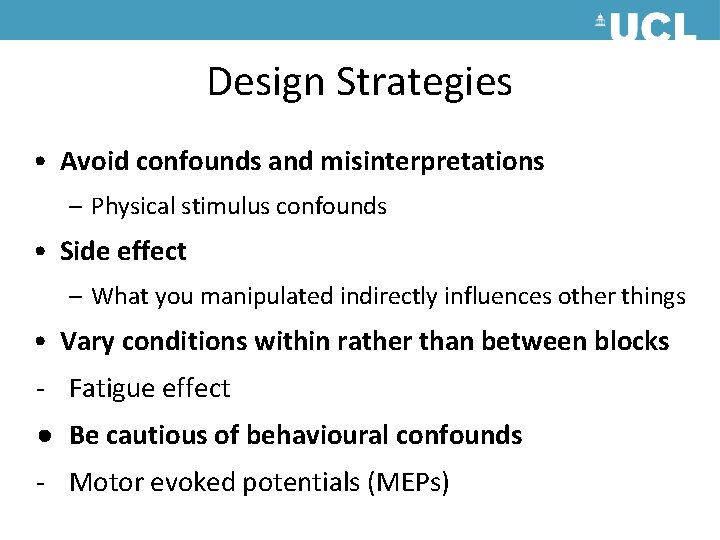
Design Strategies • Avoid confounds and misinterpretations – Physical stimulus confounds • Side effect – What you manipulated indirectly influences other things • Vary conditions within rather than between blocks - Fatigue effect ● Be cautious of behavioural confounds - Motor evoked potentials (MEPs)
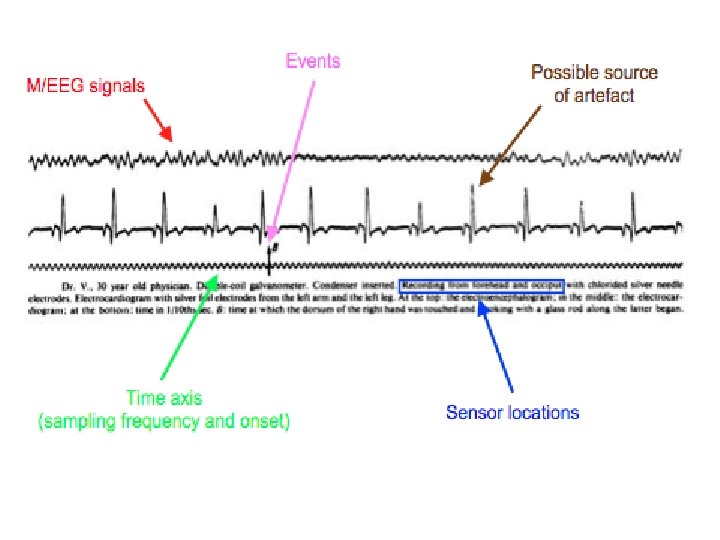
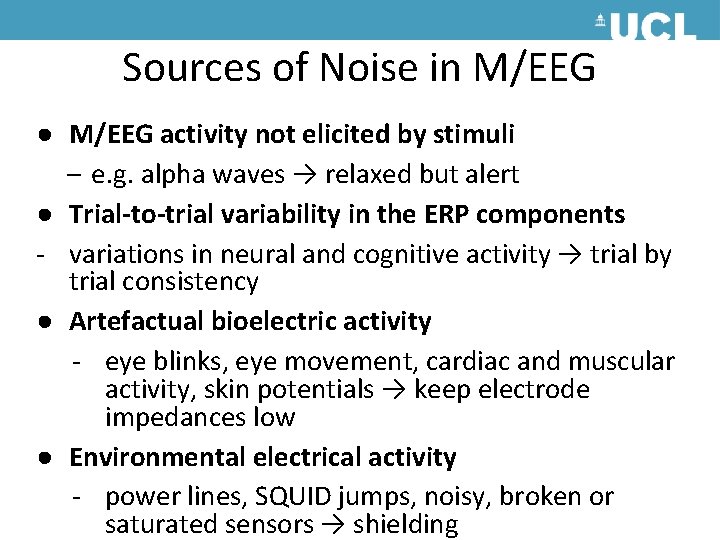
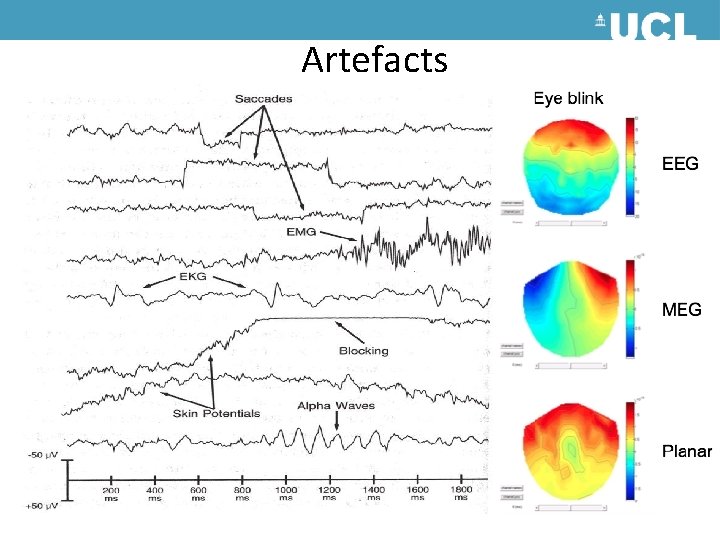
Sources of Noise in M/EEG ● M/EEG activity not elicited by stimuli – e. g. alpha waves → relaxed but alert ● Trial-to-trial variability in the ERP components - variations in neural and cognitive activity → trial by trial consistency ● Artefactual bioelectric activity - eye blinks, eye movement, cardiac and muscular activity, skin potentials → keep electrode impedances low ● Environmental electrical activity - power lines, SQUID jumps, noisy, broken or saturated sensors → shielding
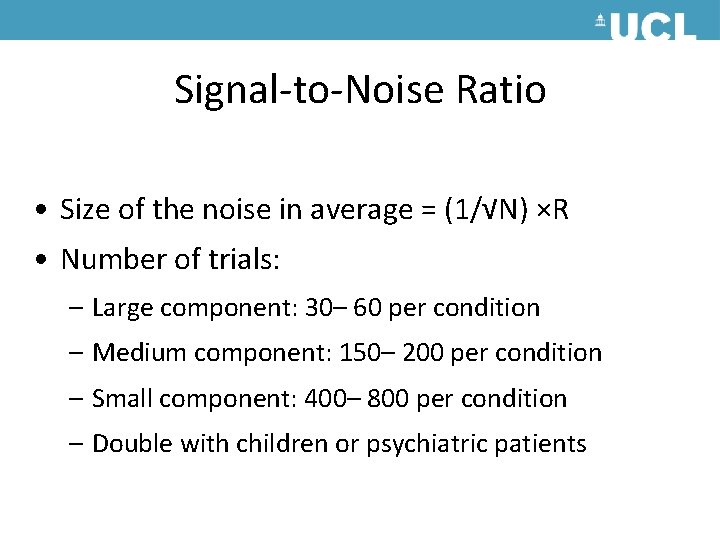
Signal-to-Noise Ratio • Size of the noise in average = (1/√N) ×R • Number of trials: – Large component: 30– 60 per condition – Medium component: 150– 200 per condition – Small component: 400– 800 per condition – Double with children or psychiatric patients
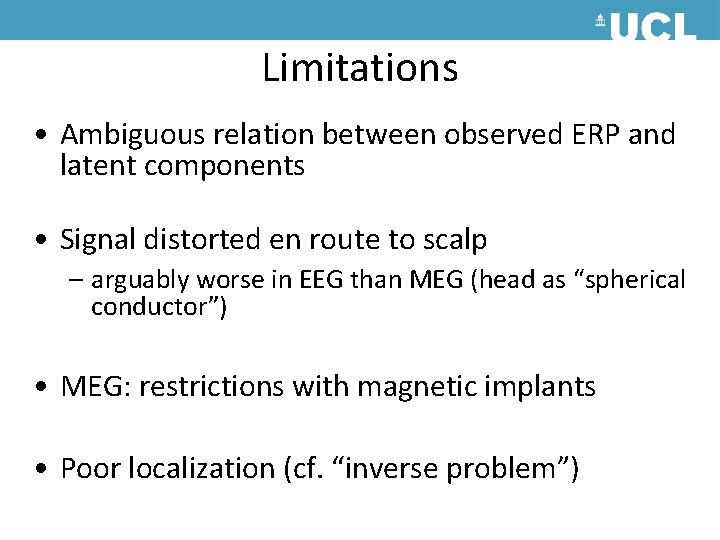
Limitations • Ambiguous relation between observed ERP and latent components • Signal distorted en route to scalp – arguably worse in EEG than MEG (head as “spherical conductor”) • MEG: restrictions with magnetic implants • Poor localization (cf. “inverse problem”)
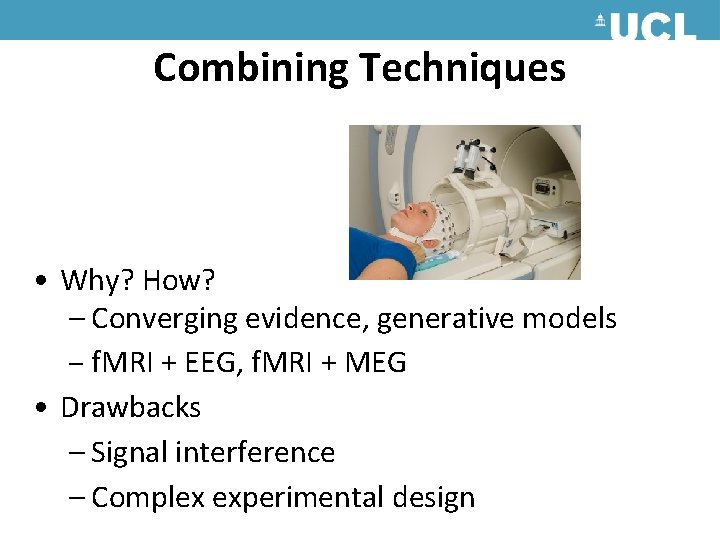
Combining Techniques • Why? How? – Converging evidence, generative models – f. MRI + EEG, f. MRI + MEG • Drawbacks – Signal interference – Complex experimental design
Outline Experimental Design Preprocessing in SPM 12 • f. MRI M/EEG • • Analysis – Oscillatory activity – EP • • Design Inferences Limitations Combined Measures Data Conversion Montage Mapping Epoching Downsampling Filtering Artefact Removal Referencing
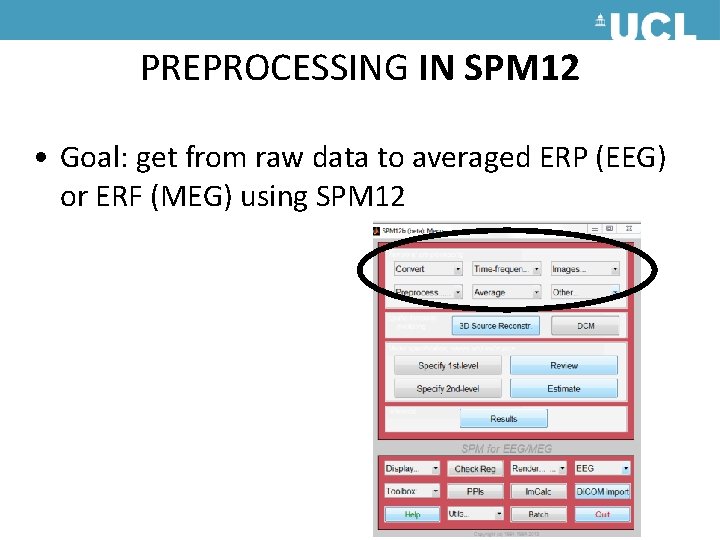
PREPROCESSING IN SPM 12 • Goal: get from raw data to averaged ERP (EEG) or ERF (MEG) using SPM 12
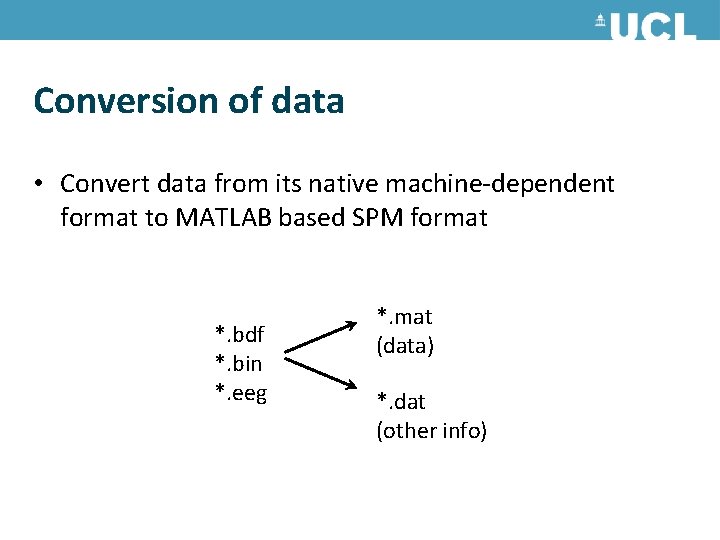
Conversion of data • Convert data from its native machine-dependent format to MATLAB based SPM format *. bdf *. bin *. eeg *. mat (data) *. dat (other info)
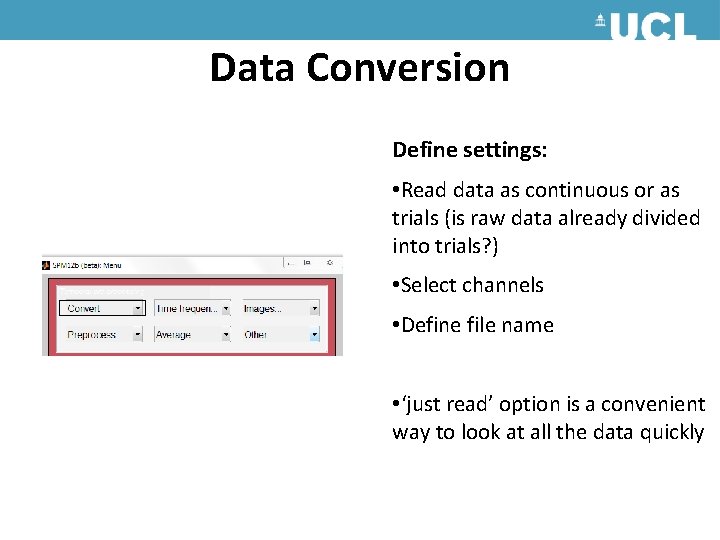
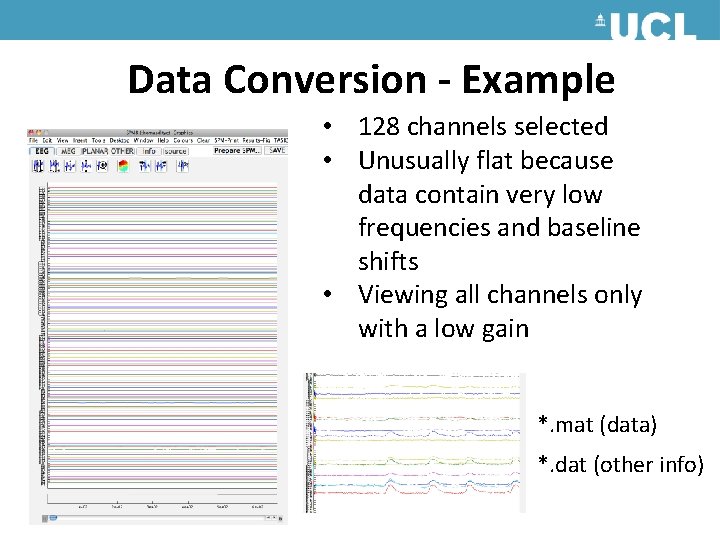
Data Conversion Define settings: • Read data as continuous or as trials (is raw data already divided into trials? ) • Select channels • Define file name • ‘just read’ option is a convenient way to look at all the data quickly
Data Conversion - Example • 128 channels selected • Unusually flat because data contain very low frequencies and baseline shifts • Viewing all channels only with a low gain *. mat (data) *. dat (other info)
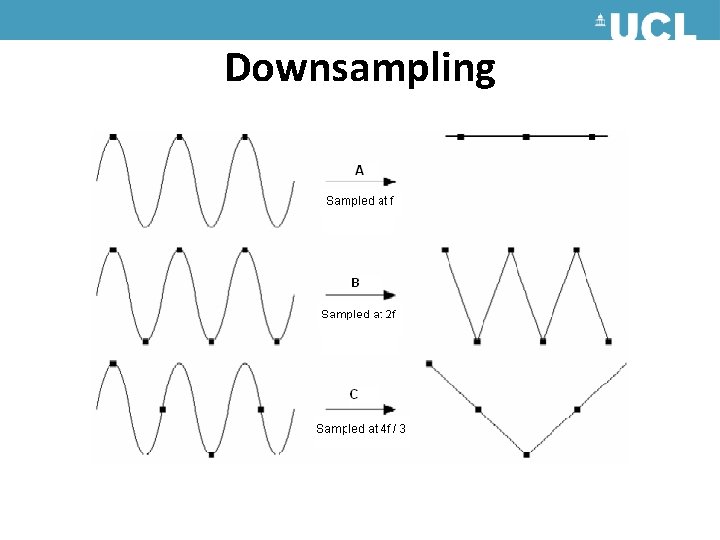
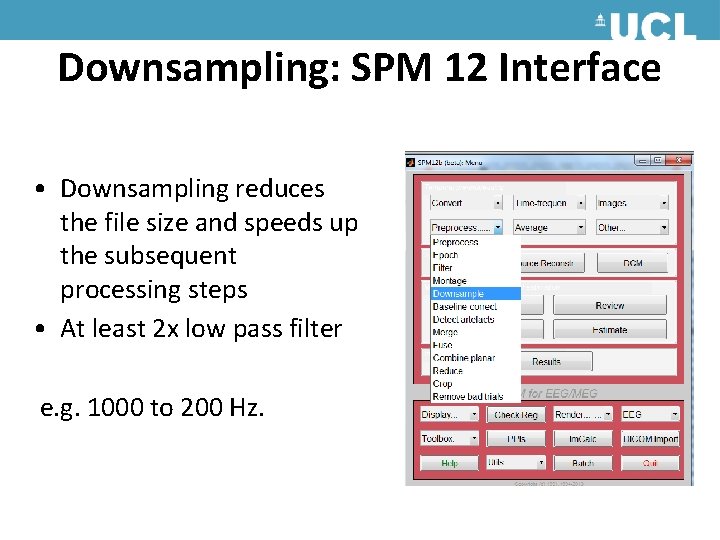
Downsampling • Sampling frequency is very high at acquisition (e. g. 2048 Hz) • Downsampling is required for efficient data storage • Sampling rate > 2 x highest frequency in the signal of interest = The Nyquist frequency
Downsampling
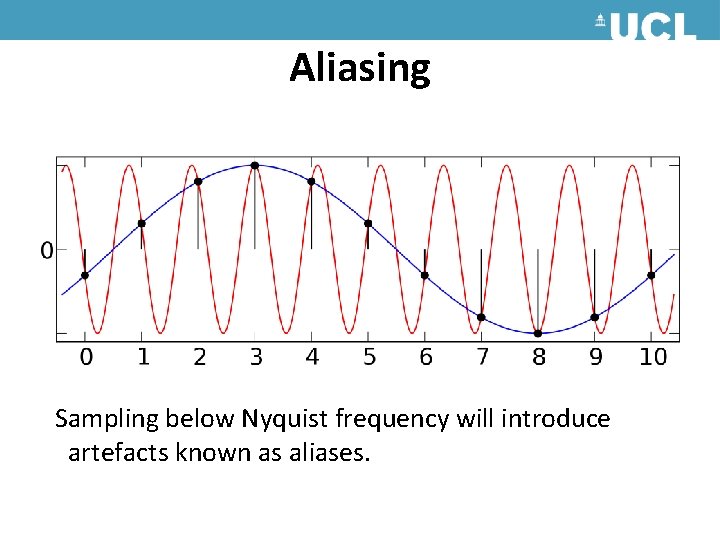
Aliasing Sampling below Nyquist frequency will introduce artefacts known as aliases.
Downsampling: SPM 12 Interface • Downsampling reduces the file size and speeds up the subsequent processing steps • At least 2 x low pass filter e. g. 1000 to 200 Hz.
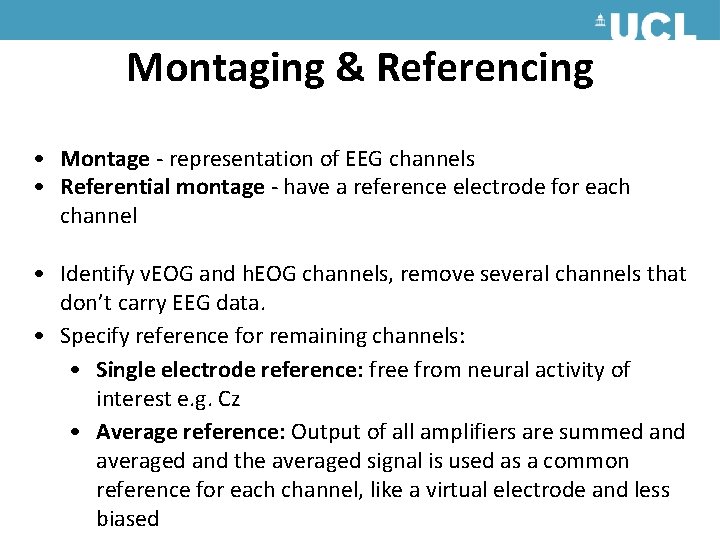
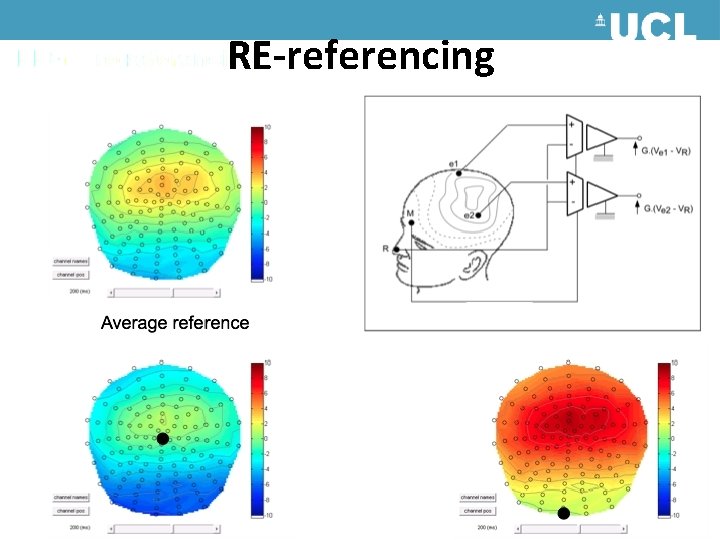
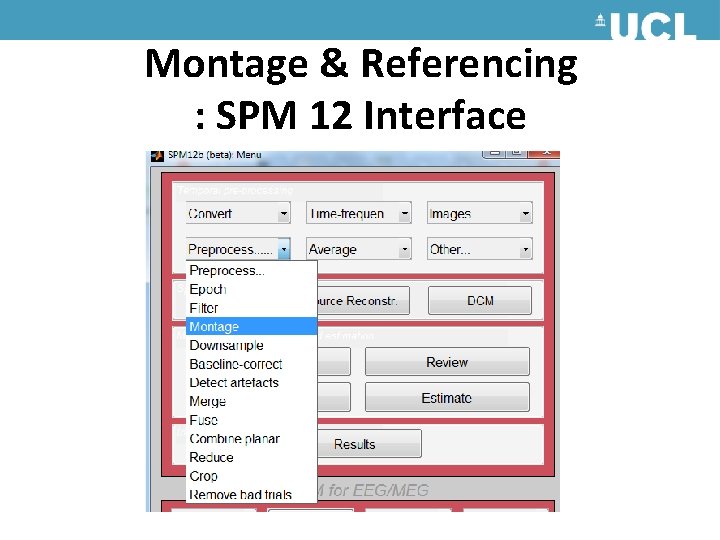
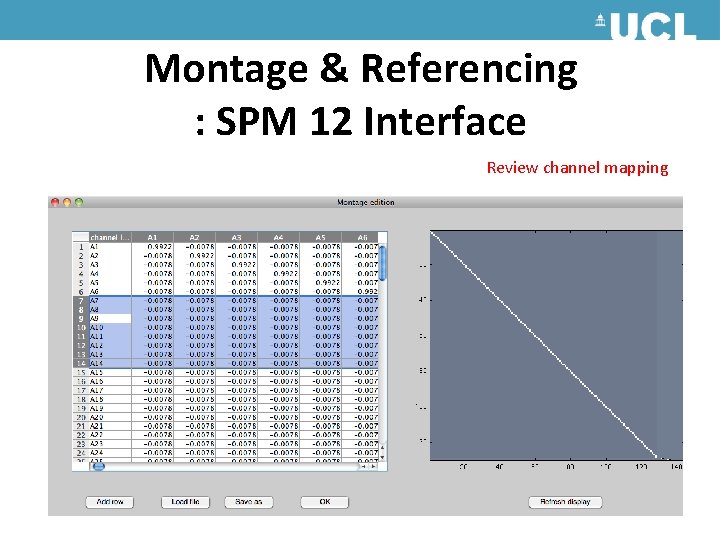
Montaging & Referencing • Montage - representation of EEG channels • Referential montage - have a reference electrode for each channel • Identify v. EOG and h. EOG channels, remove several channels that don’t carry EEG data. • Specify reference for remaining channels: • Single electrode reference: free from neural activity of interest e. g. Cz • Average reference: Output of all amplifiers are summed and averaged and the averaged signal is used as a common reference for each channel, like a virtual electrode and less biased
RE-referencing
Montage & Referencing : SPM 12 Interface
Montage & Referencing : SPM 12 Interface Review channel mapping
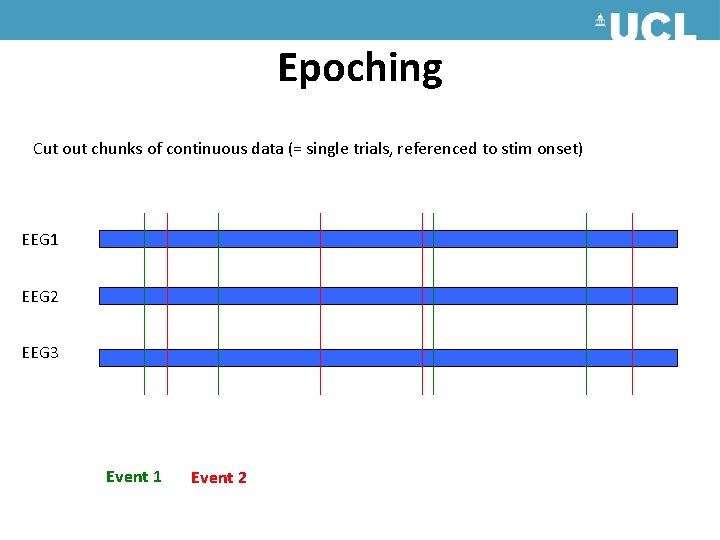
Epoching Cut out chunks of continuous data (= single trials, referenced to stim onset) EEG 1 EEG 2 EEG 3 Event 1 Event 2
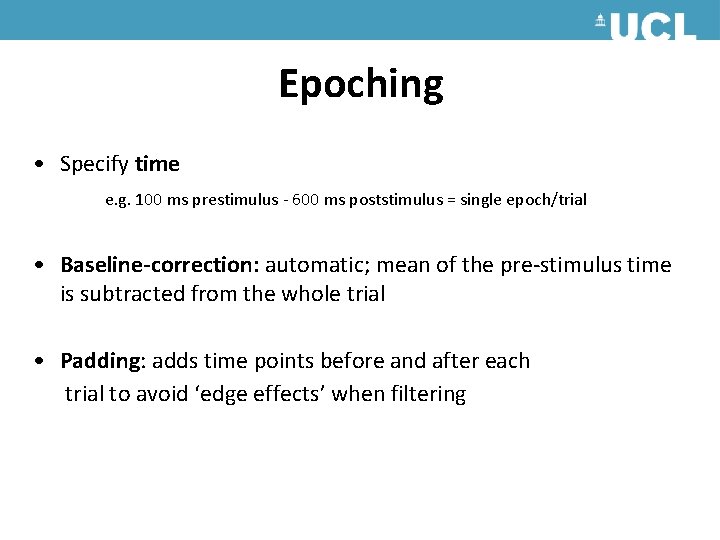
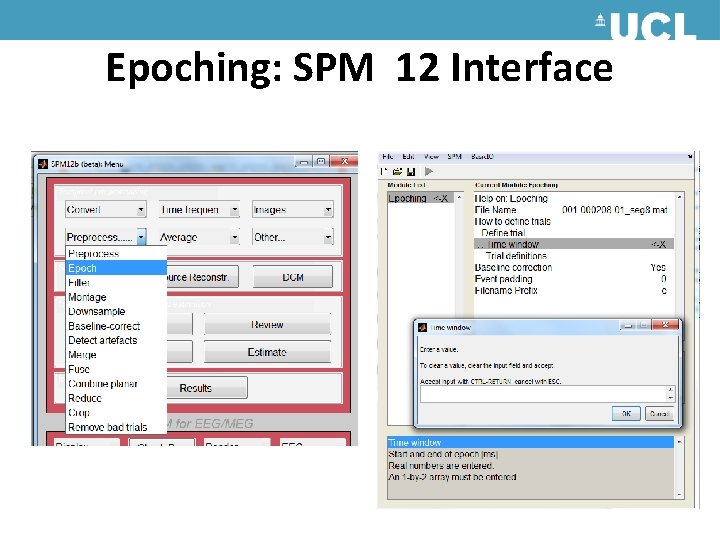
Epoching • Specify time e. g. 100 ms prestimulus - 600 ms poststimulus = single epoch/trial • Baseline-correction: automatic; mean of the pre-stimulus time is subtracted from the whole trial • Padding: adds time points before and after each trial to avoid ‘edge effects’ when filtering
Epoching: SPM 12 Interface
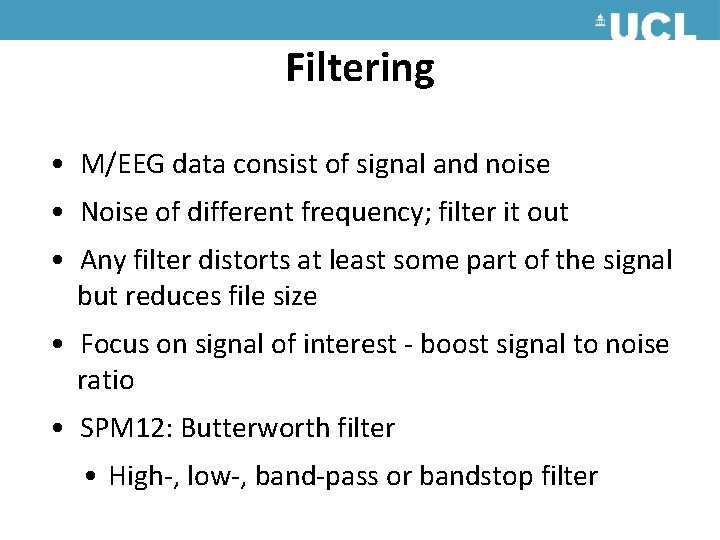
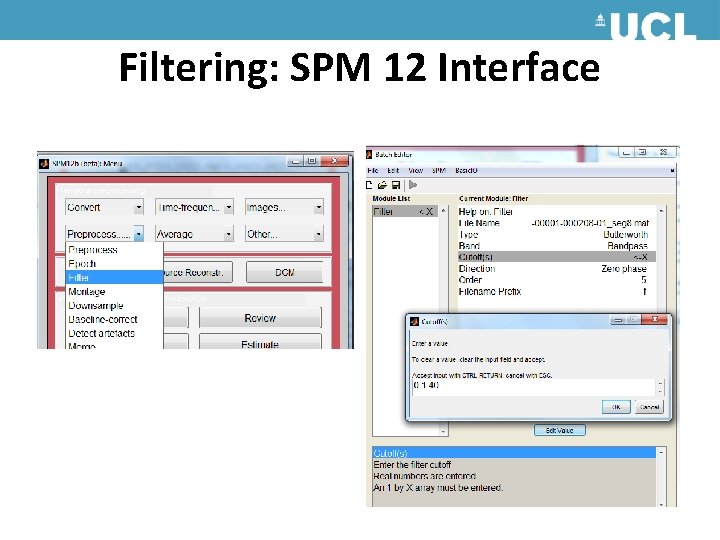
Filtering • M/EEG data consist of signal and noise • Noise of different frequency; filter it out • Any filter distorts at least some part of the signal but reduces file size • Focus on signal of interest - boost signal to noise ratio • SPM 12: Butterworth filter • High-, low-, band-pass or bandstop filter
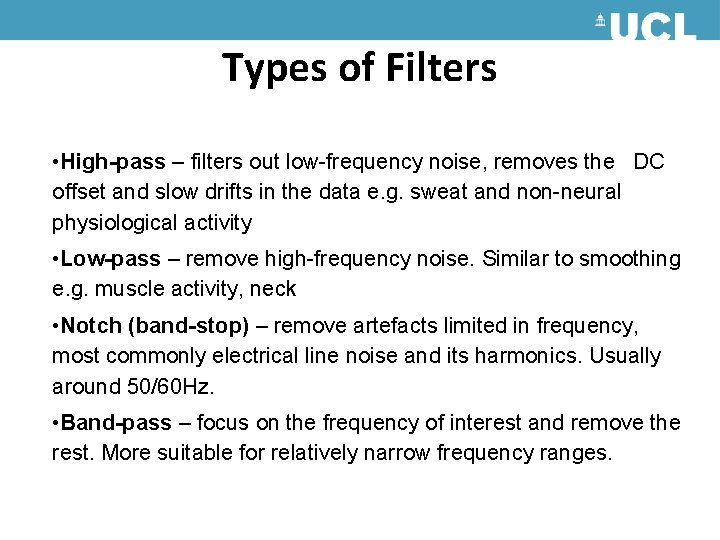
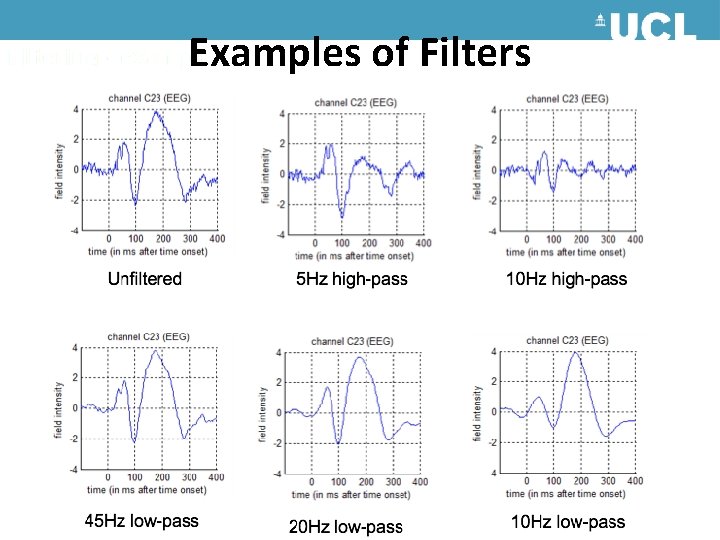
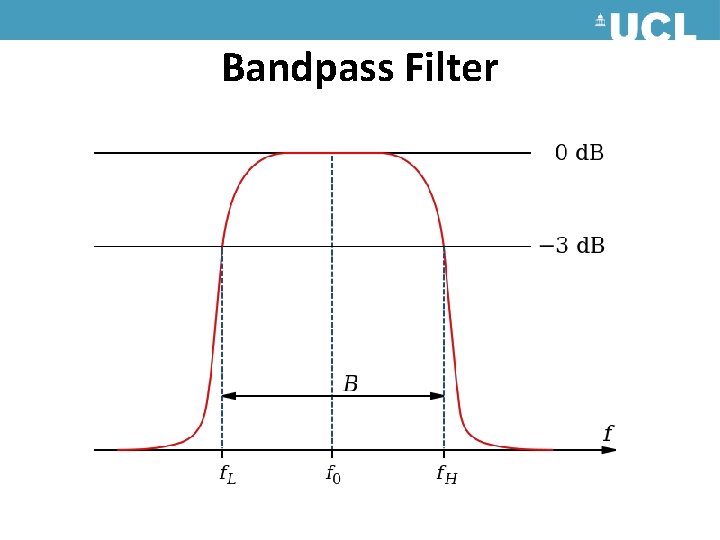
Types of Filters • High-pass – filters out low-frequency noise, removes the DC offset and slow drifts in the data e. g. sweat and non-neural physiological activity • Low-pass – remove high-frequency noise. Similar to smoothing e. g. muscle activity, neck • Notch (band-stop) – remove artefacts limited in frequency, most commonly electrical line noise and its harmonics. Usually around 50/60 Hz. • Band-pass – focus on the frequency of interest and remove the rest. More suitable for relatively narrow frequency ranges.
Examples of Filters
Bandpass Filter
Filtering: SPM 12 Interface
Artefacts
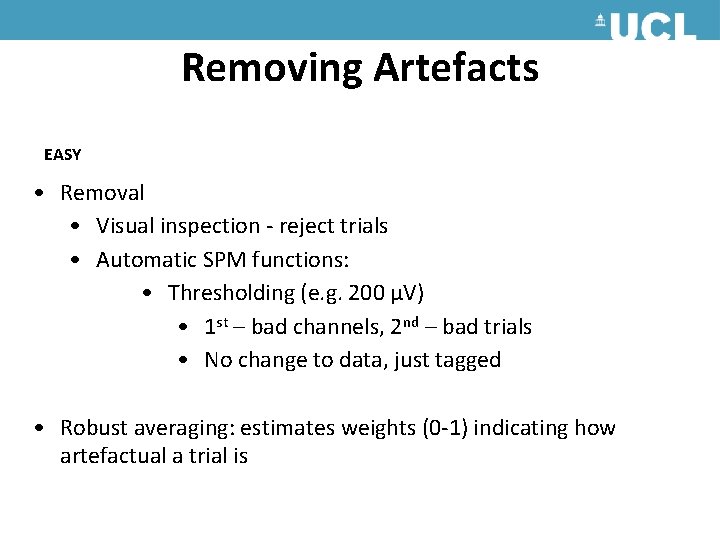
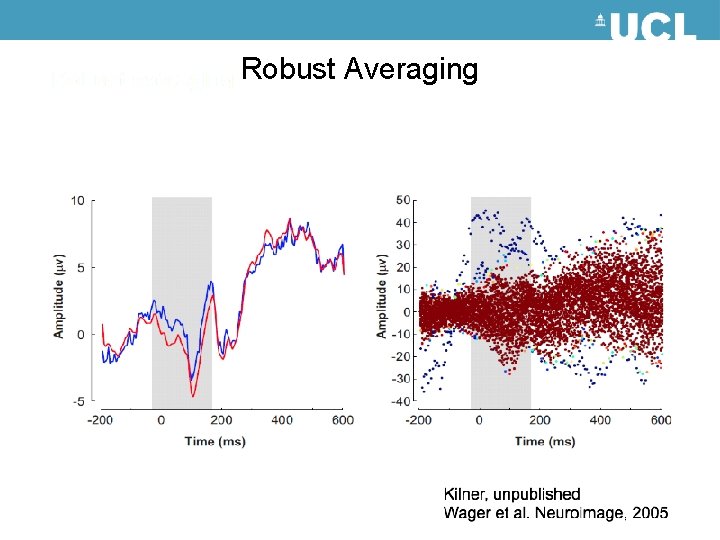
Removing Artefacts EASY • Removal • Visual inspection - reject trials • Automatic SPM functions: • Thresholding (e. g. 200 μV) • 1 st – bad channels, 2 nd – bad trials • No change to data, just tagged • Robust averaging: estimates weights (0 -1) indicating how artefactual a trial is
Robust Averaging
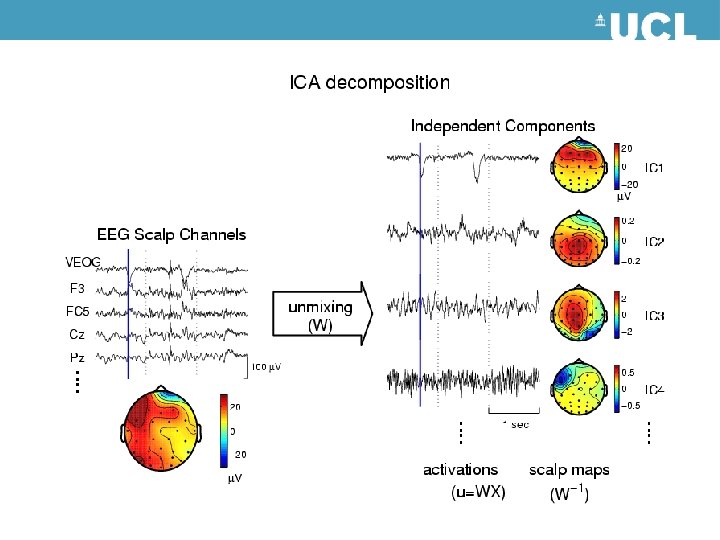
Removing Artefacts HARDER • Use your Eo. G! • Regress out of your signal • Use Independent Component Analysis (ICA) • Eyeblinks are very stereotyped and large • Usually 1 st component
Special thanks to our experts Bernadette and Vladimir Litvak
• • • References Ashburner, J. et al. (2010). SPM 8 Manual. http: //www. fil. ion. ucl. ac. uk/spm/ Hansen, C. P. , Kringelbach M. L. , Salmelin, R. (2010) MEG: An Introduction to Methods. Oxford University Press, Hermann, C. et al. (2004). Cognitive functions of gammaband activity: memory match and utilization. Trends in Cognitive Science, 8(8), 347 -355. Herrmann, C. S. , Grigutsch, M. , & Busch, N. A. (2005). EEG oscillations and wavelet analysis. In T. C. Handy (Ed. ), Event-related potentials: A methods handbook (pp. 229 -259). Cambridge, MA: MIT Press. Luck, S. J. (2005). Ten simple rules for designing ERP experiments. In T. C. Handy (Ed. ), Eventrelated potentials: a methods handbook. Cambridge, MA: MIT Press. Luck, S. J. (2010). Powerpoint Slides from ERP Boot Camp Lectures. http: //erpinfo. org/Members/ldtien/bootcamp-lecture-pptx Otten, L. (2012, November 21). EEG/MEG Acquisition, Analysis and Interpretation, MSc Cognitive Neuroscience, UCL Otten, L. J. & Rugg, M. D. (2005). Interpreting event-related brain potentials. In T. C. Handy (Ed. ), Event-related potentials: a methods handbook. Cambridge, MA: MIT Press. . Sauseng, P. , & Klimesch, W. (2008). What does phase information of oscillatory brain activity tell us about cognitive processes? [Review]. Neuroscience and Biobehavioral Reviews, 32(5), 10011013. doi: 10. 1016/j. neubiorev. 2008. 03. 014 http: //sccn. ucsd. edu/~jung/artifact. html Mf. D slides from previous years