Earths Atmosphere Climate Change Fig 2 p 312
- Slides: 83
Earth’s Atmosphere & Climate Change
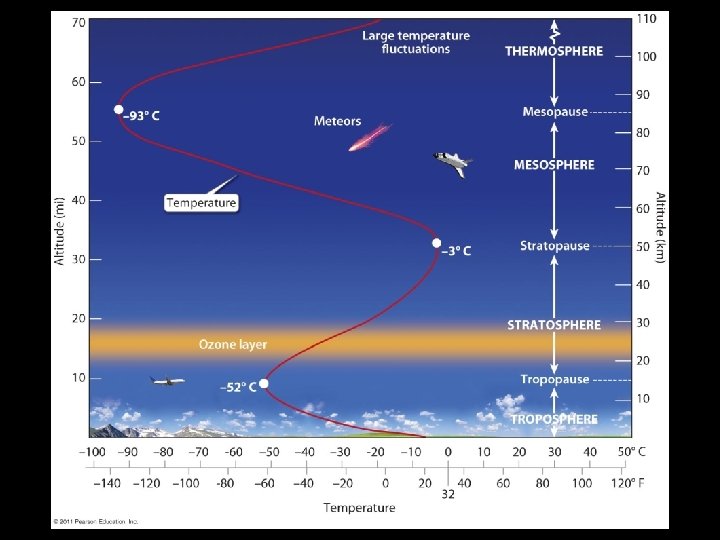
Fig. 2, p. 312
Chapter Objectives • Weather, climate & climate basics • Climate change through geologic time • Ice ages • Present day climate change
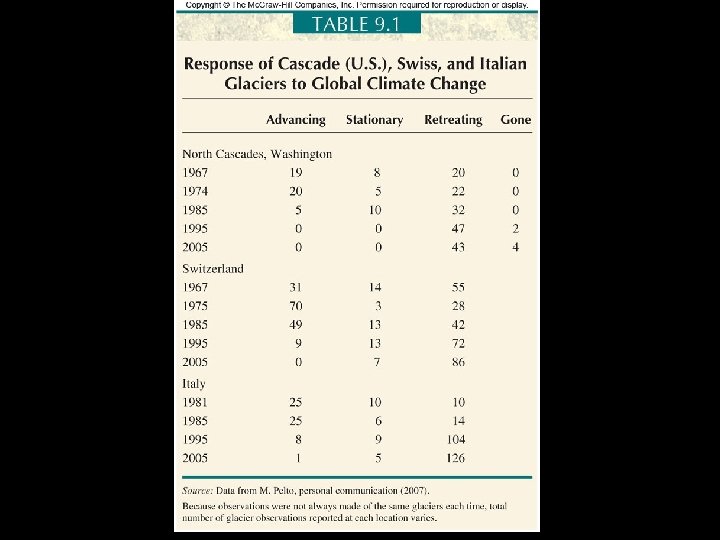
Table 9. 1
I. Weather & Climate Is there a difference? Absolutely! A. Weather Fluctuations in temperature, precipitation, atmospheric pressure, and winds on time scales of less than a year.
I. Weather & Climate B. Climate “long term” changes or patterns in temperature, precipitation, wind, atmospheric pressure, etc… • generally accepted intervals of 30 years or more
I. Weather & Climate “Climate is what you expect, weather is what you get!”
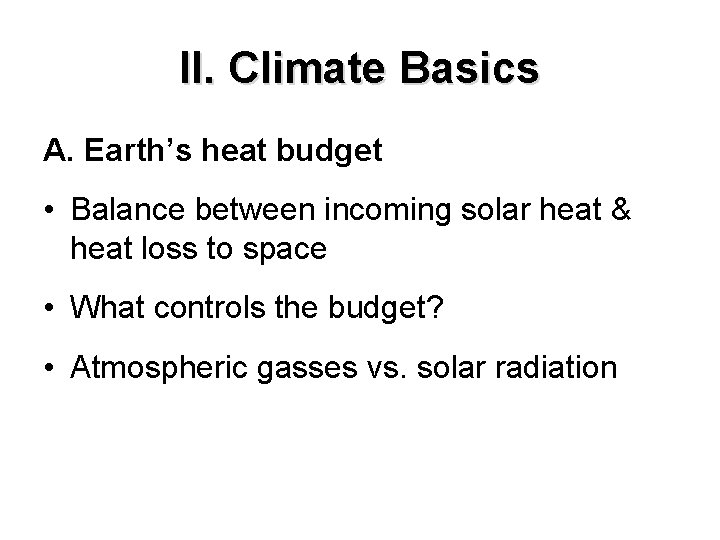
II. Climate Basics A. Earth’s heat budget • Balance between incoming solar heat & heat loss to space • What controls the budget? • Atmospheric gasses vs. solar radiation
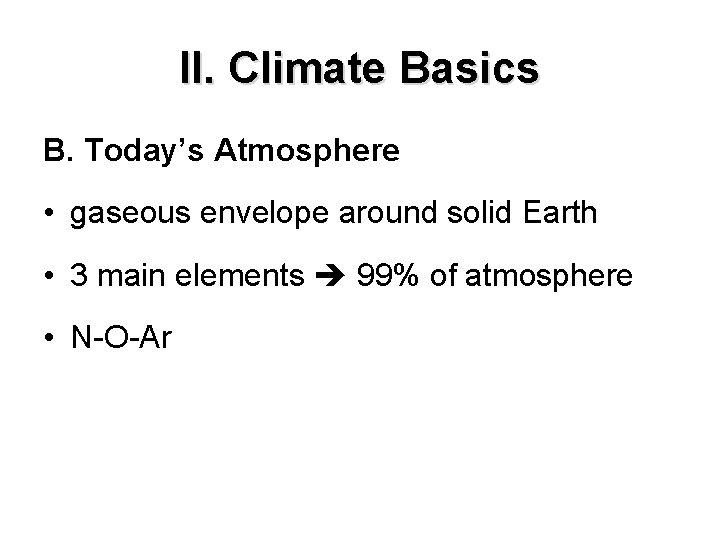
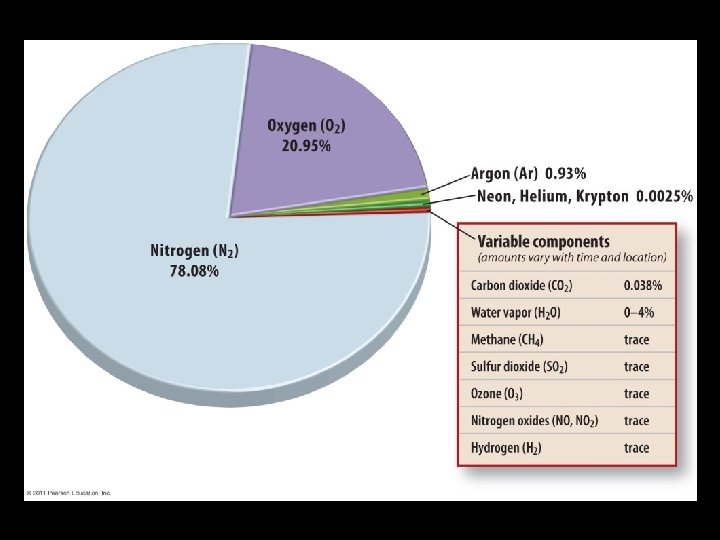
II. Climate Basics B. Today’s Atmosphere • gaseous envelope around solid Earth • 3 main elements 99% of atmosphere • N-O-Ar
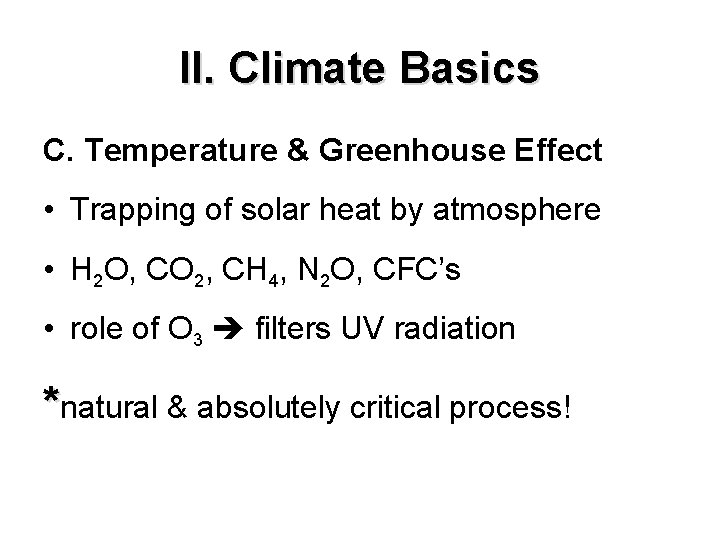
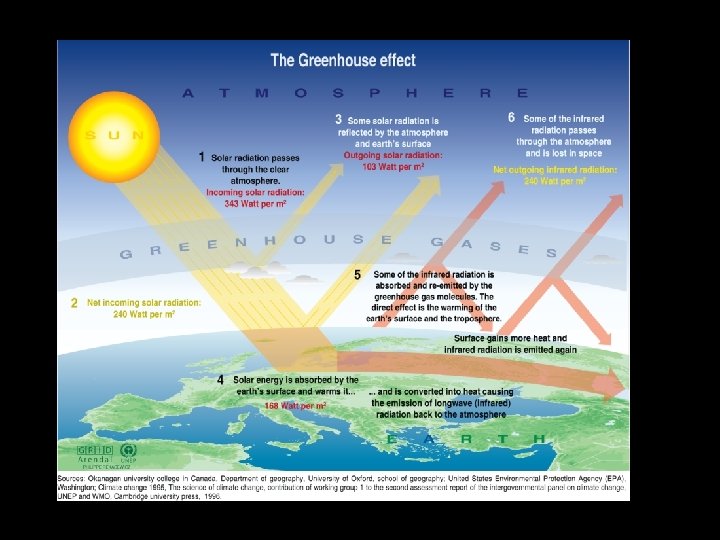
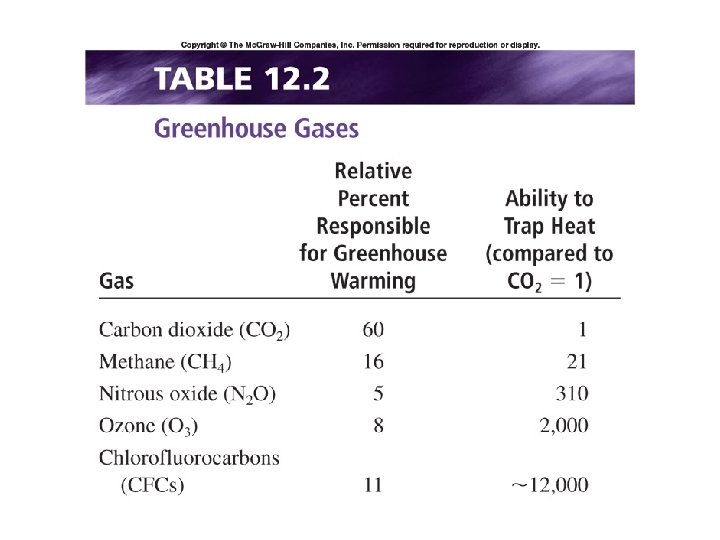
II. Climate Basics C. Temperature & Greenhouse Effect • Trapping of solar heat by atmosphere • H 2 O, CO 2, CH 4, N 2 O, CFC’s • role of O 3 filters UV radiation *natural & absolutely critical process!
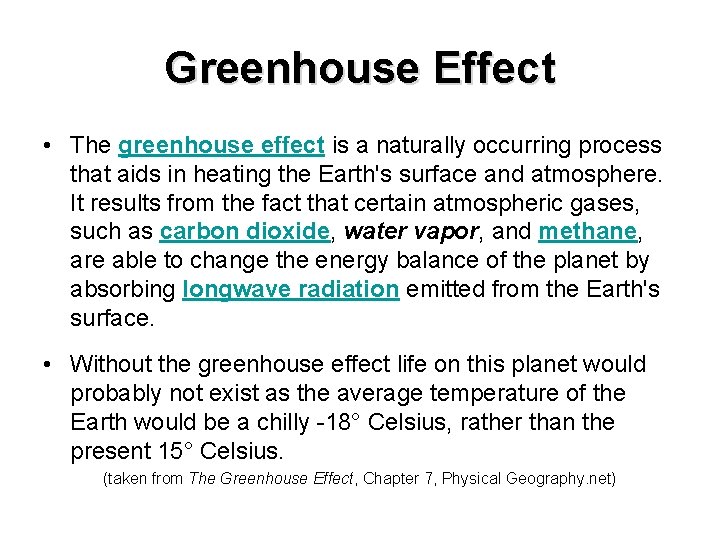
Greenhouse Effect • The greenhouse effect is a naturally occurring process that aids in heating the Earth's surface and atmosphere. It results from the fact that certain atmospheric gases, such as carbon dioxide, water vapor, and methane, are able to change the energy balance of the planet by absorbing longwave radiation emitted from the Earth's surface. • Without the greenhouse effect life on this planet would probably not exist as the average temperature of the Earth would be a chilly -18° Celsius, rather than the present 15° Celsius. (taken from The Greenhouse Effect, Chapter 7, Physical Geography. net)
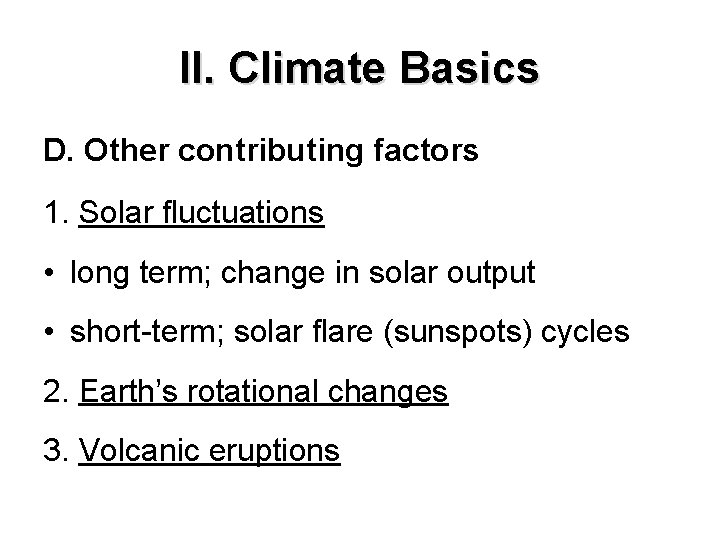
II. Climate Basics D. Other contributing factors 1. Solar fluctuations • long term; change in solar output • short-term; solar flare (sunspots) cycles 2. Earth’s rotational changes 3. Volcanic eruptions
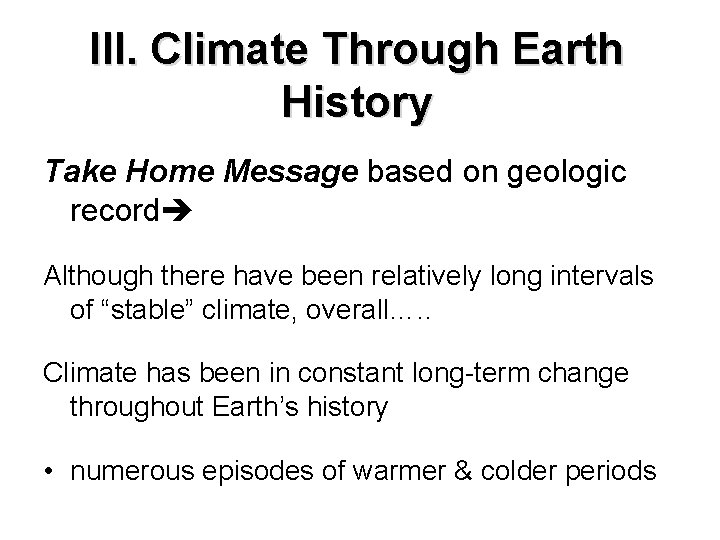
III. Climate Through Earth History Take Home Message based on geologic record Although there have been relatively long intervals of “stable” climate, overall…. . Climate has been in constant long-term change throughout Earth’s history • numerous episodes of warmer & colder periods
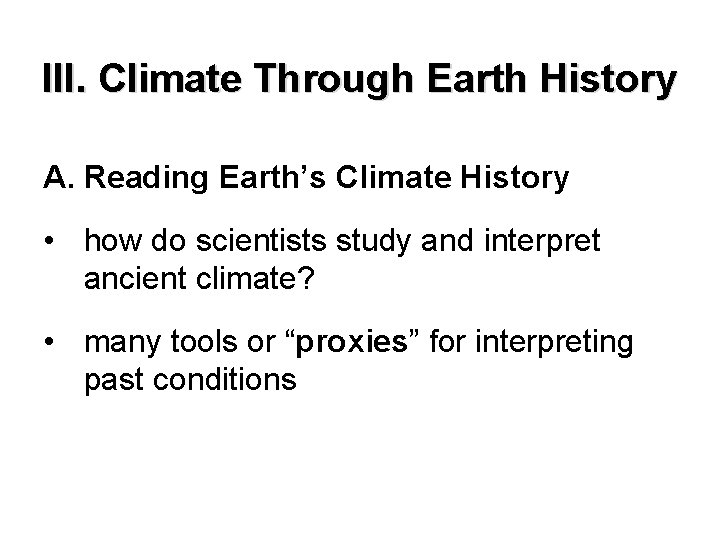
III. Climate Through Earth History A. Reading Earth’s Climate History • how do scientists study and interpret ancient climate? • many tools or “proxies” for interpreting past conditions
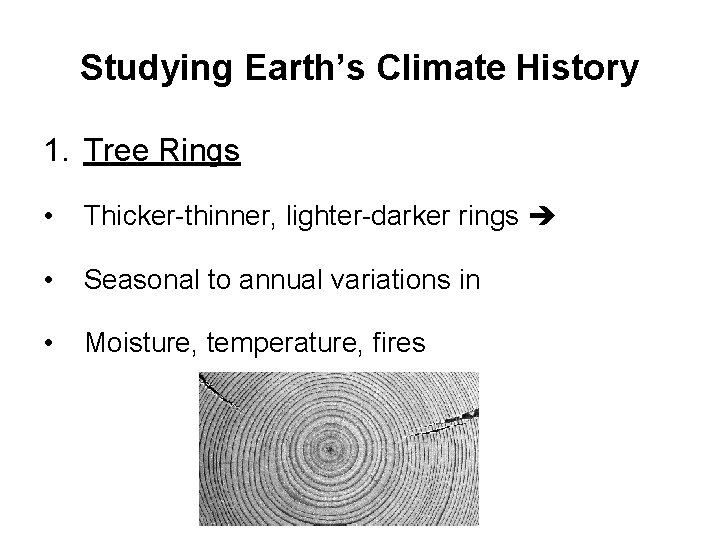
Studying Earth’s Climate History 1. Tree Rings • Thicker-thinner, lighter-darker rings • Seasonal to annual variations in • Moisture, temperature, fires
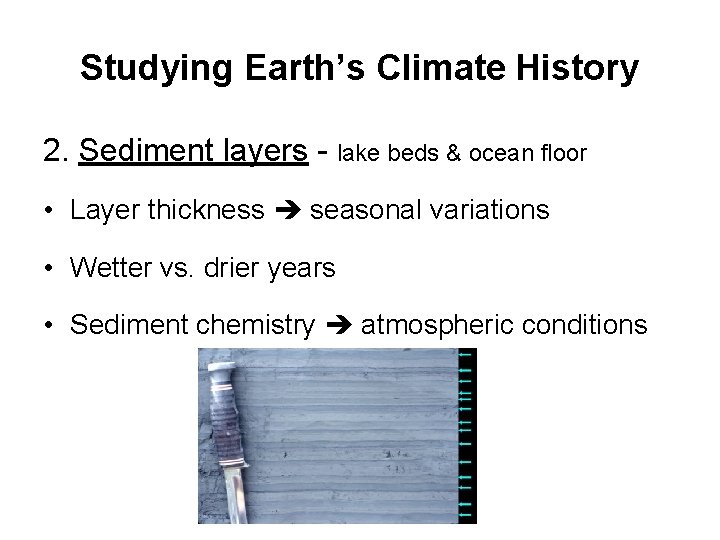
Studying Earth’s Climate History 2. Sediment layers - lake beds & ocean floor • Layer thickness seasonal variations • Wetter vs. drier years • Sediment chemistry atmospheric conditions
Studying Earth’s Climate History 3. Specific rock types sedimentary rocks • Limestones = warm water • Salts = warm (desert salt flats) • Coal = warm (swamp deposits) • Tillites = cold (glacial deposits)
Studying Earth’s Climate History 4. Fossils in rocks • Tropical fossils corals and marine fauna = warm vs. cold conditions • Land animals dinosaurs, etc. = warm • Plant fossils deciduous vs. coniferous vs. grassland/tundra
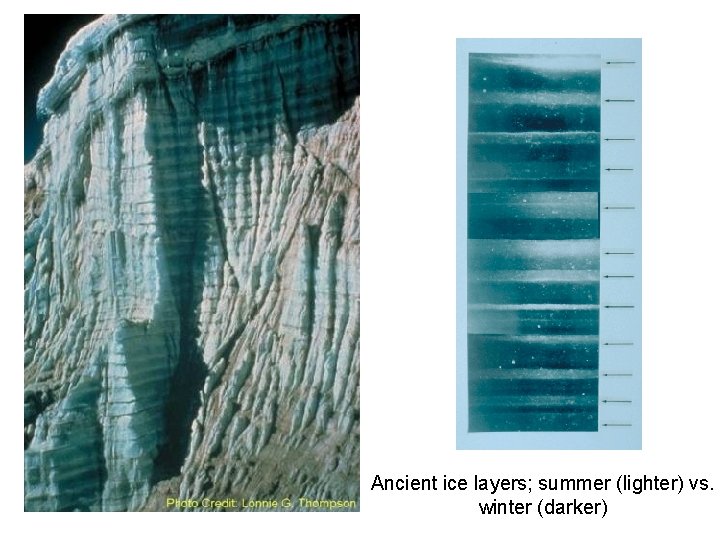
Studying Earth’s Climate History 5. Ice layers • Annual layers of ice in glaciers • Trapped gasses and dust CO 2, etc. • Atmospheric conditions, volcanic activity • Dated layers tell about specific conditions
Ancient ice layers; summer (lighter) vs. winter (darker)
Studying Earth’s Climate History 6. Chemical Isotopes • abundances of oxygen isotopes give ages and atmospheric compositions • recorded in rocks, fossils, sea floor sediment, glacial ice
Studying Earth’s Climate History Take Home Message Geologists and climate scientists have many tools, proxies for determining past climate conditions.
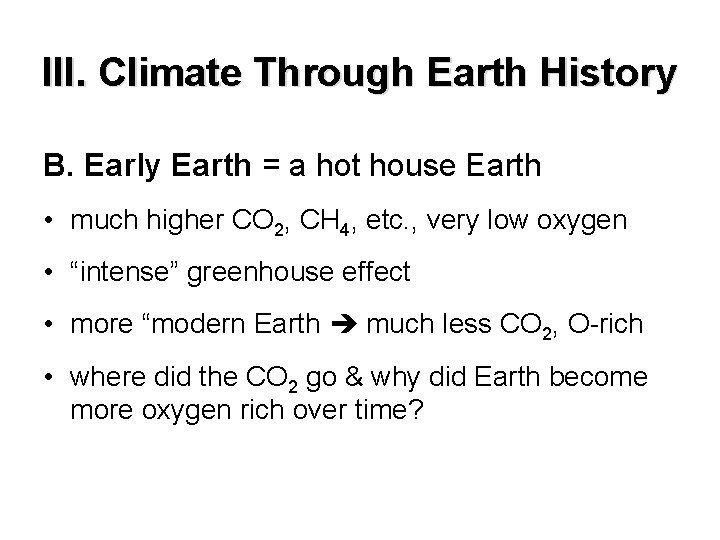
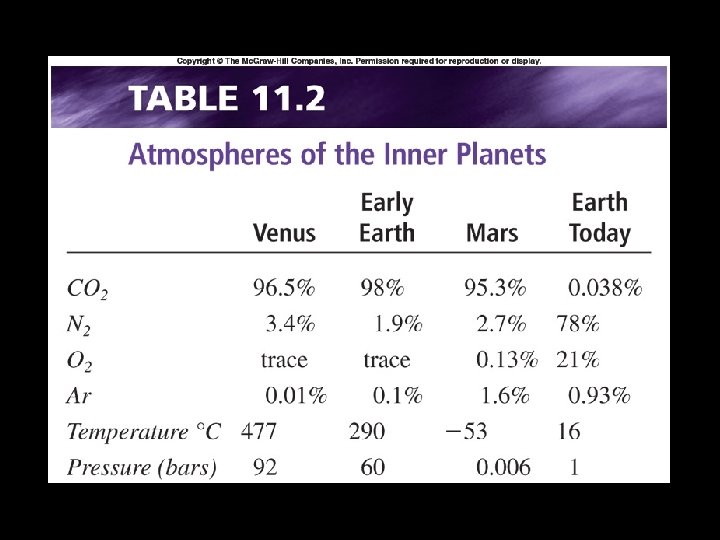
III. Climate Through Earth History B. Early Earth = a hot house Earth • much higher CO 2, CH 4, etc. , very low oxygen • “intense” greenhouse effect • more “modern Earth much less CO 2, O-rich • where did the CO 2 go & why did Earth become more oxygen rich over time?
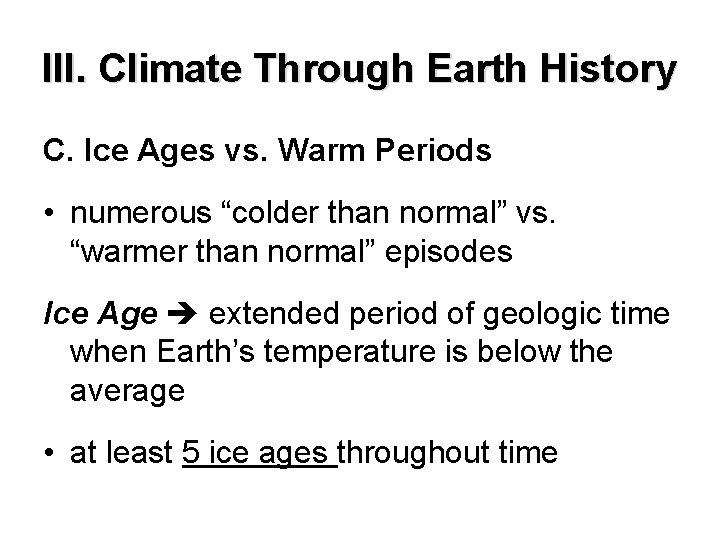
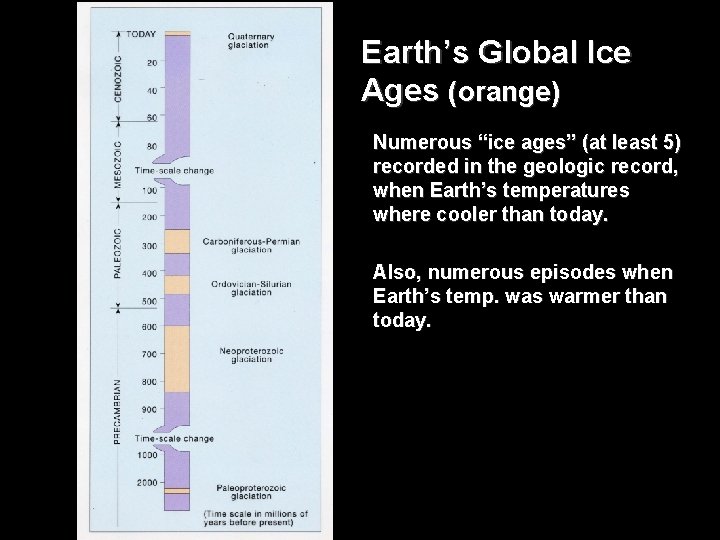
III. Climate Through Earth History C. Ice Ages vs. Warm Periods • numerous “colder than normal” vs. “warmer than normal” episodes Ice Age extended period of geologic time when Earth’s temperature is below the average • at least 5 ice ages throughout time
Earth’s Global Ice Ages (orange) Numerous “ice ages” (at least 5) recorded in the geologic record, when Earth’s temperatures where cooler than today. Also, numerous episodes when Earth’s temp. was warmer than today.
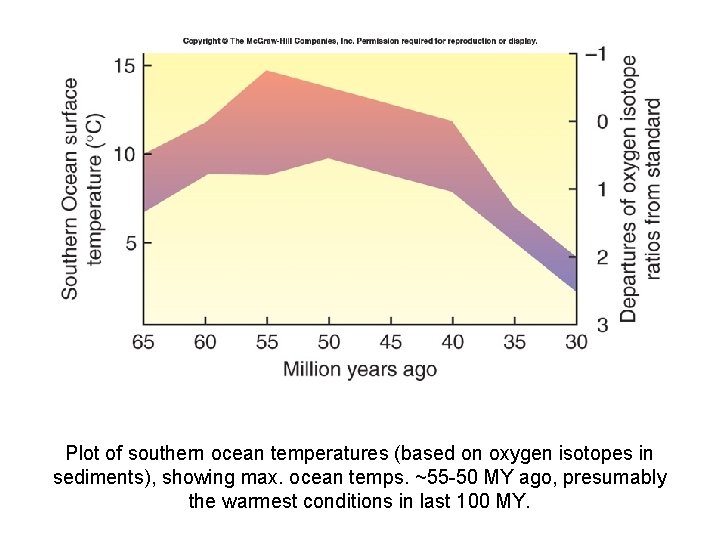
III. Climate Through Earth History D. Cenozoic Climate Change • warming peak at ~55 MY ago • last 55 MY, slow, gradual cooling • Continental sized glaciers in N. America ~2. 0 MY • Pleistocene ice age
Plot of southern ocean temperatures (based on oxygen isotopes in sediments), showing max. ocean temps. ~55 -50 MY ago, presumably the warmest conditions in last 100 MY.
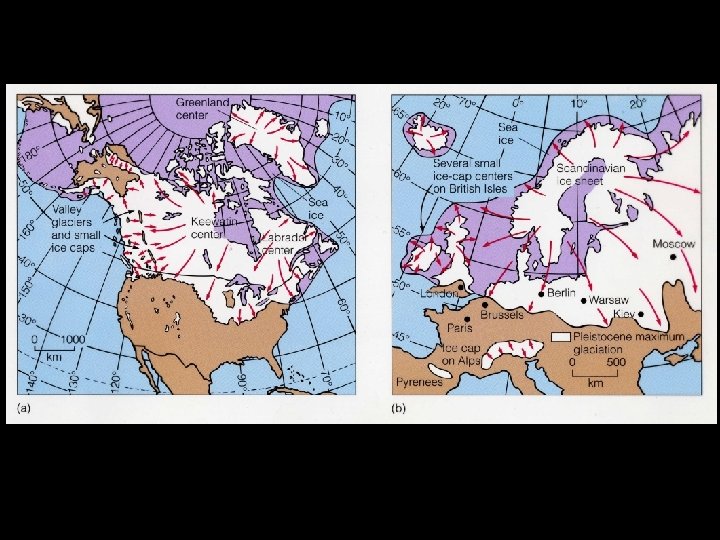
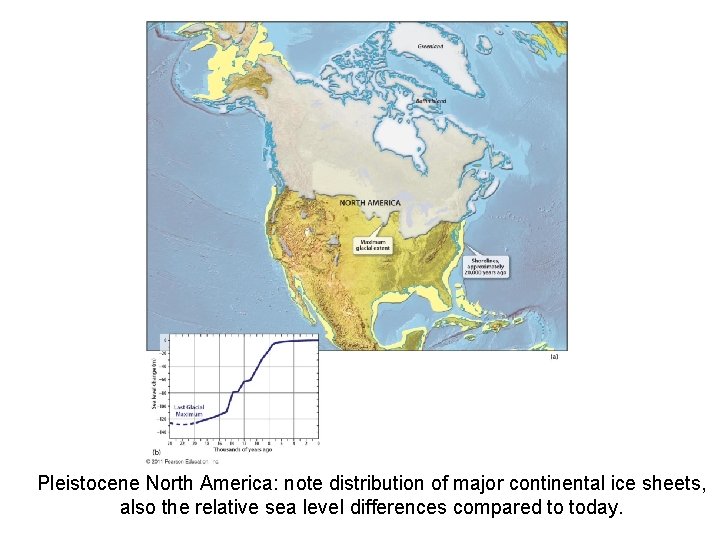
III. Climate Through Earth History E. Pleistocene Ice Age • most recent ice age • ~2. 0 MY – 16, 000 BP • North America northern U. S. , Canada, Greenland • Northern Europe + Siberia
Pleistocene North America: note distribution of major continental ice sheets, also the relative sea level differences compared to today.
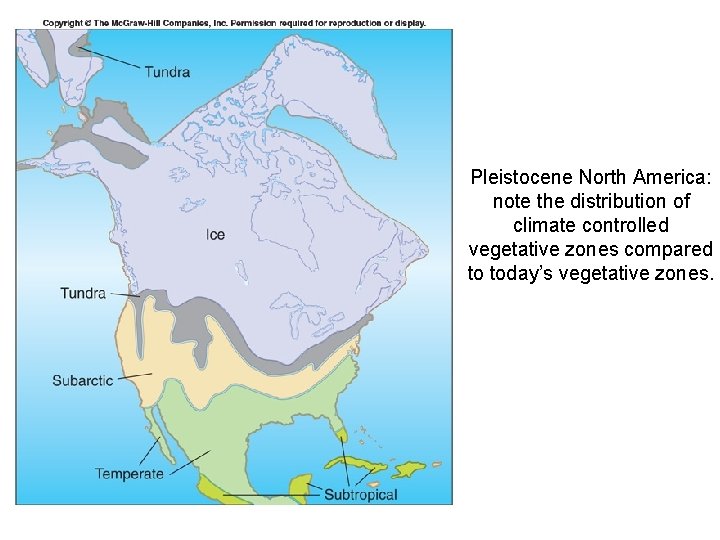
Pleistocene North America: note the distribution of climate controlled vegetative zones compared to today’s vegetative zones.
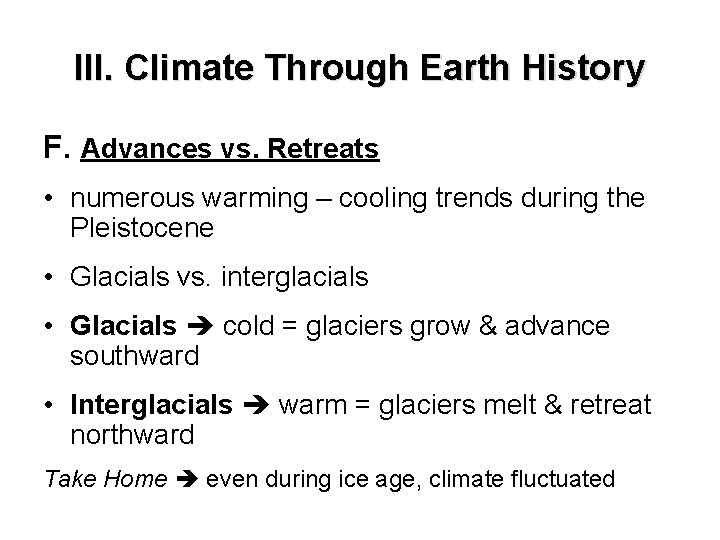
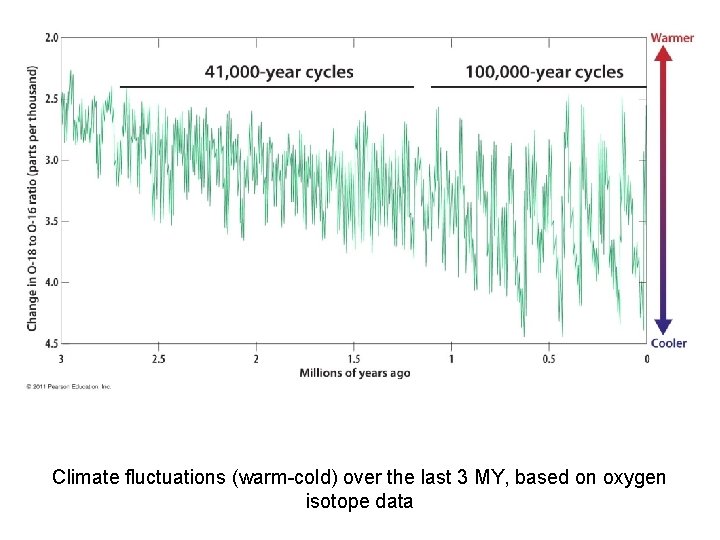
III. Climate Through Earth History F. Advances vs. Retreats • numerous warming – cooling trends during the Pleistocene • Glacials vs. interglacials • Glacials cold = glaciers grow & advance southward • Interglacials warm = glaciers melt & retreat northward Take Home even during ice age, climate fluctuated
Climate fluctuations (warm-cold) over the last 3 MY, based on oxygen isotope data
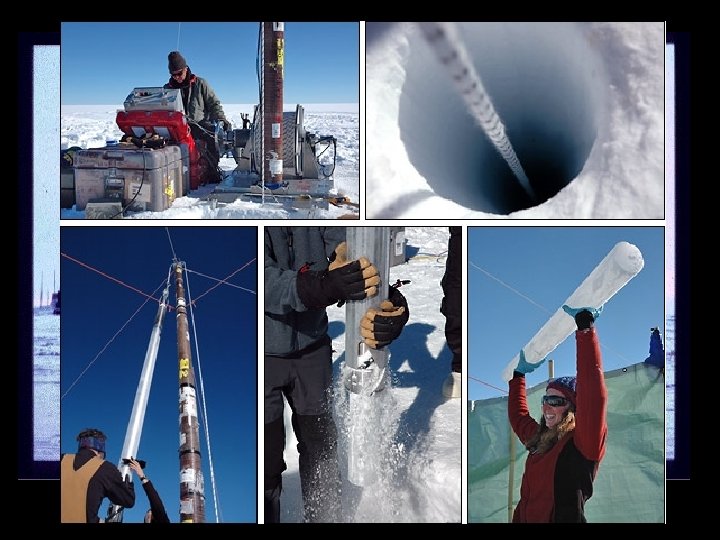
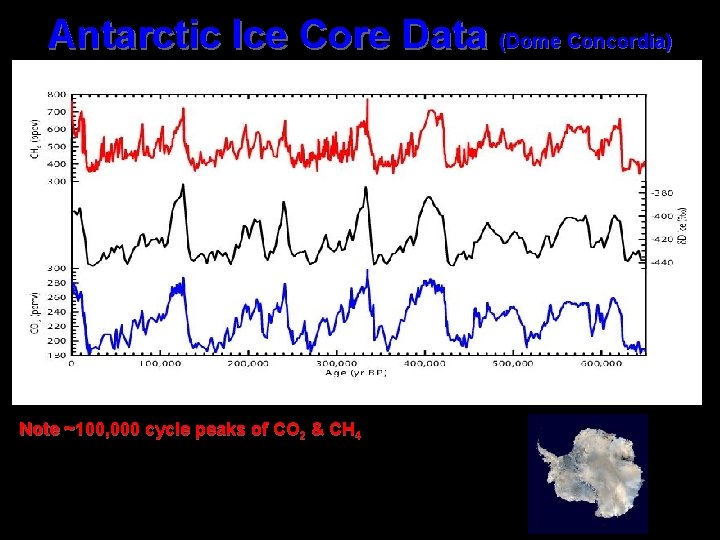
III. Climate Through Earth History G. Closer Look: most modern times • Ice core data: Greenland & Antarctica • CO 2 & CH 4 concentrations in ice • Dust concentrations • Ice layers dated oxygen isotopes • CO 2 & CH 4 correlate to temperature
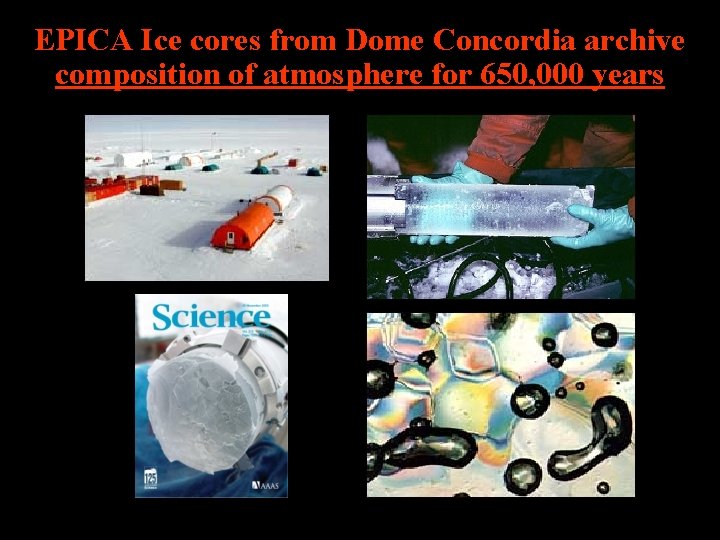
EPICA Ice cores from Dome Concordia archive composition of atmosphere for 650, 000 years (Science/November 25, 2005)
Antarctic Ice Core Data (Dome Concordia) Note ~100, 000 cycle peaks of CO 2 & CH 4
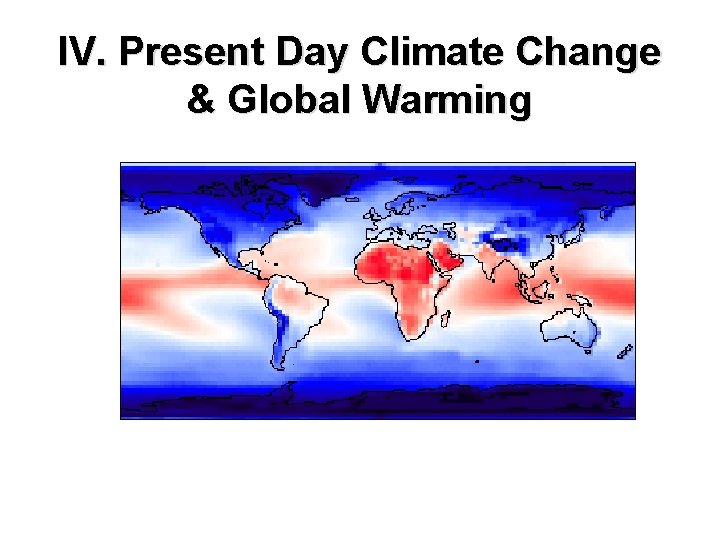
IV. Present Day Climate Change & Global Warming
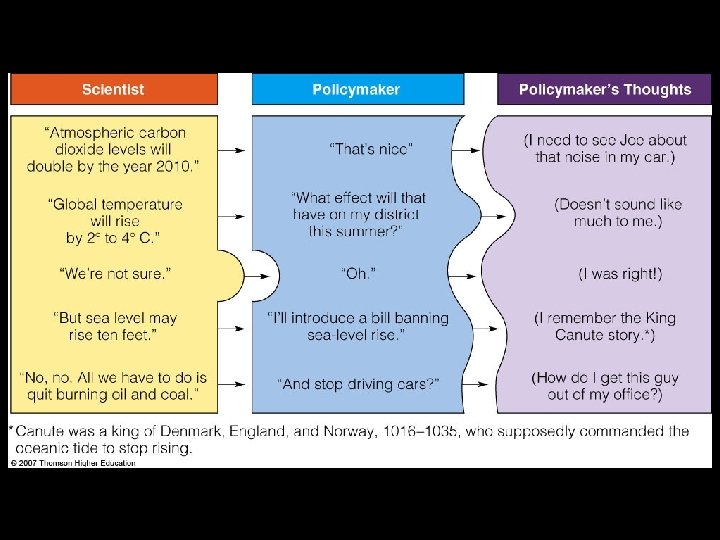
So, What Do We Know About The Present Climate Change Pattern?
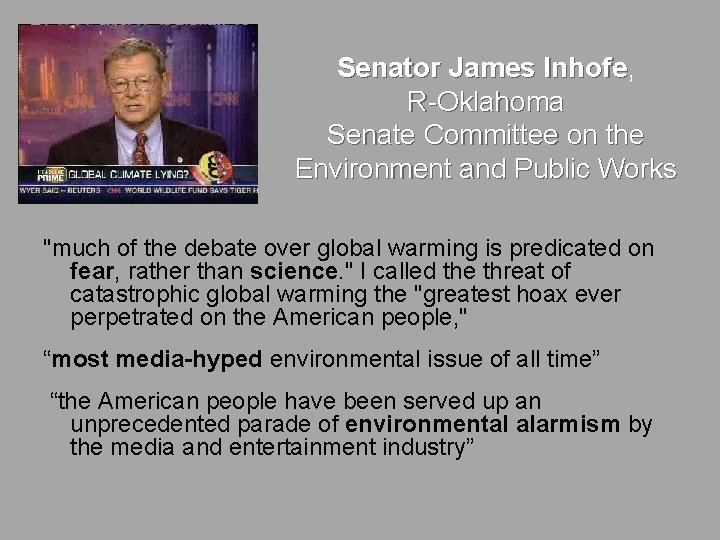
Senator James Inhofe, Inhofe R-Oklahoma Senate Committee on the Environment and Public Works "much of the debate over global warming is predicated on fear, rather than science. " I called the threat of catastrophic global warming the "greatest hoax ever perpetrated on the American people, " “most media-hyped environmental issue of all time” “the American people have been served up an unprecedented parade of environmental alarmism by the media and entertainment industry”
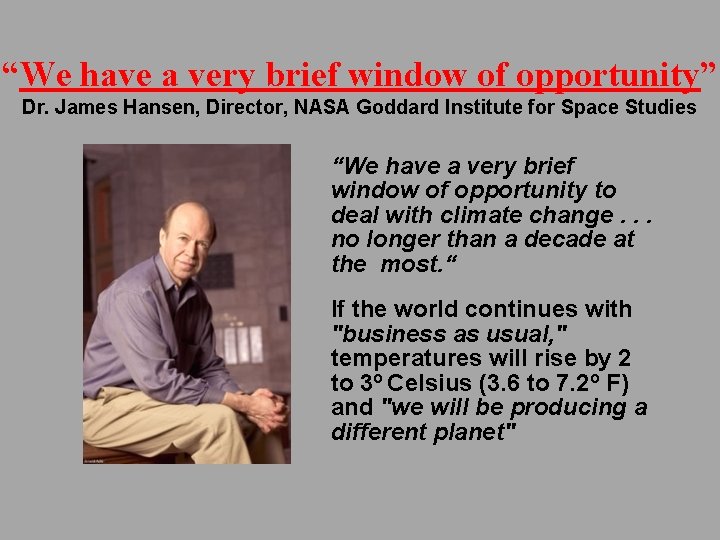
“We have a very brief window of opportunity” Dr. James Hansen, Director, NASA Goddard Institute for Space Studies “We have a very brief window of opportunity to deal with climate change. . . no longer than a decade at the most. “ If the world continues with "business as usual, " temperatures will rise by 2 to 3 o Celsius (3. 6 to 7. 2 o F) and "we will be producing a different planet"
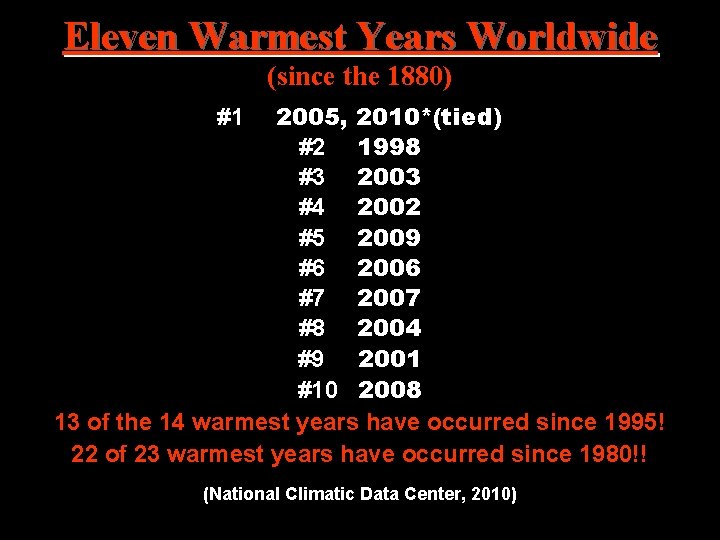
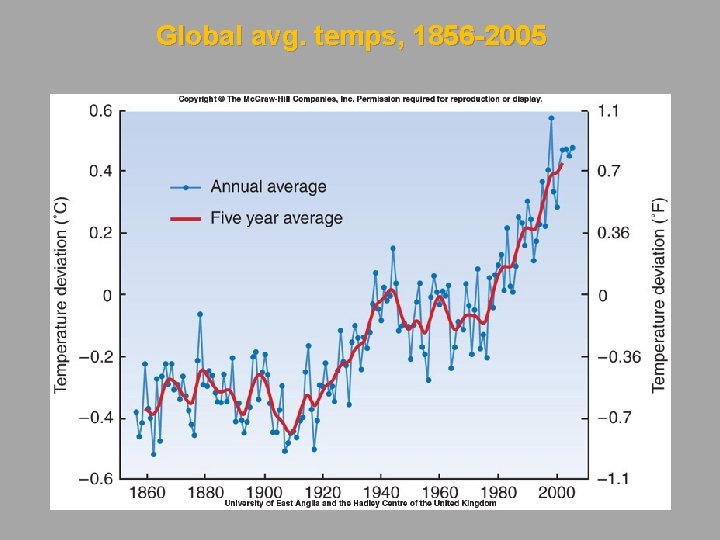
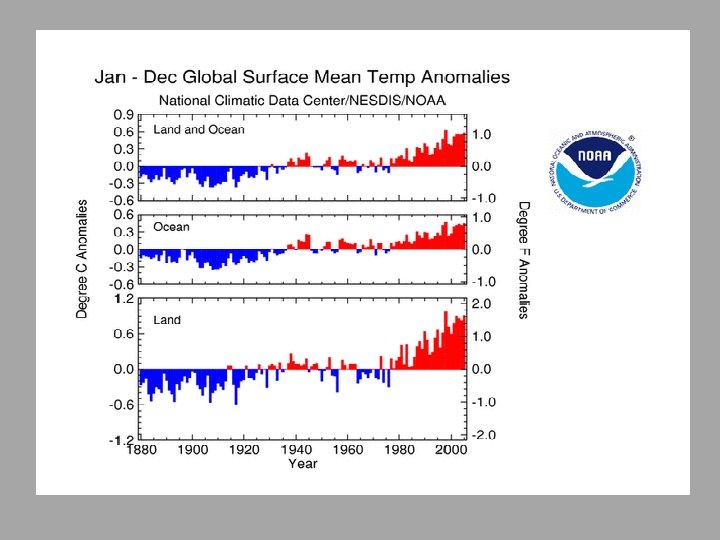
Eleven Warmest Years Worldwide (since the 1880) 2005, 2010*(tied) #2 1998 #3 2003 #4 2002 #5 2009 #6 2006 #7 2007 #8 2004 #9 2001 #10 2008 13 of the 14 warmest years have occurred since 1995! 22 of 23 warmest years have occurred since 1980!! #1 (National Climatic Data Center, 2010)
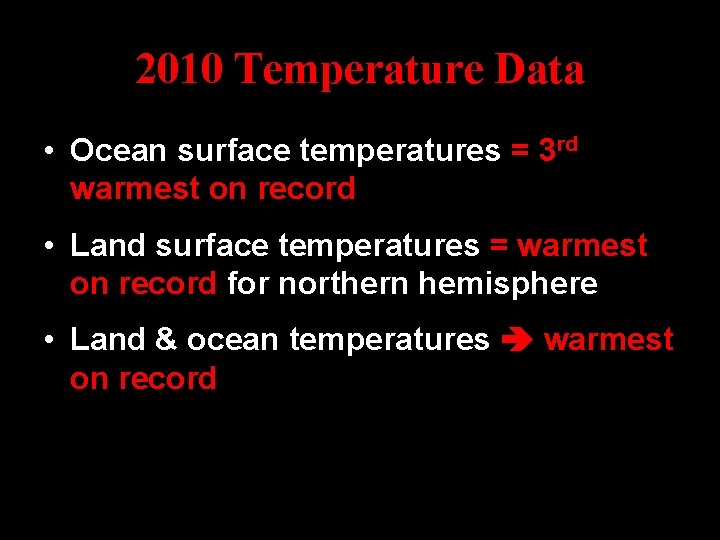
2010 Temperature Data • Ocean surface temperatures = 3 rd warmest on record • Land surface temperatures = warmest on record for northern hemisphere • Land & ocean temperatures warmest on record
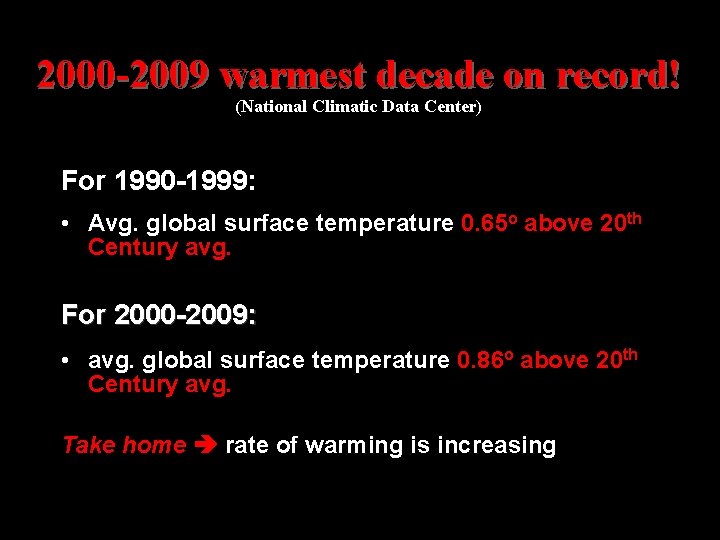
2000 -2009 warmest decade on record! (National Climatic Data Center) For 1990 -1999: • Avg. global surface temperature 0. 65 o above 20 th Century avg. For 2000 -2009: • avg. global surface temperature 0. 86 o above 20 th Century avg. Take home rate of warming is increasing
IV. Present Climate Trend A. Global Warming overall “gradual” warming of Earth’s surface, atmosphere & ocean temperatures B. Cause? • Natural causes • Anthropogenic (human influences) • GHG’s must be considered!
IV. Present Global Warming Anthropogenic contributions • Increased GHG’s to atmosphere burning of fossil fuels since start of the Industrial Revolution • Significant increases in CO 2, CH 4, N 2 O, CFC’s
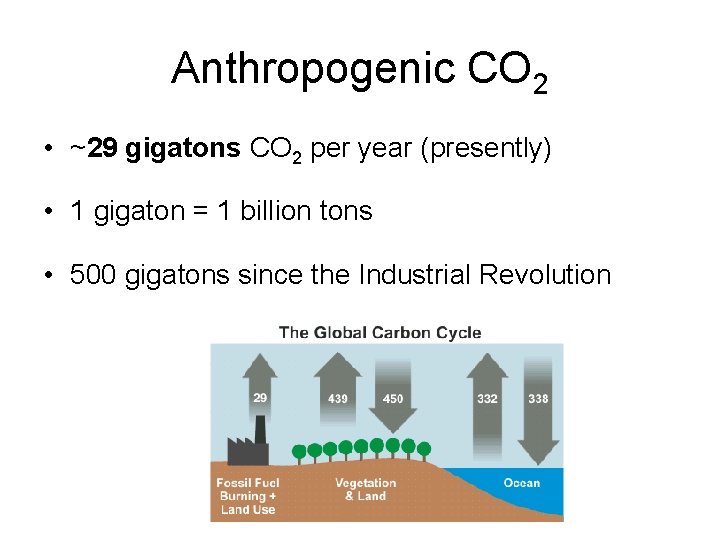
Anthropogenic CO 2 • ~29 gigatons CO 2 per year (presently) • 1 gigaton = 1 billion tons • 500 gigatons since the Industrial Revolution
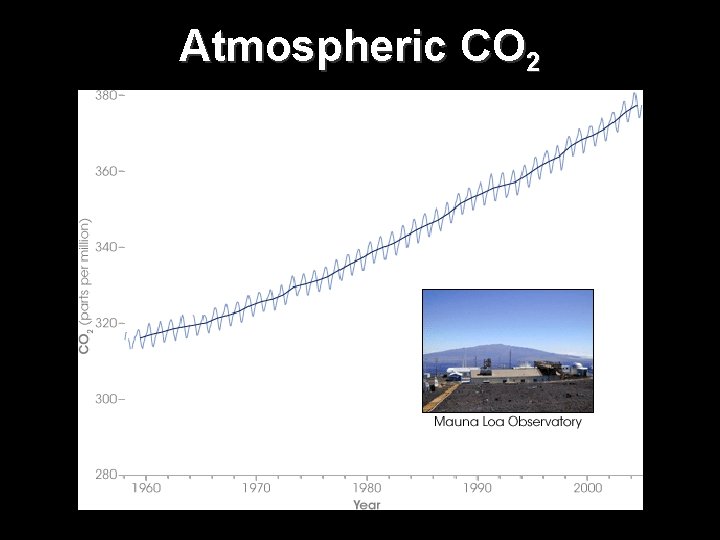
Atmospheric CO 2
Atmospheric CO 2 • ~280 ppm CO 2 = pre-Industrial Revolution age levels • 391 ppm CO 2 = March 1, 2011 • The rate of CO 2 & CH 4 increase over the last 150 years is higher than at any time in the last 850, 000 years
Atmospheric CO 2 • CO 2 levels 30% higher than anytime since the last glacial maxima • Estimated present rate of CO 2 increase is 200 x faster than anytime in last 850, 000 years! • CH 4 levels 130% higher
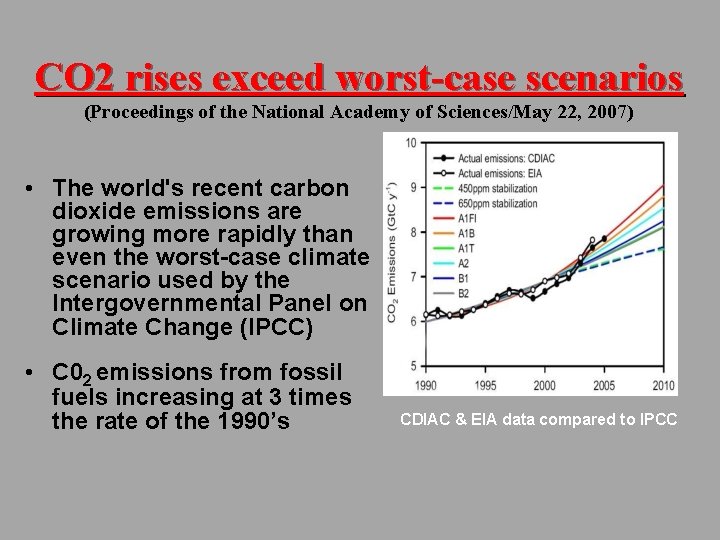
CO 2 rises exceed worst-case scenarios (Proceedings of the National Academy of Sciences/May 22, 2007) • The world's recent carbon dioxide emissions are growing more rapidly than even the worst-case climate scenario used by the Intergovernmental Panel on Climate Change (IPCC) • C 02 emissions from fossil fuels increasing at 3 times the rate of the 1990’s CDIAC & EIA data compared to IPCC
Global avg. temps, 1856 -2005
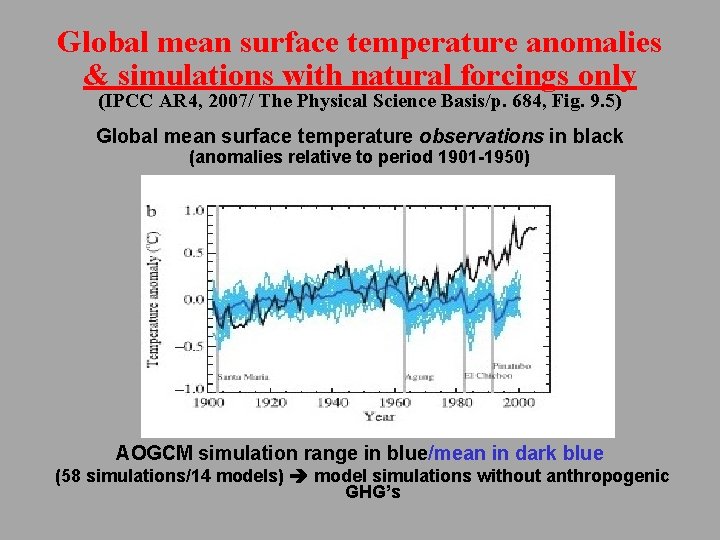
Global mean surface temperature anomalies & simulations with natural forcings only (IPCC AR 4, 2007/ The Physical Science Basis/p. 684, Fig. 9. 5) Global mean surface temperature observations in black (anomalies relative to period 1901 -1950) AOGCM simulation range in blue/mean in dark blue (58 simulations/14 models) model simulations without anthropogenic GHG’s
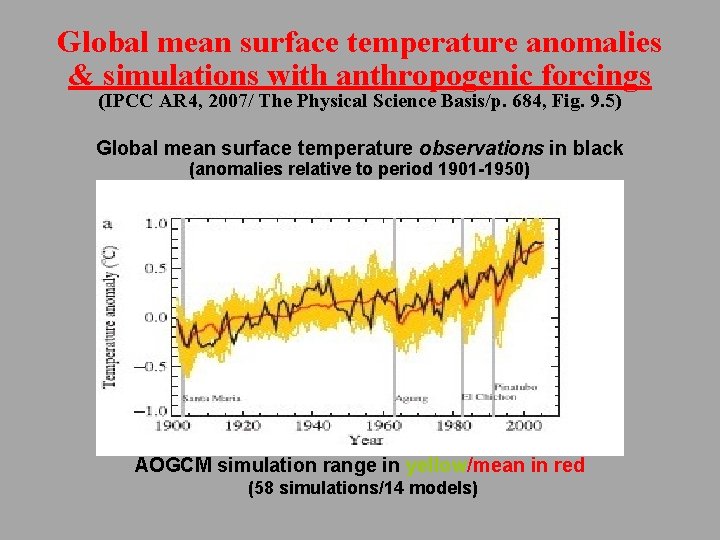
Global mean surface temperature anomalies & simulations with anthropogenic forcings (IPCC AR 4, 2007/ The Physical Science Basis/p. 684, Fig. 9. 5) Global mean surface temperature observations in black (anomalies relative to period 1901 -1950) AOGCM simulation range in yellow/mean in red (58 simulations/14 models)
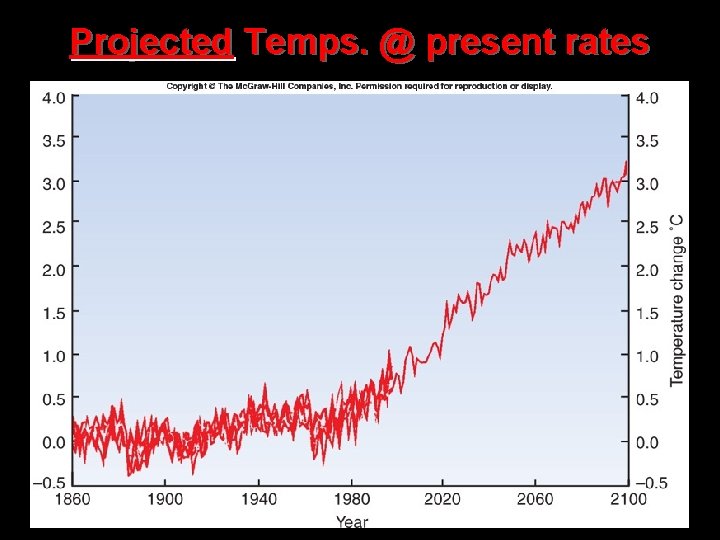
Projected Temps. @ present rates
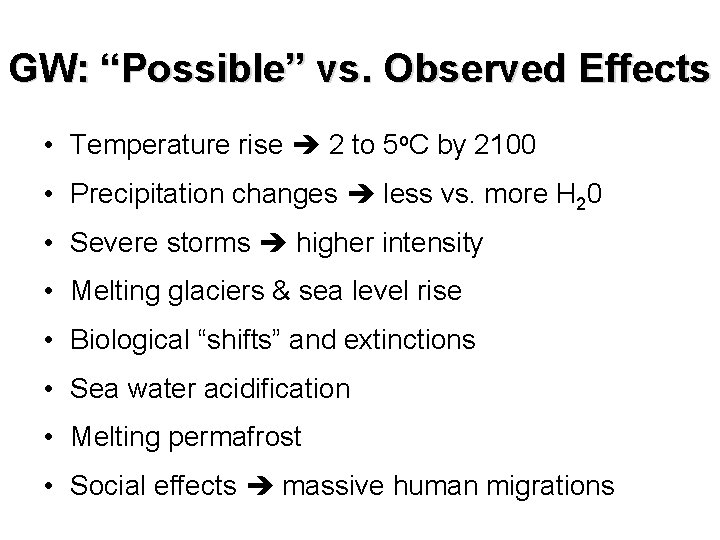
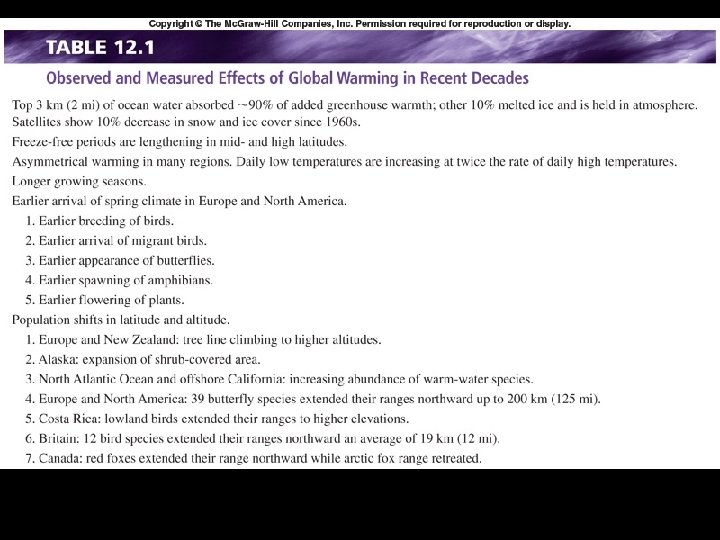
GW: “Possible” vs. Observed Effects • Temperature rise 2 to 5 o. C by 2100 • Precipitation changes less vs. more H 20 • Severe storms higher intensity • Melting glaciers & sea level rise • Biological “shifts” and extinctions • Sea water acidification • Melting permafrost • Social effects massive human migrations
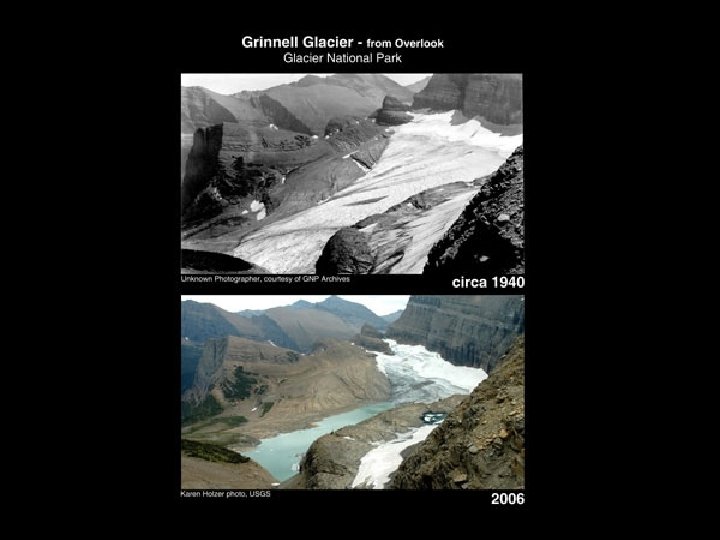
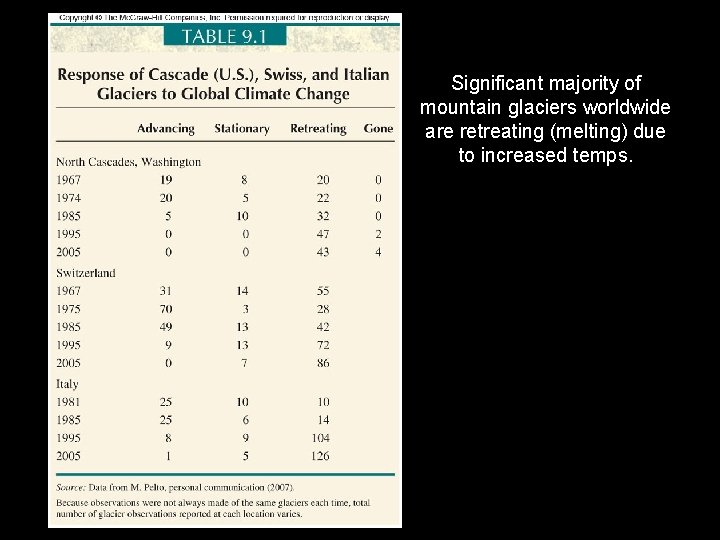
Significant majority of mountain glaciers worldwide are retreating (melting) due to increased temps.
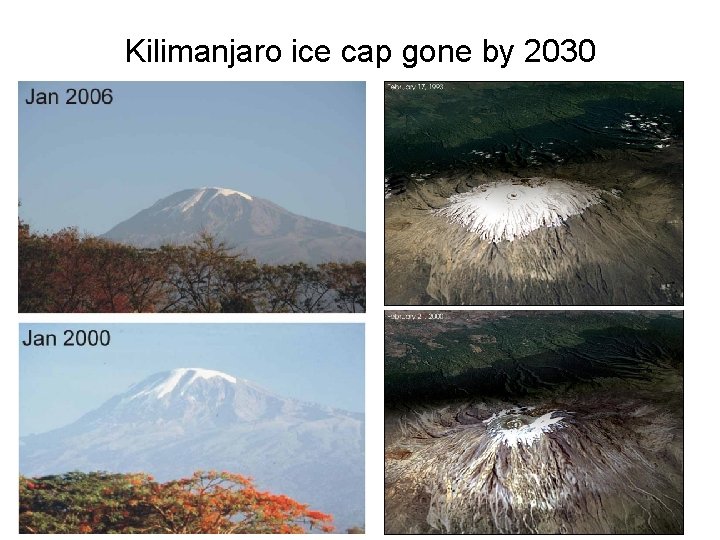
Kilimanjaro ice cap gone by 2030
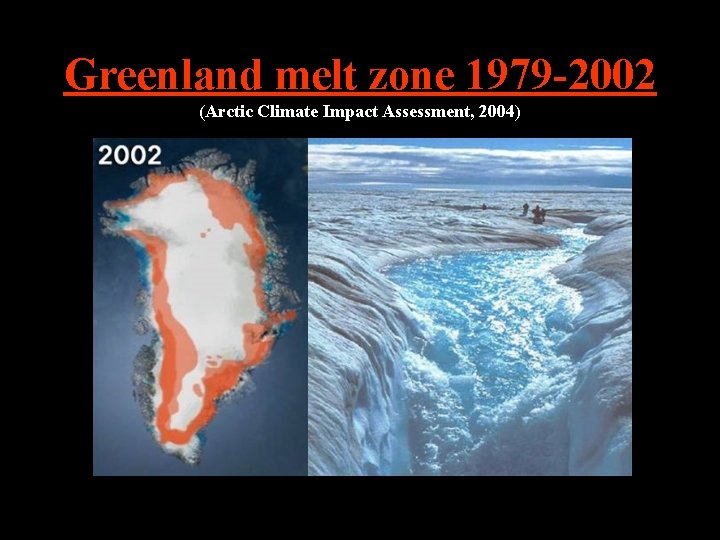
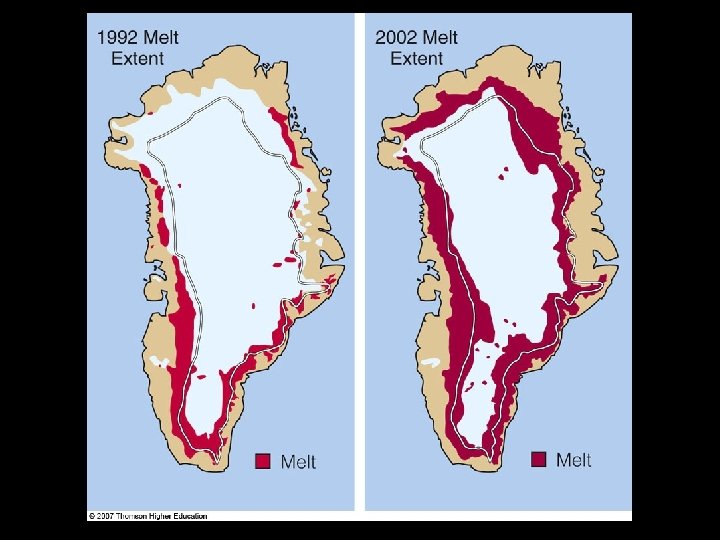
Greenland melt zone 1979 -2002 (Arctic Climate Impact Assessment, 2004)
Fig. 11 -33, p. 336
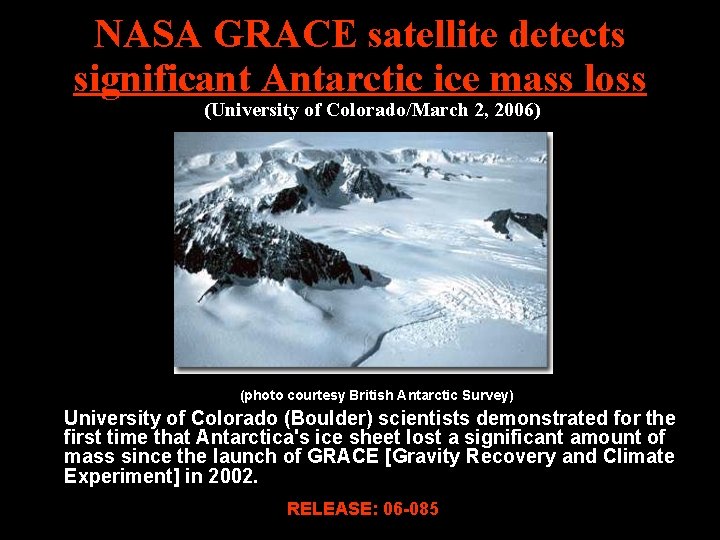
NASA GRACE satellite detects significant Antarctic ice mass loss (University of Colorado/March 2, 2006) (photo courtesy British Antarctic Survey) University of Colorado (Boulder) scientists demonstrated for the first time that Antarctica's ice sheet lost a significant amount of mass since the launch of GRACE [Gravity Recovery and Climate Experiment] in 2002. RELEASE: 06 -085
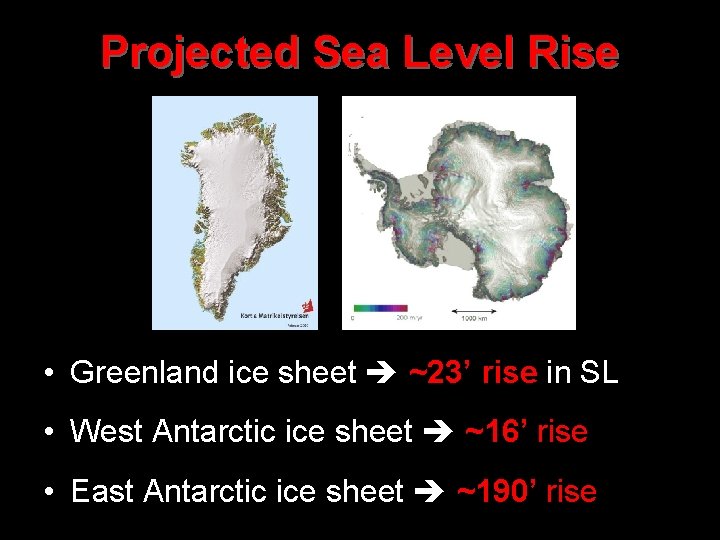
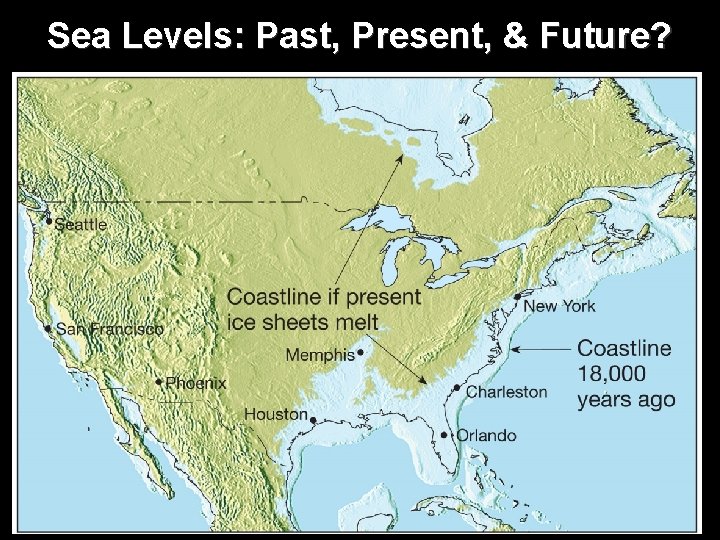
Projected Sea Level Rise • Greenland ice sheet ~23’ rise in SL • West Antarctic ice sheet ~16’ rise • East Antarctic ice sheet ~190’ rise
Sea Levels: Past, Present, & Future?
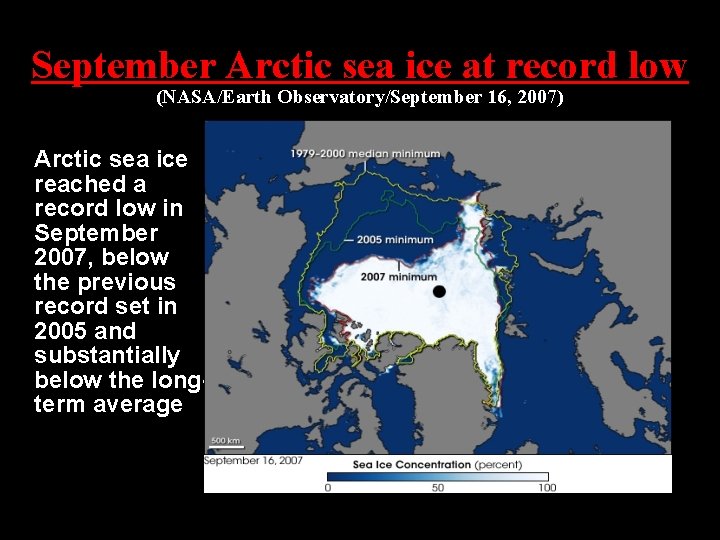
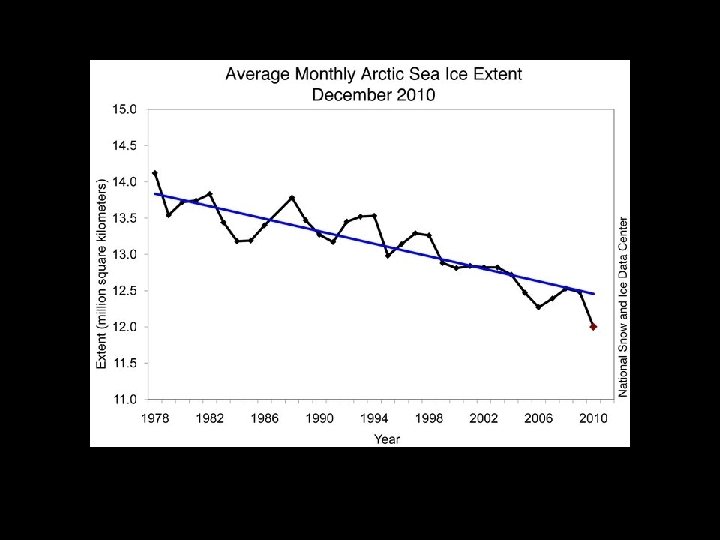
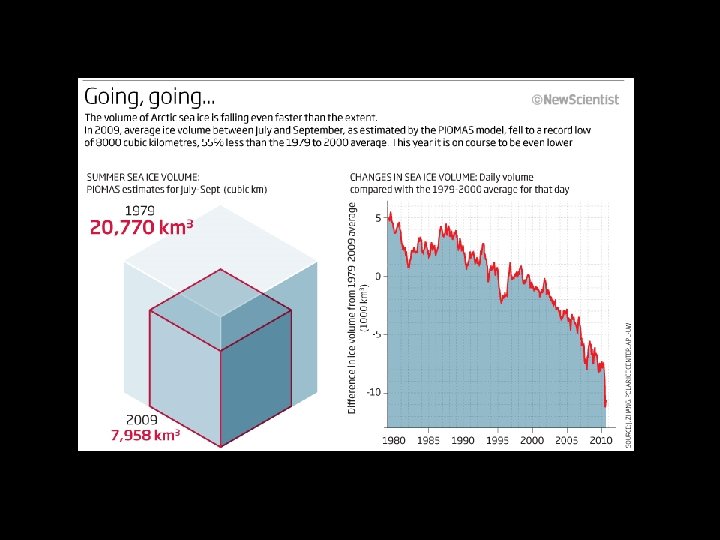
September Arctic sea ice at record low (NASA/Earth Observatory/September 16, 2007) Arctic sea ice reached a record low in September 2007, below the previous record set in 2005 and substantially below the longterm average
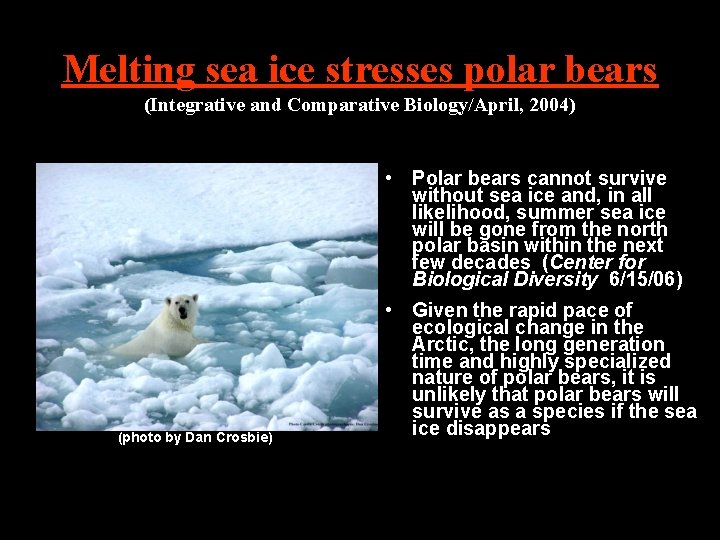
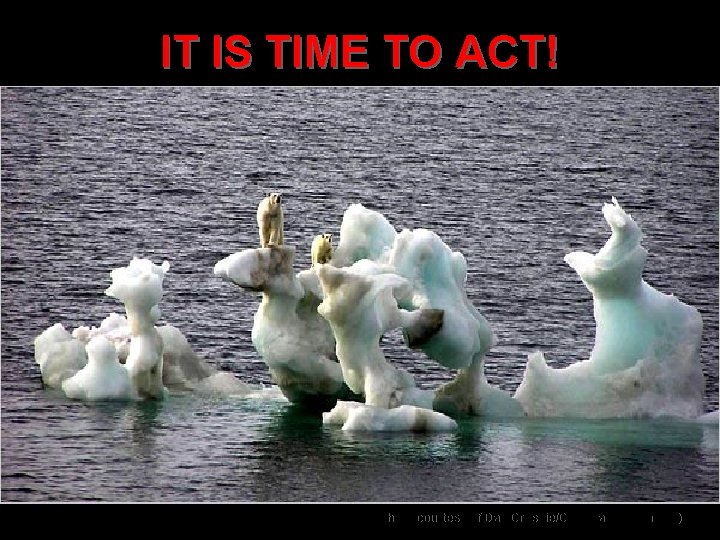
Melting sea ice stresses polar bears (Integrative and Comparative Biology/April, 2004) • Polar bears cannot survive without sea ice and, in all likelihood, summer sea ice will be gone from the north polar basin within the next few decades (Center for Biological Diversity 6/15/06) (photo by Dan Crosbie) • Given the rapid pace of ecological change in the Arctic, the long generation time and highly specialized nature of polar bears, it is unlikely that polar bears will survive as a species if the sea ice disappears
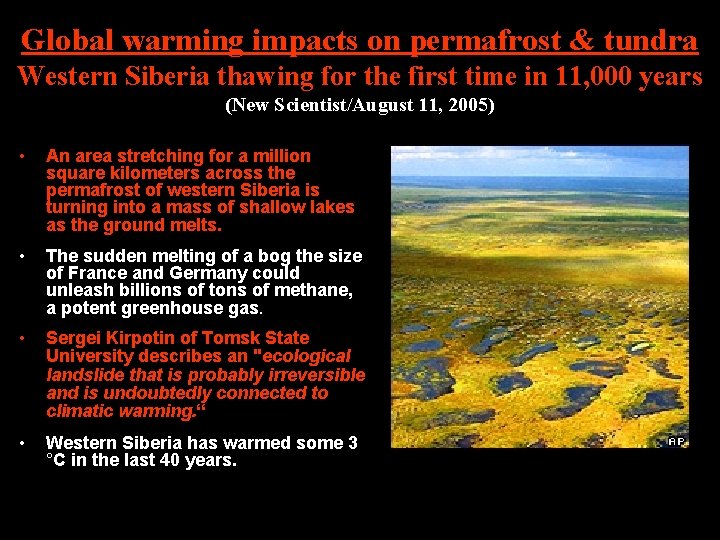
Global warming impacts on permafrost & tundra Western Siberia thawing for the first time in 11, 000 years (New Scientist/August 11, 2005) • An area stretching for a million square kilometers across the permafrost of western Siberia is turning into a mass of shallow lakes as the ground melts. • The sudden melting of a bog the size of France and Germany could unleash billions of tons of methane, a potent greenhouse gas. • Sergei Kirpotin of Tomsk State University describes an "ecological landslide that is probably irreversible and is undoubtedly connected to climatic warming. “ • Western Siberia has warmed some 3 °C in the last 40 years. (photo courtesy of BBC News)
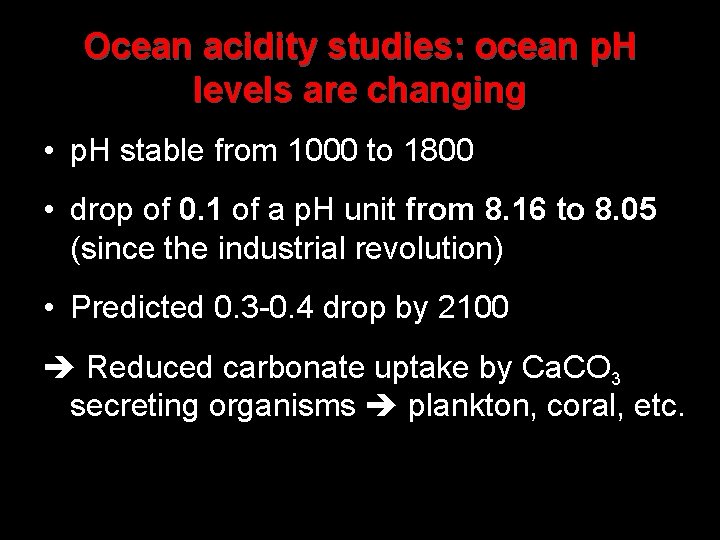
Ocean acidity studies: ocean p. H levels are changing • p. H stable from 1000 to 1800 • drop of 0. 1 of a p. H unit from 8. 16 to 8. 05 (since the industrial revolution) • Predicted 0. 3 -0. 4 drop by 2100 Reduced carbonate uptake by Ca. CO 3 secreting organisms plankton, coral, etc.
Fig. 11 -34, p. 338
What if the scientists are wrong about global warming? We can afford to be wrong, we just can’t afford to be right and do nothing about it.
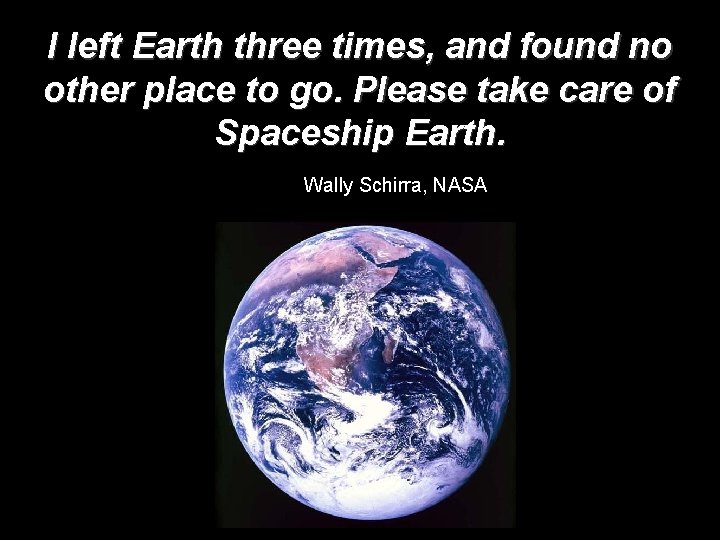
I left Earth three times, and found no other place to go. Please take care of Spaceship Earth. Wally Schirra, NASA
IT IS TIME TO ACT! (AP photo courtesy of Dan Crosbie/Canadian Ice Service)