DistanceTime Graphs Constant Reading Demonstration This resource provides


 in 60 minutes. How can we")
 in 30 minutes. How can we")


- Slides: 31
Distance-Time Graphs – Constant – Reading – Demonstration This resource provides animated demonstrations of the mathematical method. Check animations and delete slides not needed for your class.
Calculate the speed for each journey. The bike travels 80 miles in 2 hours. 40 mph The car travels 90 miles in 2 hours. 45 mph The plane travels 200 miles in 30 minutes. 400 mph In 3 hours the bike travels 180 miles. 60 mph In 3 hours the car travels 105 miles. 35 mph In 15 minutes the plane travels 120 miles. 480 mph In 10 hours the bike travels 450 km. 45 kmph In 12 hours the car travels 600 km. 50 kmph In 45 minutes the plane travels 240 km. 320 kmph The bike travels 40 miles in 30 minutes. 80 mph The car travels 40 miles in 40 minutes. 60 mph The plane travels 2 miles in 30 seconds. 240 mph
Jo, Jack and Jane have a race from London to Birmingham. Jack takes a train that can travel at 200 mph. Jo takes a plan that can travel at 800 mph. Jane takes a car that can travel at 140 mph. Who gets there first? Does it just depend on speed?
Dave drives from Albright to Buckton (60 kilometres) in 60 minutes. How can we graph this journey? 80 Buckton 70 60 Distance 50 from Albright 40 (km) 30 20 10 Albright 0 0 10 20 30 40 50 60 70 80 90 Time (minutes) The graph shows the car’s position relative to time: After 40 minutes it had travelled 40 kilometres.
Kelly drives from Albright to Buckton (60 kilometres) in 30 minutes. How can we graph this journey? 80 Buckton 60 km in 30 minutes = 120 kmph 70 60 km in 1 hour = 60 kmph 60 Distance 50 from Albright 40 (km) 30 20 10 Albright 0 0 10 20 30 40 50 60 70 80 90 Time (minutes) Kelly went the same distance in less time. How fast did both cars travel?
If we don’t know the distance or time, how do we know which car was faster? The cars travelled the same distance, but one took less time. Distance from Albright (km) Time (minutes) A greater gradient (steeper line) means a faster speed.
Tim drives from Albright to Buckton. How can we describe the journey? 80 Buckton 70 60 Distance 50 from Albright 40 (km) 30 20 He stopped for 20 minutes. The car was stationary. 10 Albright 0 0 10 20 30 40 50 60 70 80 90 Time (minutes)
Shelly takes a drive from Albright. How can we describe the journey? 80 Buckton 70 Stationary for 10 minutes. 60 Distance 50 from Albright 40 (km) 30 20 10 Albright 0 0 10 20 30 40 50 60 70 80 90 Time (minutes) Went back home.
5 brothers all went to the same school. Which graph describes each brother’s journey to school? Distance from home Andy started walking to school but he felt ill & went home. Burt cycled to school. Time Distance from home Charlie walked to his friend’s house to play a computer game before walking with his friend. Dave started walking but he had forgotten his pencil case! He ran home & then walked quickly to school. Distance from home Time Evan started walking. He realised he was going to be late so started running! Distance from home Time
A car was driving from France to Switzerland. It went off a cliff! 80 70 60 Distance 50 from start 40 (km) 30 20 What’s confused Tom? 10 0 0 10 20 30 40 50 60 70 80 90 Time (minutes)
2 cars drove from Southampton to Portsmouth & back. What’s the same & what’s different about these two graphs of the journeys? Distance-Time graphs can represent distance from a point or total distance travelled.
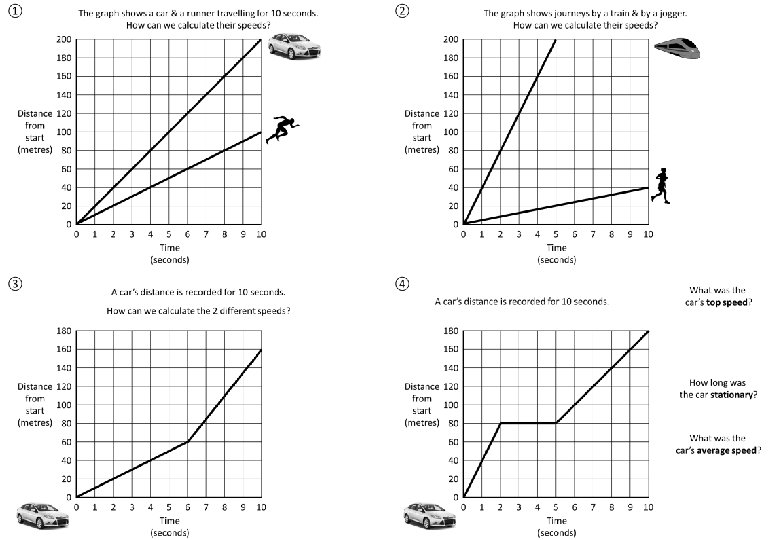
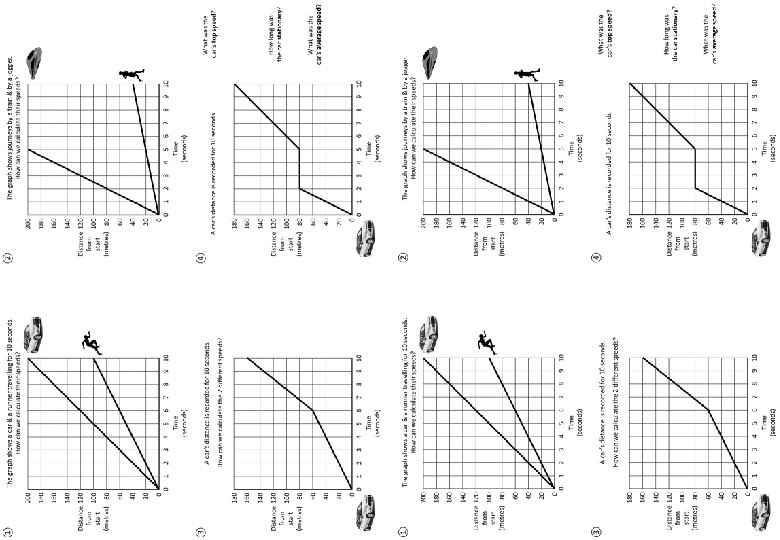
① The graph shows a car & a runner travelling for 10 seconds. How can we calculate their speeds? 200 180 Distance = 200 m Time = 10 s Speed = 200 ÷ 10 = 20 m/s 160 140 Distance 120 from 100 start (metres) 80 Distance = 100 m Time = 10 s Speed = 100 ÷ 10 = 10 m/s 60 40 20 0 0 1 2 3 A steeper line (greater gradient) = greater speed. 4 5 6 Time (seconds) 7 8 9 10 Speed = Distance Time
② The graph shows journeys by a train & by a jogger. How can we calculate their speeds? 200 180 Distance = 200 m Time = 5 s Speed = 200 ÷ 5 = 40 m/s 160 140 Distance 120 from 100 start (metres) 80 Distance = 40 m Time = 10 s Speed = 40 ÷ 10 = 4 m/s 60 40 20 0 0 1 2 3 A steeper line (greater gradient) = greater speed. 4 5 6 Time (seconds) 7 8 9 10 Speed = Distance Time
③ A car’s distance is recorded for 10 seconds. How can we calculate the 2 different speeds? ① Distance = 60 m 180 Time = 6 s Speed = 60 ÷ 6 = 10 m/s 160 140 Distance 120 from 100 start (metres) 80 100 m ② ② Distance = 100 m 60 40 ① 20 0 Time = 4 s Speed = 100 ÷ 4 = 25 m/s 4 s 60 m 6 s 0 1 2 3 A steeper line (greater gradient) = greater speed. 4 5 6 Time (seconds) 7 8 9 10 Speed = Distance Time
A car’s distance is recorded for 10 seconds. How can we calculate the average speed? 180 160 Distance = 160 m Time = 10 s Speed = 160 ÷ 10 = 16 m/s 140 Distance 120 from 100 start (metres) 80 60 40 20 0 0 1 2 3 4 5 6 Time (seconds) 7 8 9 10 Speed = Distance Time
④ What was the car’s top speed? A car’s distance is recorded for 10 seconds. Speed = 80 ÷ 2 = 40 m/s 180 160 Speed = 100 ÷ 5 = 20 m/s 140 20 m/s 3 s 3 seconds 5 s 60 What was the car’s average speed ? 80 m 40 20 0 How long was the car stationary? 100 m Distance 120 from 100 start (metres) 80 2 s 0 1 Speed = 180 ÷ 10 = 18 m/s 40 m/s 2 3 4 5 6 Time (seconds) 7 8 9 10 Speed = Distance Time
When something is travelling at a constant speed , How fast is the cyclist travelling? distance & time are in a directly proportional relationship. How far will they travel in 3 hours? They both increase & decrease at the same rates. ÷ 2 × 3 Time Distance 2 hours 30 1 hour 15 3 hours 45 ÷ 2 × 3
When something is travelling at a constant speed , distance & time are in a directly proportional relationship. If the cyclist continues at this speed, how far will they travel in 1 hour? They both increase at the same rate. × 2 Time Distance 30 minutes 20 1 hour 40 × 2 Or we can use the formula. 30 minutes = 0. 5 hours Speed = Distance Time Speed = 20 ÷ 0. 5 = 40 kmph If we divide by a number smaller than 1, the result will be larger.
When something is travelling at a constant speed , distance & time are in a directly proportional relationship. If the cyclist continues at this speed, how far will they travel in 1 hour? They both increase at the same rate. × 4 Time Distance 15 minutes 5 1 hour 20 × 4 Or we can use the formula. 15 minutes = 0. 25 hours Speed = Distance Time Speed = 5 ÷ 0. 25 = 20 kmph If we divide by a number smaller than 1, the result will be larger.
Calculate the 4 different speeds shown in this graph. 180 160 140 80 m ÷ 1 s = 80 m/s Distance 120 from 100 start (metres) 80 60 m ÷ 3 s = 20 m/s 60 40 20 m ÷ 2 s = 10 m/s 20 0 20 m ÷ 4 s = 5 m/s 0 1 2 The car is getting faster & faster, it is accelerating. 3 4 5 6 Time (seconds) 7 8 9 10 Speed = Distance Time
This distance time graph has different shapes. How could we describe each part of the graph? Deceleration Distance Travelled Deceleration (Decreasing speed) Stationary (No speed) Stationary Acceleration Constant Speed (Keeping the same speed) Acceleration (Increasing speed) Time Constant Speed
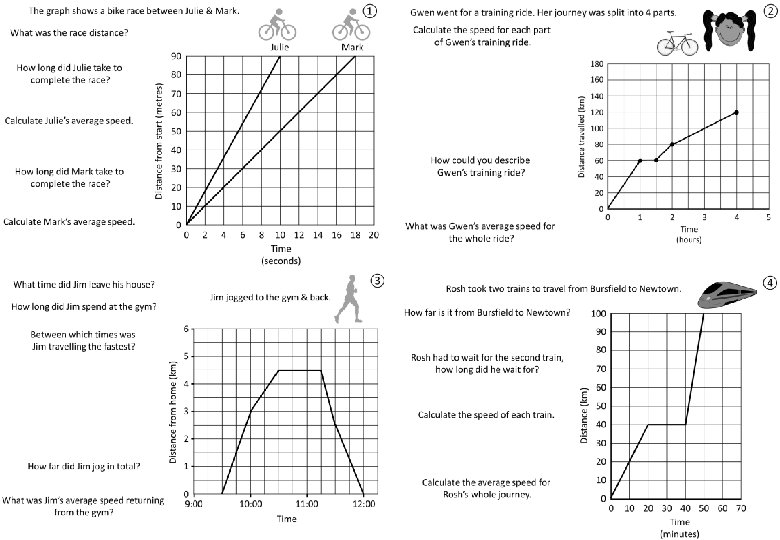
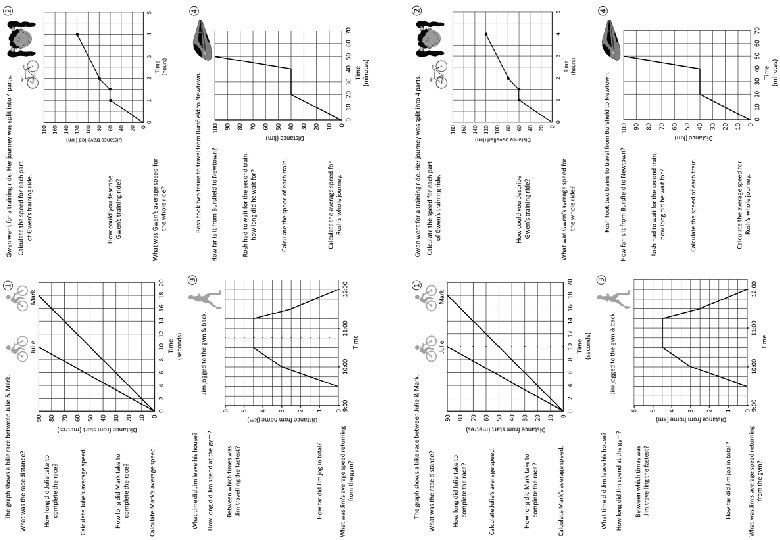
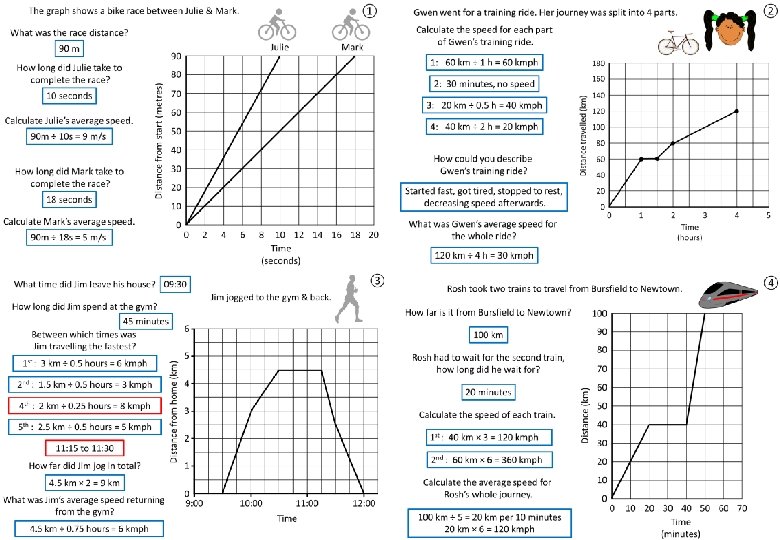
① The graph shows a bike race between Julie & Mark. What was the race distance? 90 m 10 seconds Calculate Julie’s average speed. 90 m ÷ 10 s = 9 m/s How long did Mark take to complete the race? 18 seconds Calculate Mark’s average speed. 90 m ÷ 18 s = 5 m/s 90 Mark 80 Distance from start (metres) How long did Julie take to complete the race? Julie 70 60 50 40 30 20 10 0 0 2 4 6 8 10 12 14 16 18 20 Time (seconds)
Gwen went for a training ride. Her journey was split into 4 parts. Calculate the speed for each part of Gwen’s training ride. 1: 60 km ÷ 1 h = 60 kmph 2: 30 minutes, no speed 3: 20 km ÷ 0. 5 h = 40 kmph 4: 40 km ÷ 2 h = 20 kmph How could you describe Gwen’s training ride? Started fast, got tired, stopped to rest, decreasing speed afterwards. What was Gwen’s average speed for the whole ride? 120 km ÷ 4 h = 30 kmph ②
③ What time did Jim leave his house? 09: 30 Jim jogged to the gym & back. How long did Jim spend at the gym? 1 st : 3 km ÷ 0. 5 hours = 6 kmph 2 nd : 1. 5 km ÷ 0. 5 hours = 3 kmph 4 th : 2 km ÷ 0. 25 hours = 8 kmph 5 th : 2. 5 km ÷ 0. 5 hours = 5 kmph 11: 15 to 11: 30 How far did Jim jog in total? 4. 5 km × 2 = 9 km What was Jim’s average speed returning from the gym? 4. 5 km ÷ 0. 75 hours = 6 kmph Distance from home (km) 45 minutes Between which times was Jim travelling the fastest? 6 5 4 3 2 1 0 9: 00 10: 00 11: 00 Time 12: 00
Rosh took two trains to travel from Bursfield to Newtown. How far is it from Bursfield to Newtown? 100 km 90 80 Rosh had to wait for the second train, how long did he wait for? Calculate the speed of each train. 1 st : 40 km × 3 = 120 kmph Distance (km) 20 minutes 70 60 50 40 30 2 nd : 60 km × 6 = 360 kmph 20 Calculate the average speed for Rosh’s whole journey. 10 100 km ÷ 5 = 20 km per 10 minutes 20 km × 6 = 120 kmph 0 0 10 20 30 40 50 60 70 Time (minutes) ④
Questions? Comments? Suggestions? …or have you found a mistake!? Any feedback would be appreciated . Please feel free to email: tom@goteachmaths. co. uk