Conversion Graphs Demonstration This resource provides animated demonstrations


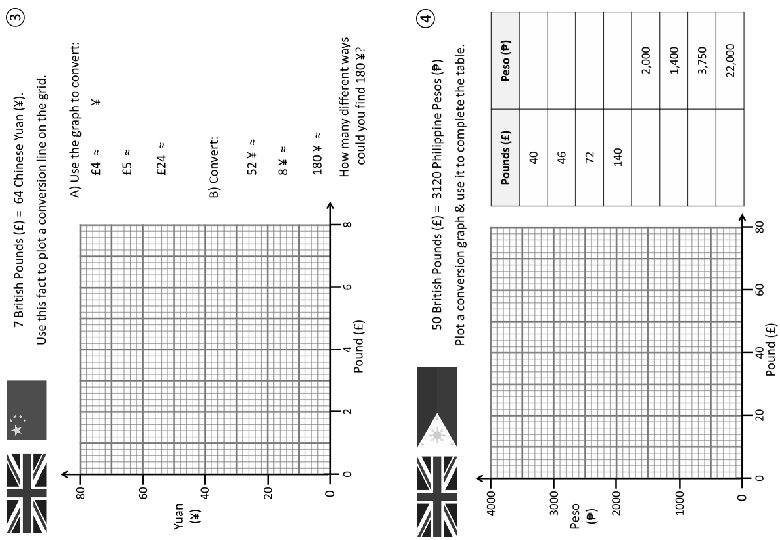
 = 64 Chinese Yuan (¥). Use this fact to plot")
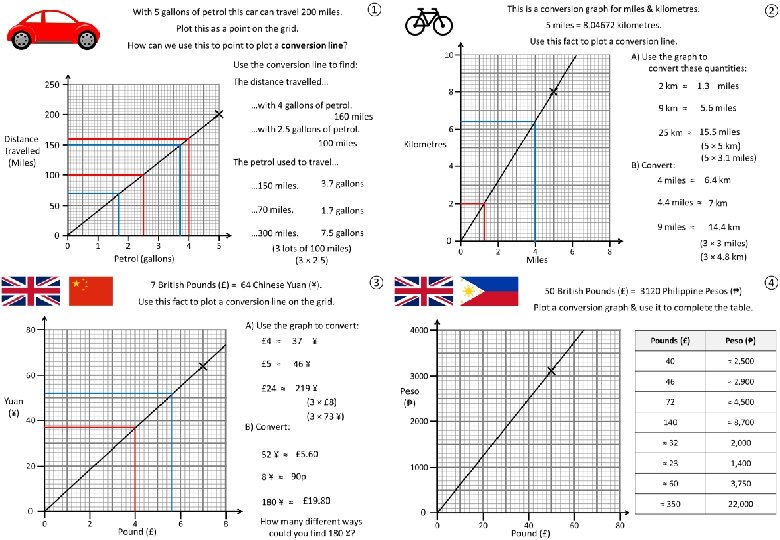
 = 3120 Philippine Pesos (₱) Plot a conversion graph &")

- Slides: 17
Conversion Graphs – Demonstration This resource provides animated demonstrations of the mathematical method. Check animations and delete slides not needed for your class.
Mary wanted to record how far she travelled with the petrol she bought every time she filled up. She bought 4 gallons & travelled 195 miles before she had to fill up again. What relationship do the points show? 250 More petrol = more distance Miles per Gallon (MPG) 200 Distance 150 Travelled (Miles) 100 The car manufacturer says the car gets 50 MPG. 50 We can plot this proportional relationship as a line. 0 Why are Mary’s points not exactly on the line? 0 1 2 3 4 Petrol bought (gallons) 5
A conversion graph shows us the relationship between two variables. We use conversion graphs to convert & estimate quantities. How far should the car travel… 250 …with 3 gallons of petrol? 200 150 miles …with 4. 5 gallons of petrol? 225 miles Distance 150 Travelled (Miles) 100 If someone drove 75 miles, how much petrol would they use? 1. 5 gallons 50 0 If someone drove 400 miles, how much petrol would they use? 0 1 2 3 4 Petrol bought (gallons) 5 200 miles = 4 gallons 400 miles = 8 gallons
This conversion graphs shows the MPG for a large car. Same distance, less petrol Where might the line be for…. 250 200 Distance 150 Travelled (Miles) 100 A smaller car 50 0 Same amount of petrol, less distance 0 1 2 3 4 Petrol bought (gallons) 5 A race car
The conversion graph shows the MPG of a standard car How far should the car travel with 16 gallons of petrol? 250 “Convert 1 gallon to distance & multiply by 16” 200 Distance 150 Travelled (Miles) 100 “Convert 2 gallons to distance & multiply by 8” “Convert 4 gallons to distance & multiply by 4” 50 0 0 1 2 3 Petrol (gallons) 4 5 Which method is more accurate?
The conversion graph shows the MPG of a standard car “Convert 100 miles to gallons & multiply by 4. 5” How much petrol does the car need to travel 450 miles? 250 “Convert 200 miles to gallons, convert 250 miles to gallons & add together” 200 Distance 150 Travelled (Miles) 100 “Convert 45 miles to gallons & multiply by 10” 50 0 0 1 2 3 Petrol (gallons) 4 5 Do all these methods work? Which is easiest? Which is most accurate?
What pairs of variables could be plotted on a conversion graph? Fahrenheit Dollars Study Time Kilometres Results Cost Litres Gallons Distance Pounds Miles Petrol Celsius Euros Area Quantity Kilograms Paint
What pairs of variables could be plotted on a conversion graph? Some combinations. Fahrenheit Cost Celsius Quantity Kilometres Petrol Distance Miles Study Time Results Gallons Paint Area Pounds Euros Dollars Kilograms Litres
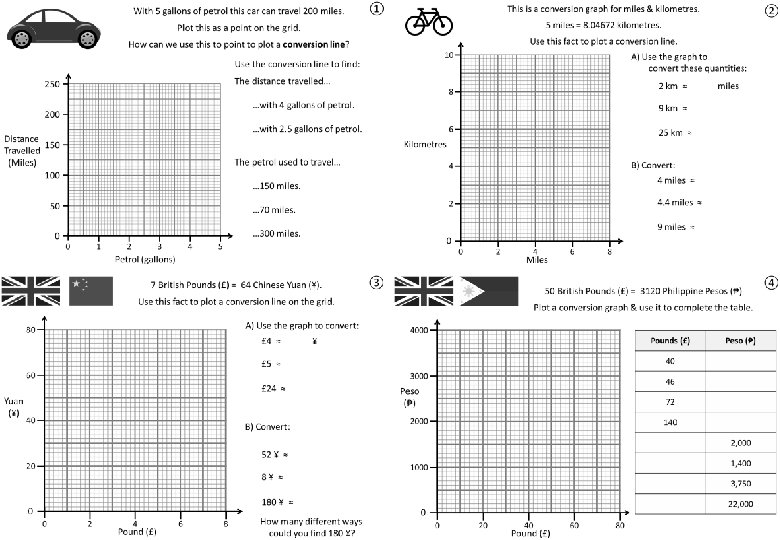
With 5 gallons of petrol this car can travel 200 miles. ① Plot this as a point on the grid. How can we use this to point to plot a conversion line? Use the conversion line to find: The distance travelled… 250 …with 4 gallons of petrol. 160 miles …with 2. 5 gallons of petrol. 100 miles 200 Distance 150 Travelled (Miles) 100 The petrol used to travel… … 150 miles. 3. 7 gallons 50 … 70 miles. 1. 7 gallons 0 … 300 miles. 7. 5 gallons 0 1 2 3 Petrol (gallons) 4 5 (3 lots of 100 miles) (3 × 2. 5)
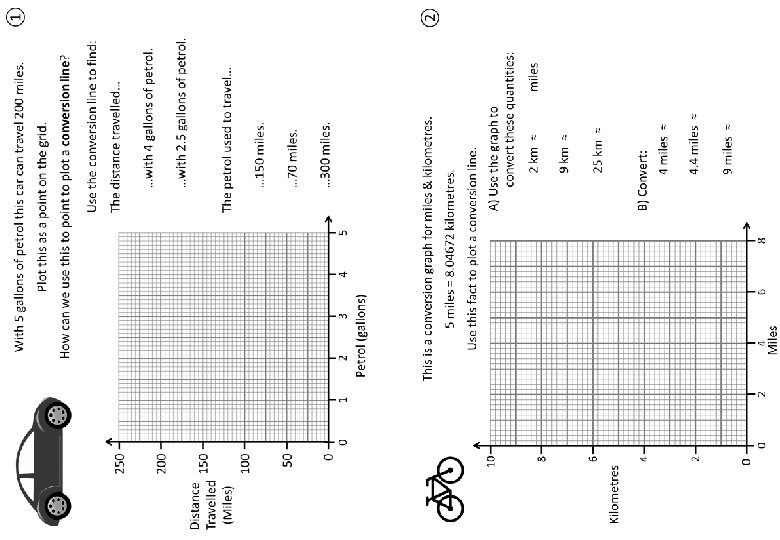
This is a conversion graph for miles & kilometres. ② 5 miles = 8. 04672 kilometres. Use this fact to plot a conversion line. 10 A) Use the graph to convert these quantities: 8 6 2 km ≈ 1. 3 miles 9 km ≈ 5. 6 miles 25 km ≈ 15. 5 miles (5 × 5 km) (5 × 3. 1 miles) B) Convert: Kilometres 4 4 miles ≈ 4. 4 miles ≈ 7 km 2 9 miles ≈ 0 6. 4 km 0 2 4 Miles 6 8 14. 4 km (3 × 3 miles) (3 × 4. 8 km)
7 British Pounds (£) = 64 Chinese Yuan (¥). Use this fact to plot a conversion line on the grid. A) Use the graph to convert: 80 £ 4 ≈ 37 £ 5 ≈ 46 ¥ ¥ 60 Yuan (¥) £ 24 ≈ 219 ¥ (3 × £ 8) (3 × 73 ¥) B) Convert: 40 52 ¥ ≈ £ 5. 60 20 8 ¥ ≈ 90 p 180 ¥ ≈ £ 19. 80 0 0 2 4 Pound (£) 6 8 How many different ways could you find 180 ¥? ③
50 British Pounds (£) = 3120 Philippine Pesos (₱) Plot a conversion graph & use it to complete the table. 4000 3000 Peso (₱) 2000 1000 0 0 20 40 Pound (£) 60 80 Pounds (£) Peso (₱) 40 ≈ 2, 500 46 ≈ 2, 900 72 ≈ 4, 500 140 ≈ 8, 700 ≈ 32 2, 000 ≈ 23 1, 400 ≈ 60 3, 750 ≈ 350 22, 000 ④
Questions? Comments? Suggestions? …or have you found a mistake!? Any feedback would be appreciated . Please feel free to email: tom@goteachmaths. co. uk