DistanceTime Graphs Constant Card Complete Match In this


 A 8 7 6 5 4 3 2 1 0 0")
 B 8 7 6 5 4 3 2 1 0 0")
 C 8 7 6 5 4 3 2 1 0 0")
 D 8 7 6 5 4 3 2 1 0 0")
 E 8 7 6 5 4 3 2 1 0 0")
 F 8 7 6 5 4 3 2 1 0 0")
 G 8 7 6 5 4 3 2 1 0 0")
 H 8 7 6 5 4 3 2 1 0 0")

- Slides: 16
Distance-Time Graphs – Constant – Card Complete & Match In this activity students work individually or in groups to match questions and answers. ‘Quick Cut’ – Choose the questions/slides you wish to use and delete others. Sets of questions can then be easily guillotined to save time. One-sheet sets of cards are also included for students to cut out themselves.
Printing To print handouts from slides Select the slide from the left. Then click: File > Print > ‘Print Current Slide’ To print multiple slides Click on a section title to highlight all those slides, or press ‘Ctrl’ at the same time as selecting slides to highlight more than one. Then click: File > Print > ‘Print Selection’ To print double-sided handouts Highlight both slides before using ‘Print Selection’. Choose ‘Print on Both Sides’ and ‘Flip on Short Edge’.
Match each Distance-Time Graph with a description and complete! Which story could this graph match with?
Half Answers
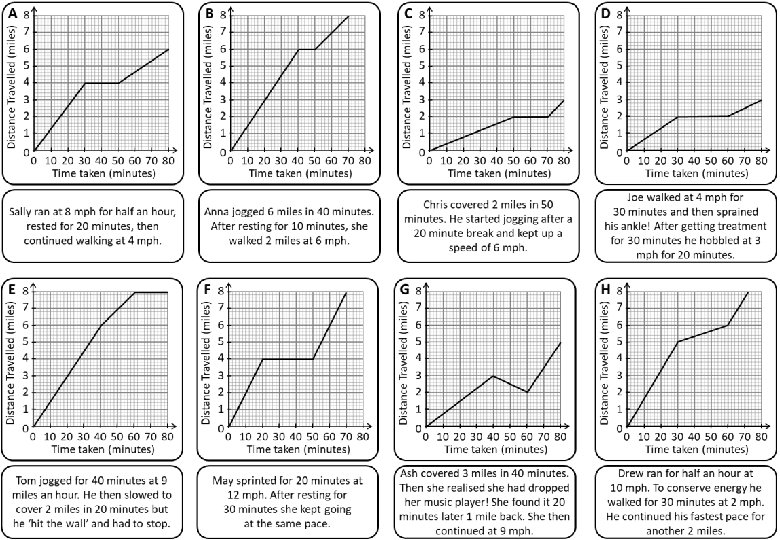
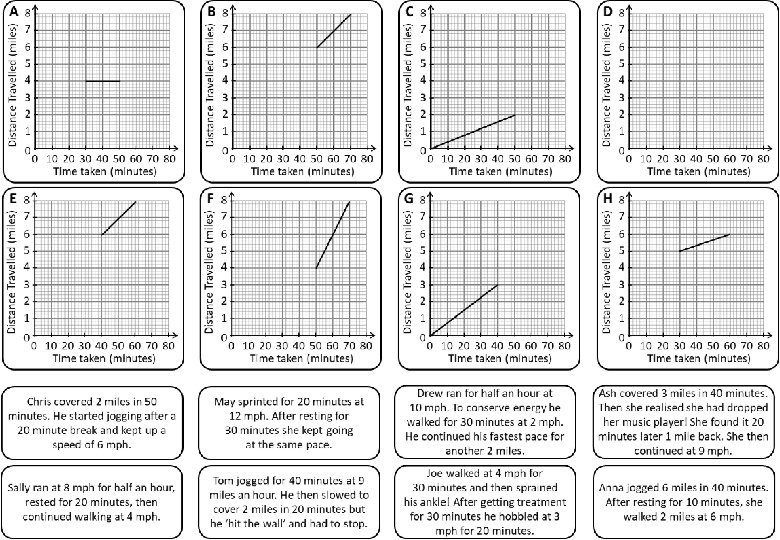
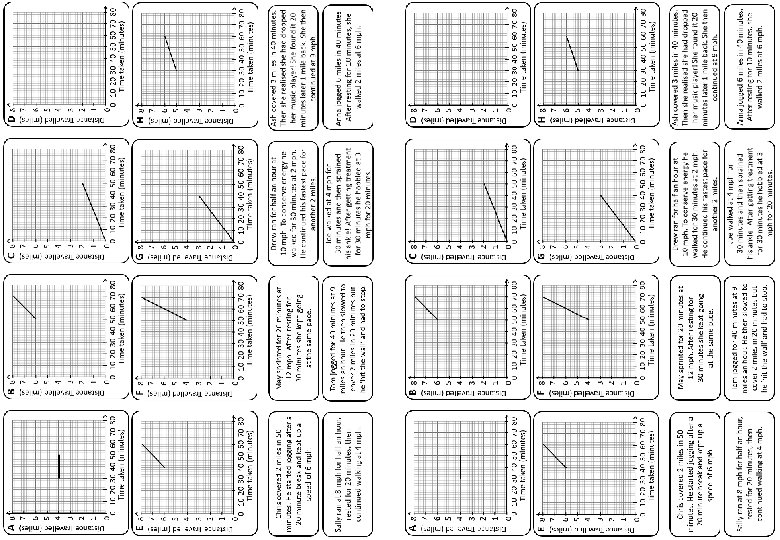
Distance Travelled (miles) A 8 7 6 5 4 3 2 1 0 0 10 20 30 40 50 60 70 80 Time taken (minutes) Sally ran at 8 mph for half an hour, rested for 20 minutes, then continued walking at 4 mph.
Distance Travelled (miles) B 8 7 6 5 4 3 2 1 0 0 10 20 30 40 50 60 70 80 Time taken (minutes) Anna jogged 6 miles in 40 minutes. After resting for 10 minutes, she walked 2 miles at 6 mph.
Distance Travelled (miles) C 8 7 6 5 4 3 2 1 0 0 10 20 30 40 50 60 70 80 Time taken (minutes) Chris covered 2 miles in 50 minutes. He started jogging after a 20 minute break and kept up a speed of 6 mph.
Distance Travelled (miles) D 8 7 6 5 4 3 2 1 0 0 10 20 30 40 50 60 70 80 Time taken (minutes) Joe walked at 4 mph for 30 minutes and then sprained his ankle! After getting treatment for 30 minutes he hobbled at 3 mph for 20 minutes.
Distance Travelled (miles) E 8 7 6 5 4 3 2 1 0 0 10 20 30 40 50 60 70 80 Time taken (minutes) Tom jogged for 40 minutes at 9 miles an hour. He then slowed to cover 2 miles in 20 minutes but he ‘hit the wall’ and had to stop.
Distance Travelled (miles) F 8 7 6 5 4 3 2 1 0 0 10 20 30 40 50 60 70 80 Time taken (minutes) May sprinted for 20 minutes at 12 mph. After resting for 30 minutes she kept going at the same pace.
Distance Travelled (miles) G 8 7 6 5 4 3 2 1 0 0 10 20 30 40 50 60 70 80 Time taken (minutes) Ash covered 3 miles in 40 minutes. Then she realised she had dropped her music player! She found it 20 minutes later 1 mile back. She then continued at 9 mph.
Distance Travelled (miles) H 8 7 6 5 4 3 2 1 0 0 10 20 30 40 50 60 70 80 Time taken (minutes) Drew ran for half an hour at 10 mph. To conserve energy he walked for 30 minutes at 2 mph. He continued his fastest pace for another 2 miles.
Questions? Comments? Suggestions? …or have you found a mistake!? Any feedback would be appreciated . Please feel free to email: tom@goteachmaths. co. uk