Discrete Multivariate Analysis of Multivariate Categorical Data References

, Analysis of Cross-Classified Data , MIT Press, Cambridge, Mass.")


![Hierarchical Log-linear models for 3 way table Model [1][2][3] [1][23] [2][13] [3][12][13] [12][23] [13][23]](https://slidetodoc.com/presentation_image_h2/973655823abaee858350ba72b1e90405/image-8.jpg "Hierarchical Log-linear models for 3 way table Model [1][2][3] [1][23] [2][13] [3][12][13] [12][23] [13][23]")


 Serum Cholesterol (C) Coronary Heart Disease (H)")

![Model 1: [BH][CH] Log-linear parameters Heart disease -Blood Pressure Interaction](https://slidetodoc.com/presentation_image_h2/973655823abaee858350ba72b1e90405/image-24.jpg "Model 1: [BH][CH] Log-linear parameters Heart disease -Blood Pressure Interaction")


![Model 2: [BC][BH][CH] Log-linear parameters Blood pressure-Cholesterol interaction:](https://slidetodoc.com/presentation_image_h2/973655823abaee858350ba72b1e90405/image-28.jpg "Model 2: [BC][BH][CH] Log-linear parameters Blood pressure-Cholesterol interaction:")


![Fitting various log-linear models Simplest model that fits is: [Apt, Ed][Occ, Ed] This model](https://slidetodoc.com/presentation_image_h2/973655823abaee858350ba72b1e90405/image-40.jpg "Fitting various log-linear models Simplest model that fits is: [Apt, Ed][Occ, Ed] This model")

")

")

- Slides: 45
Discrete Multivariate Analysis of Multivariate Categorical Data
References 1. Fienberg, S. (1980), Analysis of Cross-Classified Data , MIT Press, Cambridge, Mass. 2. Fingelton, B. (1984), Models for Category Counts , Cambridge University Press. 3. Alan Agresti (1990) Categorical Data Analysis, Wiley, New York.
Log Linear Model
Two-way table where Note: X and Y are independent if In this case the log-linear model becomes
Three-way Frequency Tables
Log-Linear model for three-way tables Let mijk denote the expected frequency in cell (i, j, k) of the table then in general where
Hierarchical Log-linear models for categorical Data For three way tables The hierarchical principle: If an interaction is in the model, also keep lower order interactions and main effects associated with that interaction
Hierarchical Log-linear models for 3 way table Model [1][2][3] [1][23] [2][13] [3][12][13] [12][23] [13][23] [12][13] [23] [123] Description Mutual independence between all three variables. Independence of Variable 1 with variables 2 and 3. Independence of Variable 2 with variables 1 and 3. Independence of Variable 3 with variables 1 and 2. Conditional independence between variables 2 and 3 given variable 1. Conditional independence between variables 1 and 3 given variable 2. Conditional independence between variables 1 and 2 given variable 3. Pairwise relations among all three variables, with each two variable interaction unaffected by the value of the third variable.
Maximum Likelihood Estimation Log-Linear Model
For any Model it is possible to determine the maximum Likelihood Estimators of the parameters Example Two-way table – independence – multinomial model or
Log-likelihood where With the model of independence
and with also
Let Now
Since
Now or
Hence and Similarly Finally
Hence Now and
Hence Note or
Comments • Maximum Likelihood estimates can be computed for any hierarchical log linear model (i. e. more than 2 variables) • In certain situations the equations need to be solved numerically • For the saturated model (all interactions and main effects)
Goodness of Fit Statistics These statistics can be used to check if a log-linear model will fit the observed frequency table
Goodness of Fit Statistics The Chi-squared statistic The Likelihood Ratio statistic: d. f. = # cells - # parameters fitted We reject the model if c 2 or G 2 is greater than
Example: Variables 1. Systolic Blood Pressure (B) Serum Cholesterol (C) Coronary Heart Disease (H)
Goodness of fit testing of Models MODEL ----B, C, H. B, CH. C, BH. H, BC. BC, BH. BH, CH. CH, BC. BC, BH, CH. DF -24 21 21 15 12 18 12 9 LIKELIHOODRATIO CHISQ -----83. 15 51. 23 59. 59 58. 73 35. 16 27. 67 26. 80 8. 08 PROB. ------0. 0000 0. 0002 0. 0000 0. 0004 0. 0673 0. 0082 0. 5265 PEARSON CHISQ ------102. 00 56. 89 60. 43 64. 78 33. 76 26. 58 33. 18 6. 56 PROB. ------0. 0000 0. 0007 0. 0872 0. 0009 0. 6824 Possible Models: 1. [BH][CH] – B and C independent given H. 2. [BC][BH][CH] – all two factor interaction model n. s.
Model 1: [BH][CH] Log-linear parameters Heart disease -Blood Pressure Interaction
Multiplicative effect Log-Linear Model
Heart Disease - Cholesterol Interaction
Multiplicative effect
Model 2: [BC][BH][CH] Log-linear parameters Blood pressure-Cholesterol interaction:
Multiplicative effect
Heart disease -Blood Pressure Interaction
Multiplicative effect
Heart Disease - Cholesterol Interaction
Multiplicative effect
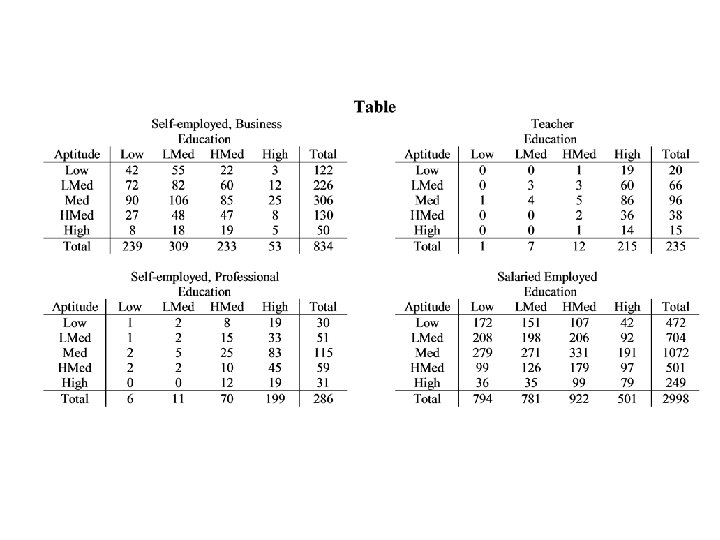
Another Example In this study it was determined for N = 4353 males 1. Occupation category 2. Educational Level 3. Academic Aptidude
1. Occupation categories a. b. c. d. Self-employed Business TeacherEducation Self-employed Professional Salaried Employed 2. Education levels a. b. c. d. e. Low/Med High/Med High
3. Academic Aptitude a. b. c. d. Low/Med High
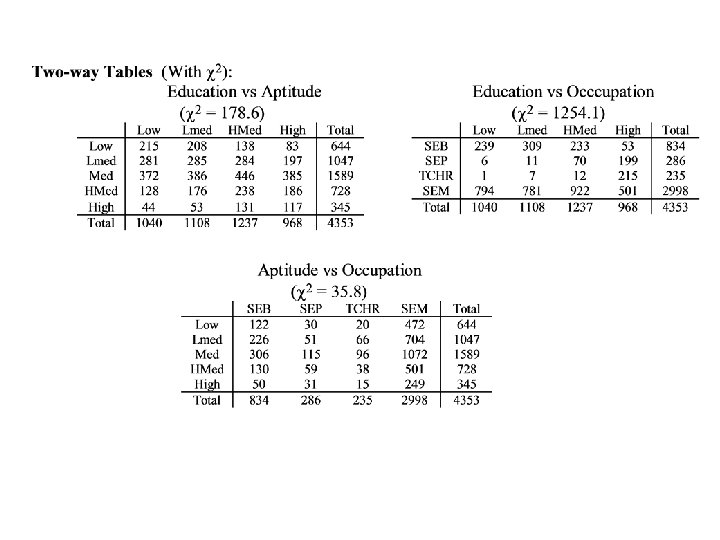
• It is common to handle a Multiway table by testing for independence in all two way tables. • This is similar to looking at all the bivariate correlations • In this example we learn that: 1. Education is related to Aptitude 2. Education is related to Occupational category 3. Education is related to Aptitude Can we do better than this?
Fitting various log-linear models Simplest model that fits is: [Apt, Ed][Occ, Ed] This model implies conditional independence between Aptitude and Occupation given Education.
Log-linear Parameters Aptitude – Education Interaction
Aptitude – Education Interaction (Multiplicative)
Occupation – Education Interaction
Occupation – Education Interaction (Multiplicative)
Next topic: Conditional test Statistics