Categorical Data Analysis Categorical data arise whenever counts

 are made. Subjects (sample items)")


")

)")


- Slides: 20
Categorical Data Analysis
Categorical data arise whenever counts (as opposed to measurements) are made. Subjects (sample items) are classified as belonging to one of a set of categories and the numbers in the categories (the frequencies) are recorded.
Example Eye colours: eye colours of males visiting an optician, in four categories Colour Frequency observed A 89 B 66 C D 60 85
Example Tonsils: Relationship between nasal carrier status for Streptococcus pyogenes and size of tonsils among 1398 children aged 0 -15 years. Normal Enlarg Much Total ed enlarged Carriers 19 29 24 72 Noncarriers 497 560 269 1326 516 589 293 1398 Total
Example Prussian cavalry deaths: numbers of cavalry soldiers killed by horsekicks in each of 14 units of the Prussian army over a 20 -year period (1875 -1894). Number killed Frequency observed 0 1 2 3 4 5 Total 144 91 32 11 2 0 280
Often we wish to decide whether the categorical variables follow some well known distribution A chi-squared test will provide a method of testing the hypothesis that a data set follows a particular distribution.
Often we wish to decide whether the categorical variables follow some well known distribution A chi-squared test will provide a method of testing the hypothesis that a data set follows a particular distribution. It works by summing the quantity (Observed – Expected)2/Expected
The chi-squared test in the R program is fairly limited – it copes well with testing whethere is a significant relationship between nasal carrier status for Streptococcus pyogenes and size of tonsils among 1398 children aged 0 -15 years (as in the second example) but gives us a problem with the other two.
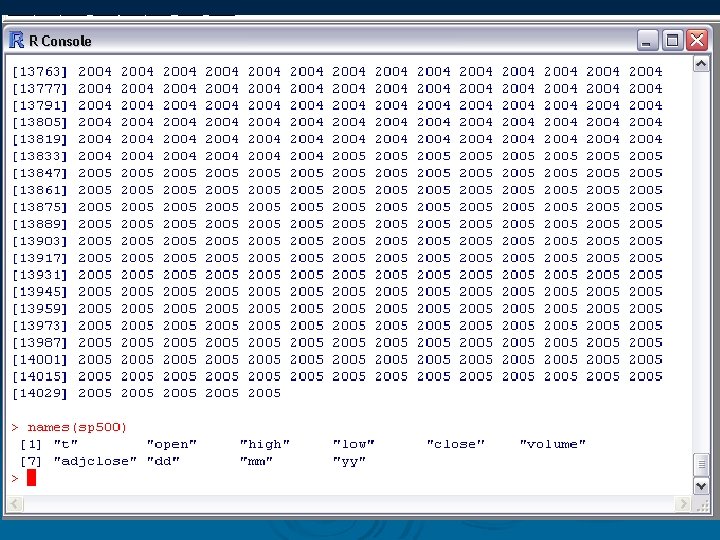
Consider now data from Standard and Poor’s 500 - an index of 500 of the largest, most actively traded stocks on the New York Stock Exchange These data are available in R as sp 500. R from the module website.
Technique: To look at any one of the variables in a data frame such as sp. 500, the $ sign is helpful. Without attaching the data, typing “adjclose” produces nothing.
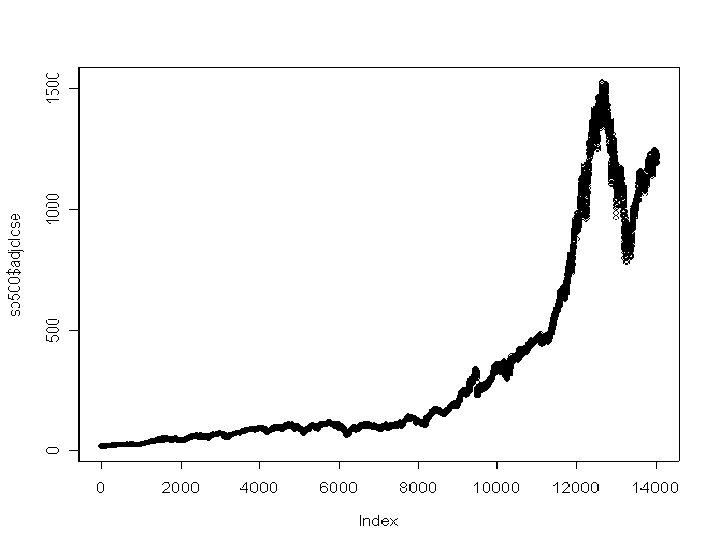
Instead use >sp 500$adjclose or >plot(sp 500$adjclose)
We are interested in the distribution of the change in returns from day to day. We suspect that the logs of these changes may follow a normal distribution.
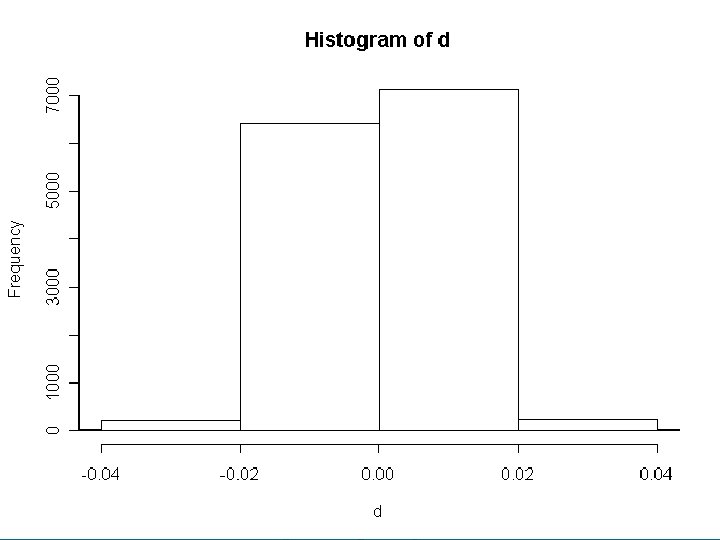
These are placed in an R vector by using the command >d=diff(log(sp 500$adjclose))
The chisq function that is pre-defined in R is not powerful enough to test the values of d to see if they conform to a normal distribution, so a program is written instead.
We wish to test whether a normal distribution with the same mean and standard deviation of d will look similar to this histogram. Calculate, for example, the approximate expected number between -0. 04 and -0. 02 by
This can be repeated and made more sophisticated with more than 4 comparisons by writing a program. The one considered has 100 comparisons.