CIS 371 Computer Organization and Design Unit 6
- Slides: 31

CIS 371 Computer Organization and Design Unit 6: Performance Metrics Based on slides by Profs. Amir Roth, Milo Martin, C. J. Taylor, Benedict Brown CIS 371: Comp. Org. | Dr. Joe Devietti | Performance 1

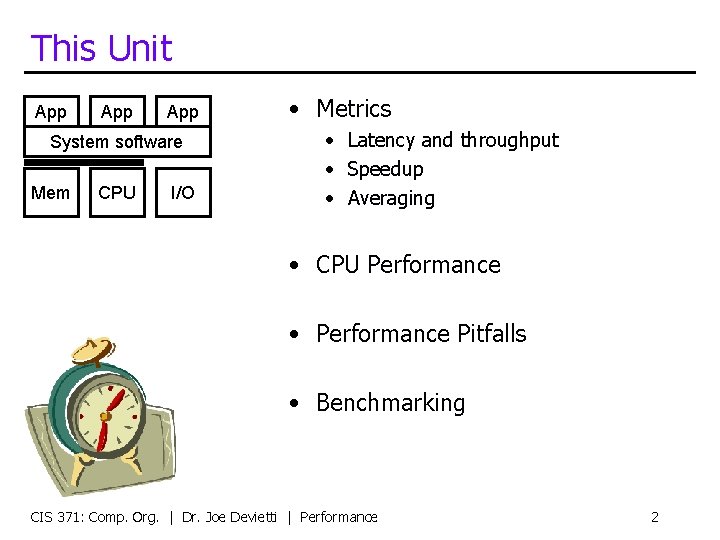
This Unit App App System software Mem CPU I/O • Metrics • Latency and throughput • Speedup • Averaging • CPU Performance • Performance Pitfalls • Benchmarking CIS 371: Comp. Org. | Dr. Joe Devietti | Performance 2

Readings • P&H • Revisit Chapter 1. 4, 1. 8, 1. 9 CIS 371: Comp. Org. | Dr. Joe Devietti | Performance 3

Reasoning About Performance CIS 371: Comp. Org. | Dr. Joe Devietti | Performance 4

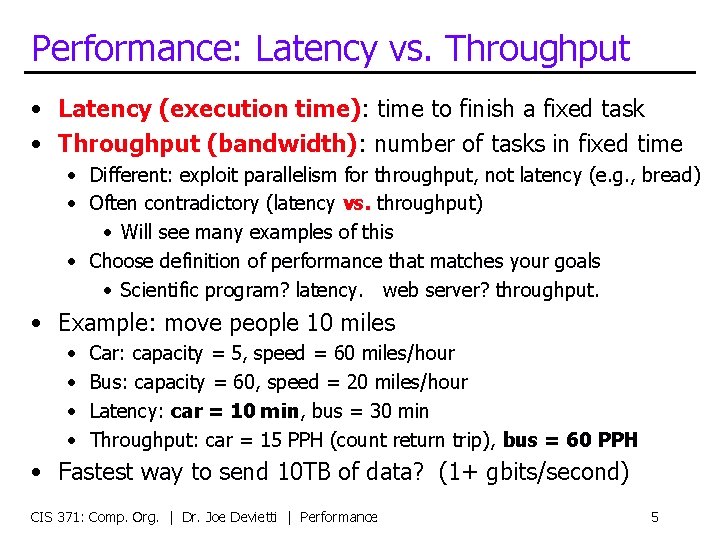
Performance: Latency vs. Throughput • Latency (execution time): time to finish a fixed task • Throughput (bandwidth): number of tasks in fixed time • Different: exploit parallelism for throughput, not latency (e. g. , bread) • Often contradictory (latency vs. throughput) • Will see many examples of this • Choose definition of performance that matches your goals • Scientific program? latency. web server? throughput. • Example: move people 10 miles • • Car: capacity = 5, speed = 60 miles/hour Bus: capacity = 60, speed = 20 miles/hour Latency: car = 10 min, bus = 30 min Throughput: car = 15 PPH (count return trip), bus = 60 PPH • Fastest way to send 10 TB of data? (1+ gbits/second) CIS 371: Comp. Org. | Dr. Joe Devietti | Performance 5

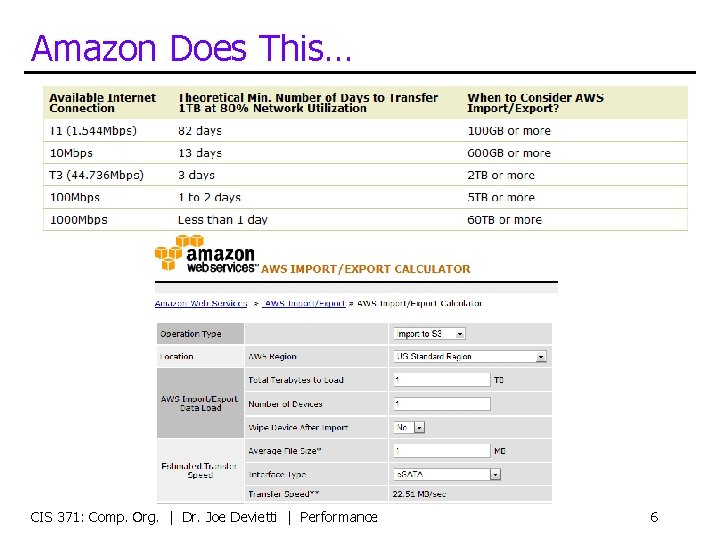
Amazon Does This… CIS 371: Comp. Org. | Dr. Joe Devietti | Performance 6

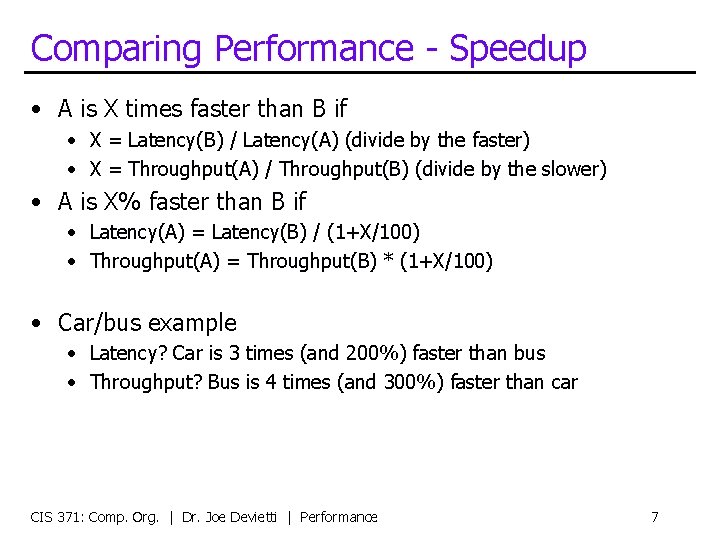
Comparing Performance - Speedup • A is X times faster than B if • X = Latency(B) / Latency(A) (divide by the faster) • X = Throughput(A) / Throughput(B) (divide by the slower) • A is X% faster than B if • Latency(A) = Latency(B) / (1+X/100) • Throughput(A) = Throughput(B) * (1+X/100) • Car/bus example • Latency? Car is 3 times (and 200%) faster than bus • Throughput? Bus is 4 times (and 300%) faster than car CIS 371: Comp. Org. | Dr. Joe Devietti | Performance 7

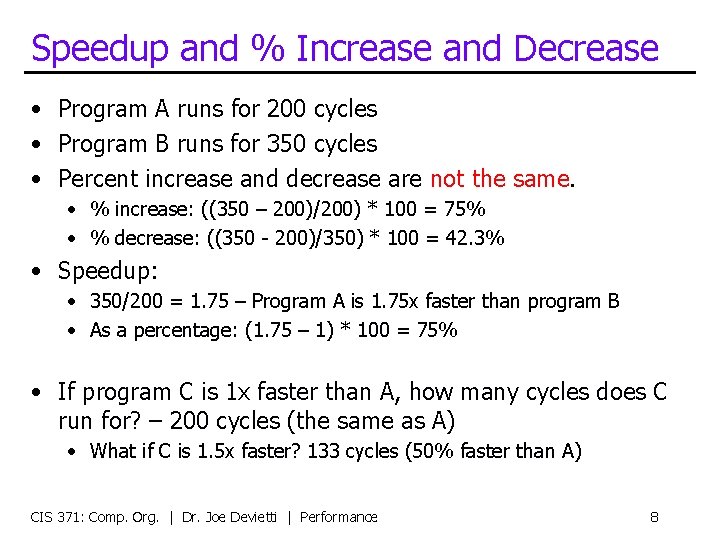
Speedup and % Increase and Decrease • Program A runs for 200 cycles • Program B runs for 350 cycles • Percent increase and decrease are not the same. • % increase: ((350 – 200)/200) * 100 = 75% • % decrease: ((350 - 200)/350) * 100 = 42. 3% • Speedup: • 350/200 = 1. 75 – Program A is 1. 75 x faster than program B • As a percentage: (1. 75 – 1) * 100 = 75% • If program C is 1 x faster than A, how many cycles does C run for? – 200 cycles (the same as A) • What if C is 1. 5 x faster? 133 cycles (50% faster than A) CIS 371: Comp. Org. | Dr. Joe Devietti | Performance 8

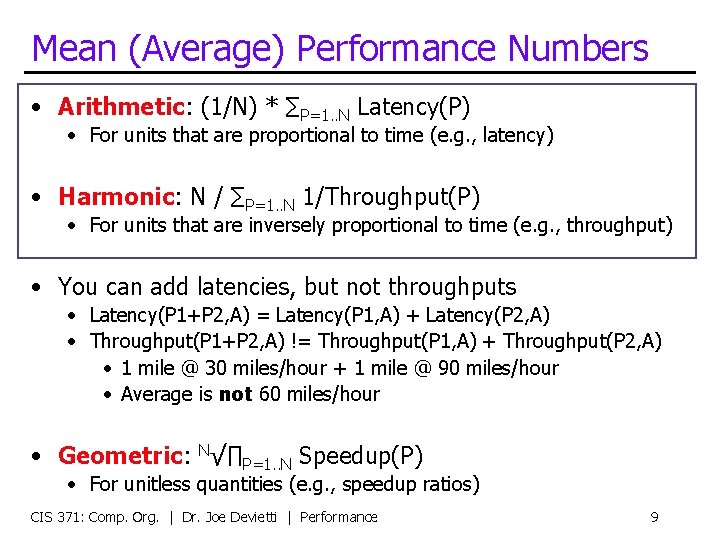
Mean (Average) Performance Numbers • Arithmetic: (1/N) * ∑P=1. . N Latency(P) • For units that are proportional to time (e. g. , latency) • Harmonic: N / ∑P=1. . N 1/Throughput(P) • For units that are inversely proportional to time (e. g. , throughput) • You can add latencies, but not throughputs • Latency(P 1+P 2, A) = Latency(P 1, A) + Latency(P 2, A) • Throughput(P 1+P 2, A) != Throughput(P 1, A) + Throughput(P 2, A) • 1 mile @ 30 miles/hour + 1 mile @ 90 miles/hour • Average is not 60 miles/hour • Geometric: N√∏P=1. . N Speedup(P) • For unitless quantities (e. g. , speedup ratios) CIS 371: Comp. Org. | Dr. Joe Devietti | Performance 9

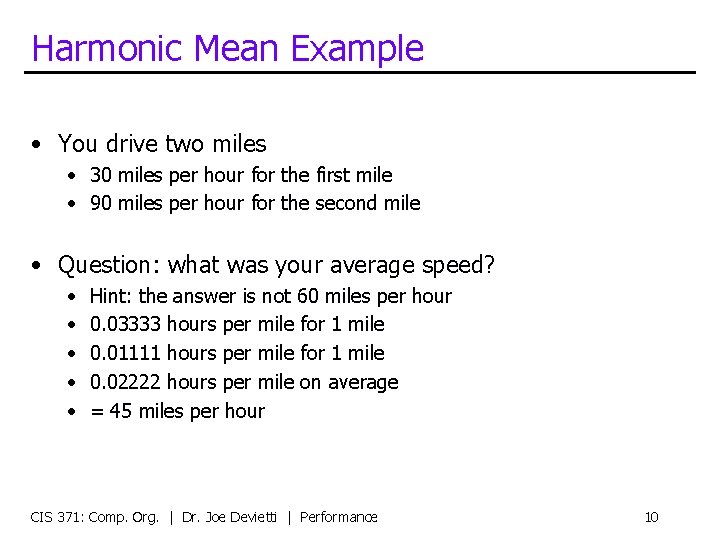
Harmonic Mean Example • You drive two miles • 30 miles per hour for the first mile • 90 miles per hour for the second mile • Question: what was your average speed? • • • Hint: the answer is not 60 miles per hour 0. 03333 hours per mile for 1 mile 0. 01111 hours per mile for 1 mile 0. 02222 hours per mile on average = 45 miles per hour CIS 371: Comp. Org. | Dr. Joe Devietti | Performance 10

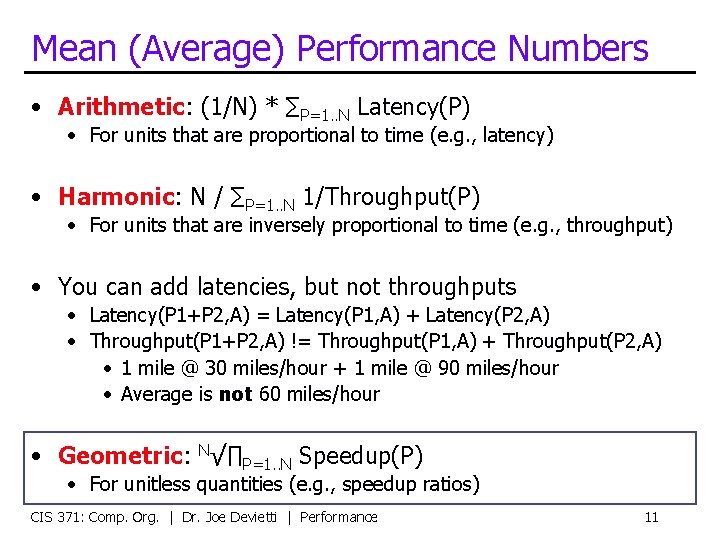
Mean (Average) Performance Numbers • Arithmetic: (1/N) * ∑P=1. . N Latency(P) • For units that are proportional to time (e. g. , latency) • Harmonic: N / ∑P=1. . N 1/Throughput(P) • For units that are inversely proportional to time (e. g. , throughput) • You can add latencies, but not throughputs • Latency(P 1+P 2, A) = Latency(P 1, A) + Latency(P 2, A) • Throughput(P 1+P 2, A) != Throughput(P 1, A) + Throughput(P 2, A) • 1 mile @ 30 miles/hour + 1 mile @ 90 miles/hour • Average is not 60 miles/hour • Geometric: N√∏P=1. . N Speedup(P) • For unitless quantities (e. g. , speedup ratios) CIS 371: Comp. Org. | Dr. Joe Devietti | Performance 11

CPU Performance CIS 371: Comp. Org. | Dr. Joe Devietti | Performance 12

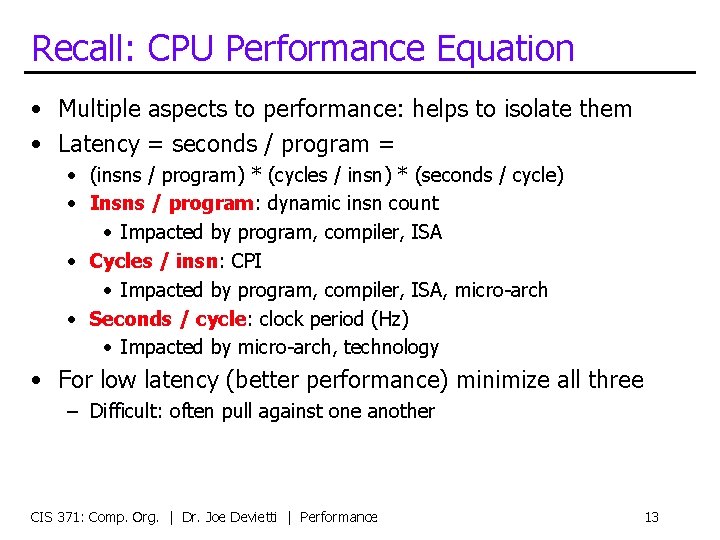
Recall: CPU Performance Equation • Multiple aspects to performance: helps to isolate them • Latency = seconds / program = • (insns / program) * (cycles / insn) * (seconds / cycle) • Insns / program: dynamic insn count • Impacted by program, compiler, ISA • Cycles / insn: CPI • Impacted by program, compiler, ISA, micro-arch • Seconds / cycle: clock period (Hz) • Impacted by micro-arch, technology • For low latency (better performance) minimize all three – Difficult: often pull against one another CIS 371: Comp. Org. | Dr. Joe Devietti | Performance 13

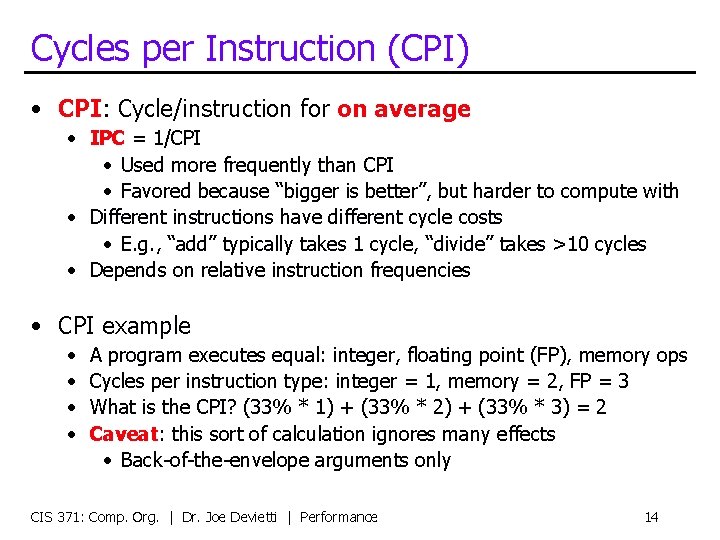
Cycles per Instruction (CPI) • CPI: Cycle/instruction for on average • IPC = 1/CPI • Used more frequently than CPI • Favored because “bigger is better”, but harder to compute with • Different instructions have different cycle costs • E. g. , “add” typically takes 1 cycle, “divide” takes >10 cycles • Depends on relative instruction frequencies • CPI example • • A program executes equal: integer, floating point (FP), memory ops Cycles per instruction type: integer = 1, memory = 2, FP = 3 What is the CPI? (33% * 1) + (33% * 2) + (33% * 3) = 2 Caveat: this sort of calculation ignores many effects • Back-of-the-envelope arguments only CIS 371: Comp. Org. | Dr. Joe Devietti | Performance 14

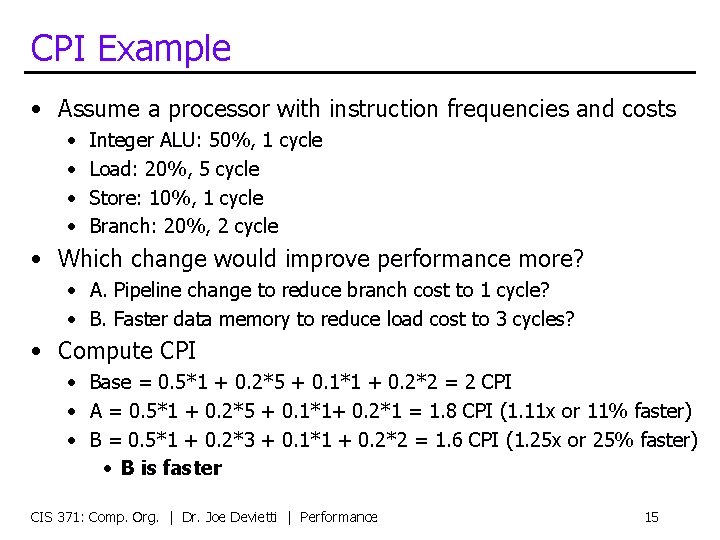
CPI Example • Assume a processor with instruction frequencies and costs • • Integer ALU: 50%, 1 cycle Load: 20%, 5 cycle Store: 10%, 1 cycle Branch: 20%, 2 cycle • Which change would improve performance more? • A. Pipeline change to reduce branch cost to 1 cycle? • B. Faster data memory to reduce load cost to 3 cycles? • Compute CPI • Base = 0. 5*1 + 0. 2*5 + 0. 1*1 + 0. 2*2 = 2 CPI • A = 0. 5*1 + 0. 2*5 + 0. 1*1+ 0. 2*1 = 1. 8 CPI (1. 11 x or 11% faster) • B = 0. 5*1 + 0. 2*3 + 0. 1*1 + 0. 2*2 = 1. 6 CPI (1. 25 x or 25% faster) • B is faster CIS 371: Comp. Org. | Dr. Joe Devietti | Performance 15

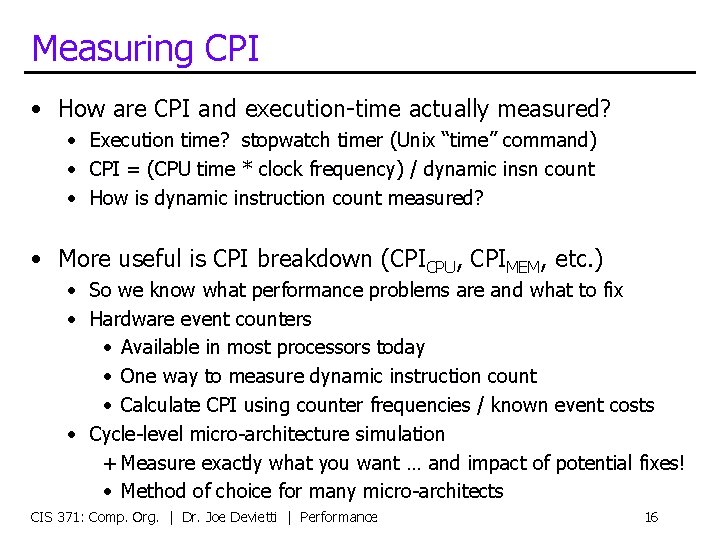
Measuring CPI • How are CPI and execution-time actually measured? • Execution time? stopwatch timer (Unix “time” command) • CPI = (CPU time * clock frequency) / dynamic insn count • How is dynamic instruction count measured? • More useful is CPI breakdown (CPICPU, CPIMEM, etc. ) • So we know what performance problems are and what to fix • Hardware event counters • Available in most processors today • One way to measure dynamic instruction count • Calculate CPI using counter frequencies / known event costs • Cycle-level micro-architecture simulation + Measure exactly what you want … and impact of potential fixes! • Method of choice for many micro-architects CIS 371: Comp. Org. | Dr. Joe Devietti | Performance 16

Pitfalls of Partial Performance Metrics CIS 371: Comp. Org. | Dr. Joe Devietti | Performance 17

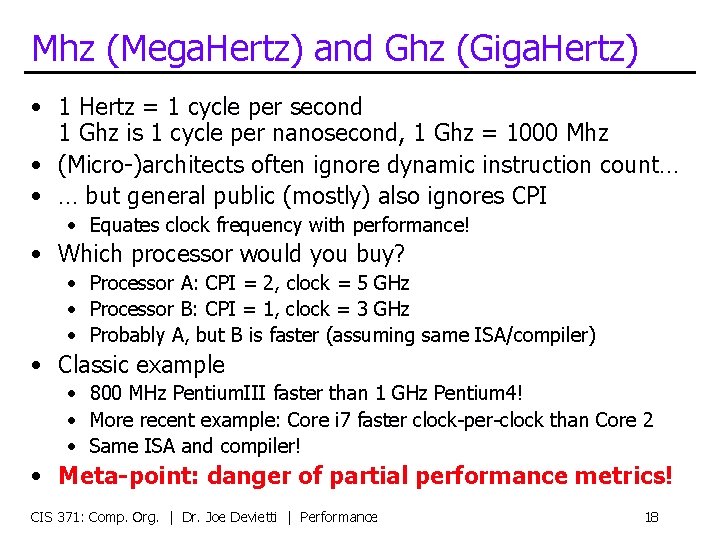
Mhz (Mega. Hertz) and Ghz (Giga. Hertz) • 1 Hertz = 1 cycle per second 1 Ghz is 1 cycle per nanosecond, 1 Ghz = 1000 Mhz • (Micro-)architects often ignore dynamic instruction count… • … but general public (mostly) also ignores CPI • Equates clock frequency with performance! • Which processor would you buy? • Processor A: CPI = 2, clock = 5 GHz • Processor B: CPI = 1, clock = 3 GHz • Probably A, but B is faster (assuming same ISA/compiler) • Classic example • 800 MHz Pentium. III faster than 1 GHz Pentium 4! • More recent example: Core i 7 faster clock-per-clock than Core 2 • Same ISA and compiler! • Meta-point: danger of partial performance metrics! CIS 371: Comp. Org. | Dr. Joe Devietti | Performance 18

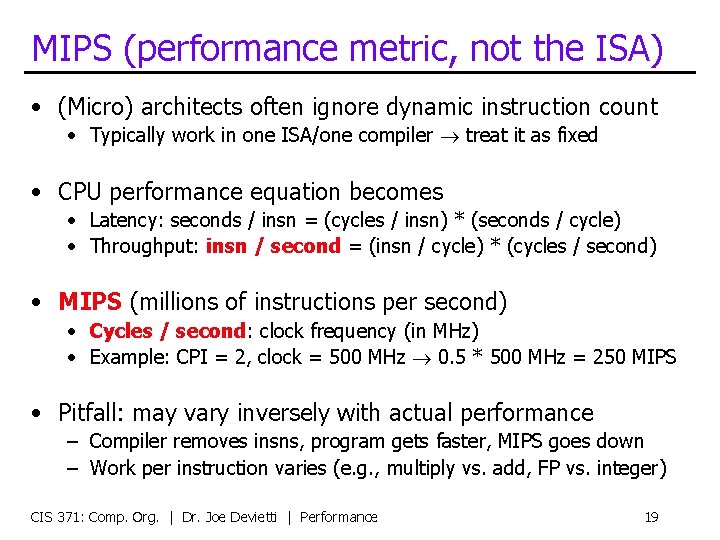
MIPS (performance metric, not the ISA) • (Micro) architects often ignore dynamic instruction count • Typically work in one ISA/one compiler treat it as fixed • CPU performance equation becomes • Latency: seconds / insn = (cycles / insn) * (seconds / cycle) • Throughput: insn / second = (insn / cycle) * (cycles / second) • MIPS (millions of instructions per second) • Cycles / second: clock frequency (in MHz) • Example: CPI = 2, clock = 500 MHz 0. 5 * 500 MHz = 250 MIPS • Pitfall: may vary inversely with actual performance – Compiler removes insns, program gets faster, MIPS goes down – Work per instruction varies (e. g. , multiply vs. add, FP vs. integer) CIS 371: Comp. Org. | Dr. Joe Devietti | Performance 19

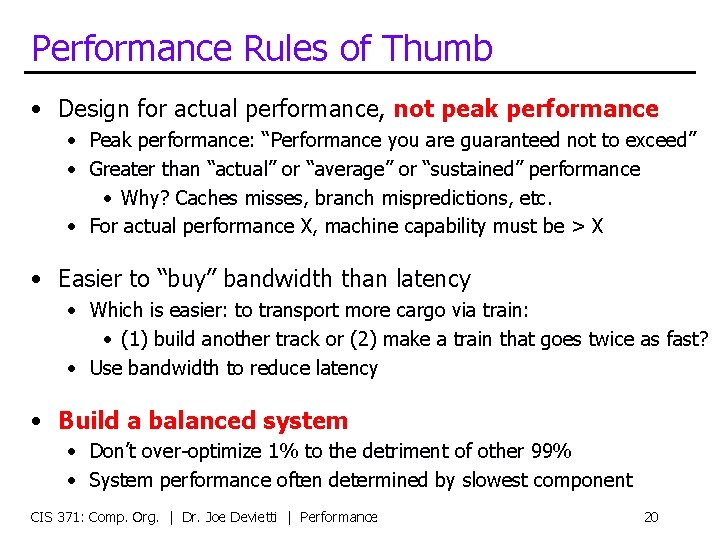
Performance Rules of Thumb • Design for actual performance, not peak performance • Peak performance: “Performance you are guaranteed not to exceed” • Greater than “actual” or “average” or “sustained” performance • Why? Caches misses, branch mispredictions, etc. • For actual performance X, machine capability must be > X • Easier to “buy” bandwidth than latency • Which is easier: to transport more cargo via train: • (1) build another track or (2) make a train that goes twice as fast? • Use bandwidth to reduce latency • Build a balanced system • Don’t over-optimize 1% to the detriment of other 99% • System performance often determined by slowest component CIS 371: Comp. Org. | Dr. Joe Devietti | Performance 20

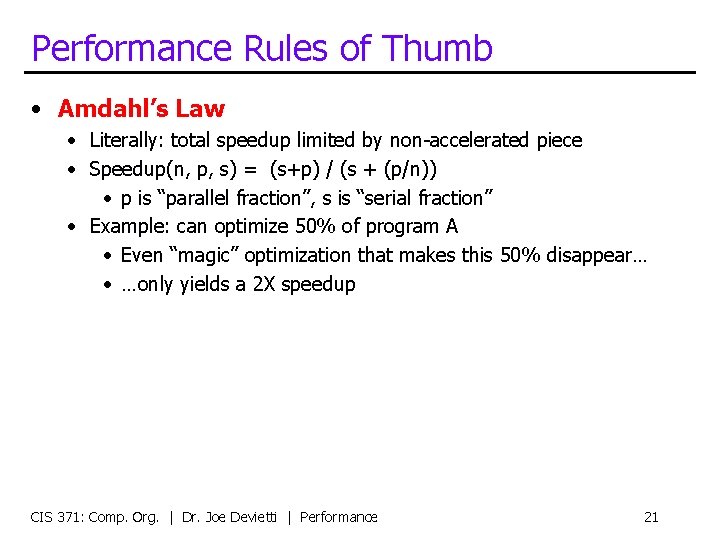
Performance Rules of Thumb • Amdahl’s Law • Literally: total speedup limited by non-accelerated piece • Speedup(n, p, s) = (s+p) / (s + (p/n)) • p is “parallel fraction”, s is “serial fraction” • Example: can optimize 50% of program A • Even “magic” optimization that makes this 50% disappear… • …only yields a 2 X speedup CIS 371: Comp. Org. | Dr. Joe Devietti | Performance 21

Benchmarking CIS 371: Comp. Org. | Dr. Joe Devietti | Performance 22

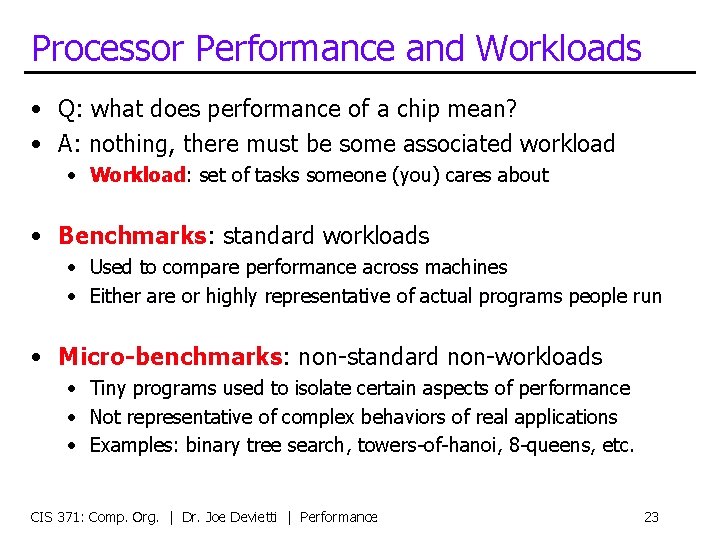
Processor Performance and Workloads • Q: what does performance of a chip mean? • A: nothing, there must be some associated workload • Workload: set of tasks someone (you) cares about • Benchmarks: standard workloads • Used to compare performance across machines • Either are or highly representative of actual programs people run • Micro-benchmarks: non-standard non-workloads • Tiny programs used to isolate certain aspects of performance • Not representative of complex behaviors of real applications • Examples: binary tree search, towers-of-hanoi, 8 -queens, etc. CIS 371: Comp. Org. | Dr. Joe Devietti | Performance 23

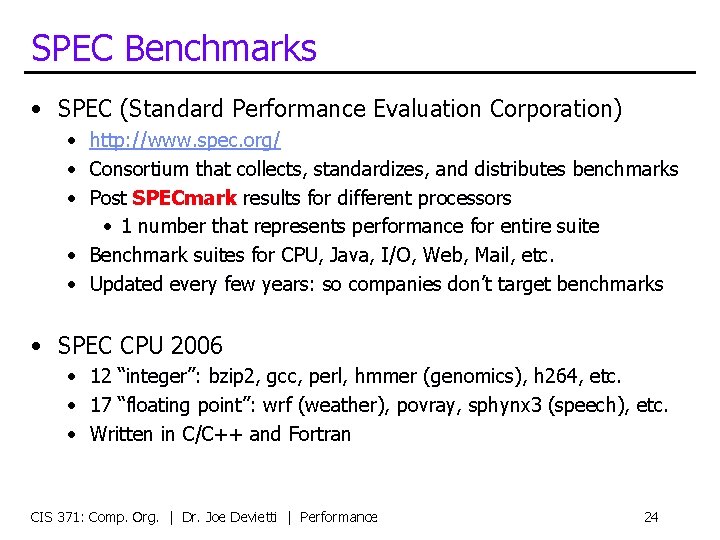
SPEC Benchmarks • SPEC (Standard Performance Evaluation Corporation) • http: //www. spec. org/ • Consortium that collects, standardizes, and distributes benchmarks • Post SPECmark results for different processors • 1 number that represents performance for entire suite • Benchmark suites for CPU, Java, I/O, Web, Mail, etc. • Updated every few years: so companies don’t target benchmarks • SPEC CPU 2006 • 12 “integer”: bzip 2, gcc, perl, hmmer (genomics), h 264, etc. • 17 “floating point”: wrf (weather), povray, sphynx 3 (speech), etc. • Written in C/C++ and Fortran CIS 371: Comp. Org. | Dr. Joe Devietti | Performance 24

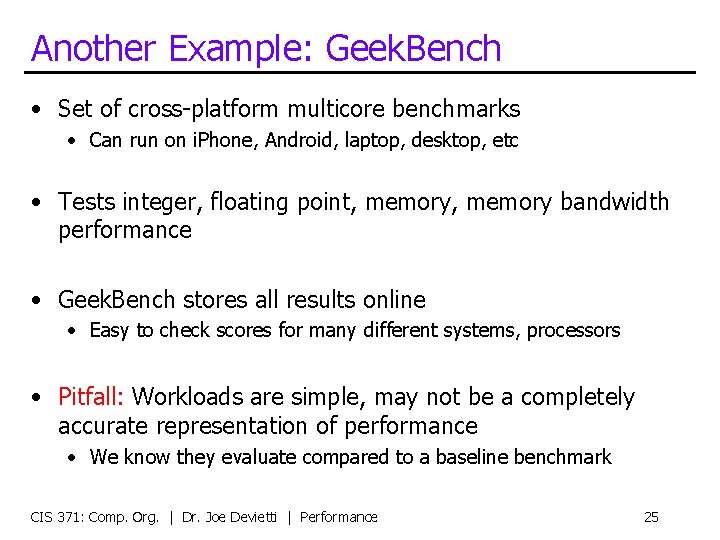
Another Example: Geek. Bench • Set of cross-platform multicore benchmarks • Can run on i. Phone, Android, laptop, desktop, etc • Tests integer, floating point, memory bandwidth performance • Geek. Bench stores all results online • Easy to check scores for many different systems, processors • Pitfall: Workloads are simple, may not be a completely accurate representation of performance • We know they evaluate compared to a baseline benchmark CIS 371: Comp. Org. | Dr. Joe Devietti | Performance 25

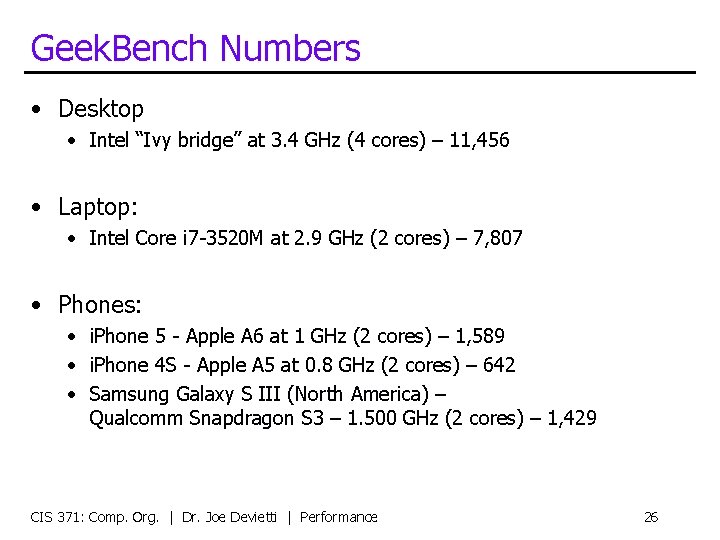
Geek. Bench Numbers • Desktop • Intel “Ivy bridge” at 3. 4 GHz (4 cores) – 11, 456 • Laptop: • Intel Core i 7 -3520 M at 2. 9 GHz (2 cores) – 7, 807 • Phones: • i. Phone 5 - Apple A 6 at 1 GHz (2 cores) – 1, 589 • i. Phone 4 S - Apple A 5 at 0. 8 GHz (2 cores) – 642 • Samsung Galaxy S III (North America) – Qualcomm Snapdragon S 3 – 1. 500 GHz (2 cores) – 1, 429 CIS 371: Comp. Org. | Dr. Joe Devietti | Performance 26

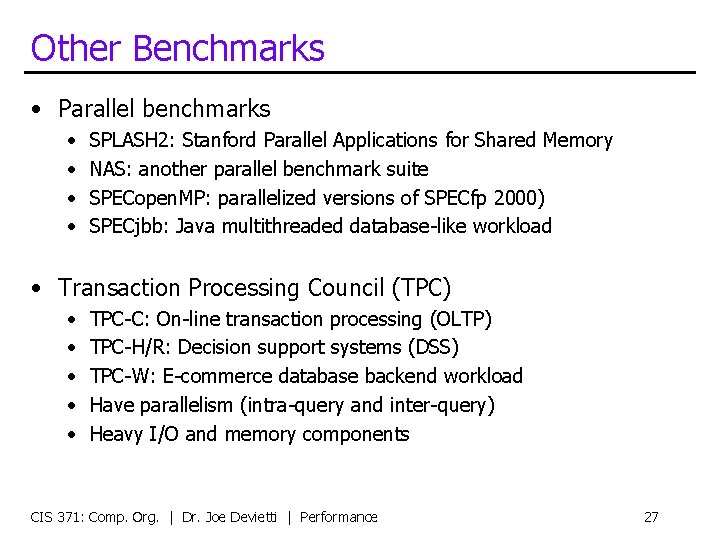
Other Benchmarks • Parallel benchmarks • • SPLASH 2: Stanford Parallel Applications for Shared Memory NAS: another parallel benchmark suite SPECopen. MP: parallelized versions of SPECfp 2000) SPECjbb: Java multithreaded database-like workload • Transaction Processing Council (TPC) • • • TPC-C: On-line transaction processing (OLTP) TPC-H/R: Decision support systems (DSS) TPC-W: E-commerce database backend workload Have parallelism (intra-query and inter-query) Heavy I/O and memory components CIS 371: Comp. Org. | Dr. Joe Devietti | Performance 27

Measuring 371 Processor Performance CIS 371: Comp. Org. | Dr. Joe Devietti | Performance 28

Benchmarking the LC-4 processors • Fixed workload: wireframe • Focus on improving frequency with pipelining • Focus on improving IPC with superscalar CIS 371: Comp. Org. | Dr. Joe Devietti | Performance 29

Measuring Frequency • Use Vivado’s post-implementation timing summary CIS 371: Comp. Org. | Dr. Joe Devietti | Performance 30

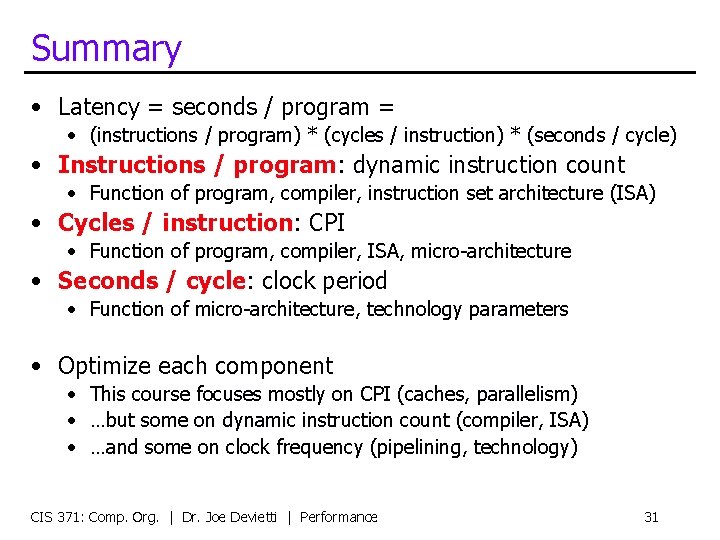
Summary • Latency = seconds / program = • (instructions / program) * (cycles / instruction) * (seconds / cycle) • Instructions / program: dynamic instruction count • Function of program, compiler, instruction set architecture (ISA) • Cycles / instruction: CPI • Function of program, compiler, ISA, micro-architecture • Seconds / cycle: clock period • Function of micro-architecture, technology parameters • Optimize each component • This course focuses mostly on CPI (caches, parallelism) • …but some on dynamic instruction count (compiler, ISA) • …and some on clock frequency (pipelining, technology) CIS 371: Comp. Org. | Dr. Joe Devietti | Performance 31