CHAPTER 4 CONTAMINANT TRANSPORT AND FATE INTRODUCTION In


- Slides: 47

CHAPTER 4 : CONTAMINANT TRANSPORT AND FATE

INTRODUCTION In traditional the flow of water through soils due to hydraulic gradient or pressure gradient is studied. l In environmental remediation, one must also study the contaminant transport and fate. l It is important to understand various processes that affect the transport (migration) and fate (chemical form and concentration) of the contaminants in soils and groundwater. l

INTRODUCTION l The major processes affecting the contaminants in subsurface can be grouped in three categories: 1. Transport processes: include advection, diffusion, and dispersion. 2. Chemical mass transfer processes: include sorption and desorption, dissolution and precipitation, oxidation and reduction, acid-base reactions, complication, ion exchange, volatilization, and hydrolysis. 3. Biological process (or biodegradation)

INTRODUCTION These various processes occur under different hydraulic and chemical conditions, which either exist naturally or are applied externally in the soil an groundwater systems. l Contaminant transport modeling incorporating these processes is performed to determine contaminant concentrations at exposure locations while performing the risk assessment and to evaluate and/or design effective waste containment systems (such as slurry walls and landfill liner systems, and site remediation systems (such as soil flushing, soil vapor extraction and bioremediation. l

INTRODUCTION l In this chapter, we describe the major transport, chemical, and biological processes that affect the fate and transport of contaminants in subsurface. l In addition, mathematical models that incorporate these processes and predict contaminant transport and fate in the subsurface are described. l Finally, examples of application of contaminant transport modeling to address various environmental problems are presented.

4. 2 TRANSPORT PROCESSES l In this section we present various contaminant transport processes: advection, diffusion, and dispersion. l These processes control the extent of contaminant migration in the subsurface. l These are the only processes that one must consider in dealing with the transport of nonreactive contaminants in the subsurface.

4. 2 TRANSPORT PROCESSES l Nonreactive contaminants are dissolved contaminants that are not influenced by chemical reactions or microbiological processes. l For reactive contaminants, these transport processes are considered along with various chemical mass transfer and microbial degradation processes.

4. 2. 1 Advection, also known as advective transport of convection, refers to the contaminant movement by flowing water in response to a hydraulic gradient. l The groundwater velocity for one-dimensional steadystate flow is given by Darcy's law as: (1) l Where V is the discharge velocity or Darcy's velocity, l K the hydraulic conductivity, and l i the hydraulic gradient. l

4. 2. 1 Advection l The seepage or actual velocity is calculated using: (2) Where V, is the seepage velocity and n is the porosity. l To be precise, the average seepage or flow velocity is given by: (3) Where ne is the effective porosity.

4. 2. 1 Advection l Effective porosity is defined as the volume of void space that conducts most of the flow, divided by the total volume of the soil. l The effective porosity excludes the noninterconnected and dead-end pores; thus, ne < n.

4. 2. 1 Advection l Under one-dimensional steady-state flow condition, the contaminant mass flux (i. e. , mass per unit area per unit time) due to advection (Fv) is given by: (4) where C is the dissolved contaminant concentration. l Under uniform flow conditions, the advective transport is described by: (5)

4. 2. 1 Advection The solution to this equation implies that if a contaminant of concentration C 0 is introduced in the flowing groundwater, then in time r it will be transported a distance x = Vst as a plug, due to advection. l This implies a sharp concentration interface, as shown in Figure. l

4. 2. 1 Advection For two- and three-dimensional steady-state or unsteady-state flow conditions, the groundwater flow velocities can be determined by performing groundwater flow modeling. l In general, the following porous media parameters must be known to perform advective transport analyses. l Hydraulic gradients: The potentiometric surface or water table contour maps are used to calculate hydraulic gradients. l

4. 2. 1 Advection l Hydraulic conductivity and transmissivity: The hydraulic conductivity of unconfined aquifers and the transmissivity of confined aquifers are required. l These properties can be determined based on laboratory methods and field test methods. l The laboratory test methods include a constant-head parameter test, variable-head parameter test, triaxial test, and consolidation test.

4. 2. 1 Advection l The field test methods include pumping tests and slug tests and generally consist of creating a head difference by displacing water in wells and measuring the drawdown or recovery of the water levels with time and then using the data to calculate the K value using an appropriate analysis method.

4. 2. 1 Advection l Specific yield and storability: For transient flow simulations, specific yield for unconfined aquifers and storability for confined aquifers are required. l These properties are determined by performing pumping tests or slug tests. l Porosity and effective porosity: Porosity and effective porosity are calculated based on laboratory testing and using the phase relationships.

Practice 1: Advection At a landfill site, dissolved chloride in a concentration of 1000 mg/L is being transported along with the leachate through a 5 -ft-thick natural silty sand layer into an underlying aquifer. The flow velocity is 0. 03 m/day and the effective porosity of silty sand is 0. 1. what is the mass flux of chloride into the aquifer per unit base area of the landfill due to advection alone? Answer: 3 g/day. m 2

4. 2. 2 Diffusion l Diffusion, also known as molecular diffusion, refers to the movement of contaminants under a chemical concentration gradient (i. e. . from an area of greater concentration toward an area of lower concentration). l Diffusion can occur even when the fluid is not flowing or is flowing in the direction opposite to contaminant movement. l Diffusion will cease only if there is no concentration gradient.

4. 2. 2 Diffusion is characterized using Fick's first law. l For one-dimensional conditions, this law can be expressed as: (6) l Where Fd, is the diffusive mass flux per unit area per unit time. D* the effective diffusion coefficient, and d. C/dx the concentration of gradient. l The values of D* do not vary significantly for different soils and contaminant combinations and they range from 1 x l 0 -9 to 2 x l 0 -9 m 2/s.

4. 2. 2 Diffusion The D* in equation (6) also accounts for tortuosity in the soils and can be related to self-diffusion coefficients (Do) of chemicals as follows: (7) l τ is the tortuosity coefficient, which has a value less than 1. l l The D 0 values for chemicals may be found in standard chemistry or environmental handbooks. (*Table 8. 1 presents Do values for selected chemicals page 171).

4. 2. 2 Diffusion The value of τ ranges from 0. 01 and 0. 5 (Freeze and Cherry, 1919). l The values of τ (or D*) can be determined by laboratory tests using the steady-state method, timelag method, and transient method. l From Fick's first law and the equation of continuity the rate at which contaminant can diffuse in soils can be given by: l (8)

4. 2. 2 Diffusion This is known as Fick's second law. l For the following initial condition, C(x, 0) = 0 (assuming that the porous medium is contaminant free initially) and boundary conditions, C(0, t) : Co and C(x, 0) =0, the solution to equation (8) is given by (Crank, 1956): l (9) Where C(x, t) is the concentration at distance x from the source at time t; C 0 the initial contaminant concentration, which is assumed to be constant; and erfc the complementary error function.

Practice 2: Diffusion At a landfill site, leachate accumulated over a 0. 3 m thick clay liner contains chloride concentration of 1000 mg/L. If the tortuosity is equal to 0. 5, what would be the concentration of chloride at a depth of 3 m after 100 years of diffusion? Neglect the effects of advection. Given D 0 of chloride is 20. 3 x 10 -10 m 2/s. Answer: 230 mg/l

4. 2. 3 Dispersion At the macro scale level, the contaminant transport is defined by the average groundwater velocity. l However, at the micro scale level, the actual velocity of water may vary from point to point and can be either lower or higher than the average velocity. l This difference in micro scale water velocities arises due to: l Pore size: The water velocity is inversely proportional to the pore size, which implies that lower velocities exist in larger pore spaces, while greater velocities exist in smaller pore spaces for the same quantity of flow. l

4. 2. 3 Dispersion l Path length: The greater the flow path, the lower the velocity; the flow path can be longer or shorter depending on the particle size and distribution. l Friction in pores: Water flowing close to the soil solids possesses lower velocities due to friction, while the water away from the soil solids possesses higher velocity.

4. 2. 3 Dispersion Because of these differences in velocities, mixing occurs along the flow path. l This mixing is called mechanical (or hydrodynamic) dispersion, or simply dispersion. l The mixing that occurs along the direction of the flow path is called longitudinal dispersion. l The contaminants will also spread in directions normal to the direction of the flow path, called transverse dispersion. l

4. 2. 3 Dispersion Both longitudinal dispersion and transverse dispersion are a function of the average velocity. l The longitudinal dispersion is defined by: l (10) Where DL is the coefficient of longitudinal mechanical dispersion, αL the longitudinal dispersivity, and Vs the average seepage velocity.

4. 2. 3 Dispersion l Similarly, the transverse dispersion is defined by: (11) Where DT is the coefficient of transverse mechanical dispersion, αT the transverse dispersivity, and Vs the average seepage velocity.

4. 2. 3 Dispersion l Generally, the molecular diffusion and mechanical dispersion are combined and the dispersion coefficients and are defined as: (12) Where and are called the longitudinal hydrodynamic dispersion coefficient and the transverse hydrodynamic dispersion coefficient, respectively.


4. 3: Chemical Mass Transfer Processes 1. Sorption and Desorption 2. Precipitation and Dissolution 3. Oxidation-Reduction (Redox) 4. Acid Base reaction 5. Complexation 6. Ion Exchange 7. Volatilization 8. Hydrolysis

4. 4: Biological process (Biodegradation) l Biodegradation, an oxidation-reduction reaction that is mediated by microorganisms, is the biological process that must be considered for organic contaminants. l In general, an organic compound is oxidized (loses electrons) by an electron acceptor, which is reduced (gains electrons). l This can occur in the following two ways: aerobic biodegradation and anaerobic biodegradation.

4. 4: Biological process (Biodegradation) Aerobic biodegradation occurs under aerobic environmental conditions in which oxygen, when present, commonly acts as the electron acceptor. l The oxidation of organic compounds, coupled with the reduction of molecular oxygen, is termed aerobic heterotrophic respiration. l Anaerobic biodegradation occurs under anaerobic or anoxic conditions (O 2 not present). l Microorganisms can use organic chemicals or inorganic anions as alternative electron acceptors. l

4. 4: Biological process (Biodegradation) Anaerobic biodegradation can occur under fermentative, denitrifying, iron-reducing, sulfate-reducing or methanogenic conditions. l Fermenting organisms utilize their substrata as both an electron donor and an acceptor. l In this process an organic compound is metabolized (metabolism = degradation of organic compounds to provide energy and carbon for growth), with a portion of that compound becoming a reduced end product and another becoming an oxidized product. l

4. 4: Biological process (Biodegradation) Six basic requirements must be met for biodegradation to occur (Bedient, et al 1994): 1. Presence of the appropriate organisms: bacteria and indigenous microorganisms to degrade specific contaminants Organisms can be natural or genetically engineered. 2. Energy source-organic carbon is required as an energy source and is used by the organisms for cell maintenance and growth. The organic carbon is transformed into inorganic carbon, energy, and electrons.

4. 4: Biological process (Biodegradation) 3. Carbon source - about 50% of the dry weight of bacteria is carbon. Organic chemicals serve as both carbon and energy sources. As a carbon source, organic carbon is used in conjunction with energy to generate new cells. 4. Electron acceptor-some chemicals must accept the electrons released from the energy source.

4. 4: Biological process (Biodegradation) 5. Nutrients - the required nutrients include nitrogen, phosphorus, calcium, magnesium, iron, and trace elements. 6. Acceptable environmental conditions -these include temperature, p. H, salinity. hydrostatic pressure, radiation, and low levels of heavy metals, or other toxic materials.

4. 5: Application l Contaminant transport and fate modeling is performed to assess and /or design environmental remediation system such as landfills, impoundments, in-situ barriers, and groundwater remedial system. l A few applications of contaminant transport and fate modeling for these environmental remediation system are presented below.

4. 5. 1: Landfills and Surface Impoundments l Landfill and impoundments are designed with liner systems to protect groundwater quality from the disposed wastes. l The liner systems consist of low permeable materials (compacted clay, geomembrane, geosynthetic clay liner) and must contain the disposed wastes effectively. l While designing the liner systems, contaminant transport modeling is performed to determine potential breakthrough of the waste constituents (contaminants).

4. 5. 1: Landfills and Surface Impoundments Because of the low permeability, the primary contaminant transport mechanism in liner systems is diffusion. l In addition to diffusion, advection and sorption effect are commonly taken into account in assessing contaminant transport through liner systems. l Because of the large areal extent of a landfill compared to the liner and subsurface profile to the upper aquifer, an assumption of one-dimensional contaminant transport (in the vertical direction or z direction) is valid. l

4. 5. 1: Landfills and Surface Impoundments l The governing equation to describe contaminant transport through the liner systems of landfills and impoundments is given by: (13) Where C is the contaminant concentration, t the elapsed time, D* the effective diffusion coefficient, z the distance in the direction of flow, Vs, the seepage velocity, and R the retardation coefficient. Since a linear sorption isotherm (S = Kd. C) is assumed, the retardation coefficient. R is: (14) Where n and ρd are porosity and dry density of the transport medium.

4. 3. 1: Landfills and Surface Impoundments Equation (14) assumes no reactions. l Equation (13) can be solved using different initial and boundary conditions. l The following initial and boundary conditions are commonly applicable for liner systems in new landfills: l

4. 3. 1: Landfills and Surface Impoundments l For these initial and boundary conditions, the solution to equation (13) given by Ogata and Banks (1961) is as follows: (15) l For a Peclet number >1000, the solution above is approximated by (16)

4. 3. 1: Landfills and Surface Impoundments l In diffusion-dominated systems (Pe < 1). Fick's second law is used to describe the transient diffusion, which is given mathematically by (17) l With initial and boundary conditions C(z, 0)=0, and C(0, t)=C 0 and C(α, 0)=0, the solution to the equation above is given by (18)

4. 5. 2: Groundwater Contamination l Contaminant transport modeling is very helpful in groundwater contamination assessment and remediation studies. l Contaminant transport modeling is performed to determine the contaminant concentrations at exposure locations during risk assessment. l Contaminant transport modeling is also performed to assess the fate of contamination under different remedial scenarios, including a scenario in which no remedial action is proposed.

Summary l In this chapter we presented various transport, chemical, and biological processes that affect contaminant migration, transfer, and transformation in natural soil and groundwater systems. l An understanding of these processes is essential for the design of effective waste containment and remedial systems. l For instance, if one wants to evaluate the potential for leachate migration through liner systems in a landfill, the contaminant transport analysis must include the processes that affect the site-specific materials and conditions.

Summary l Similarly, in the development or selection of a remediation method for contaminated soils and groundwater, the processes that effectively separate or transform the contaminants under the site-specific contaminant, soil, and groundwater combinations must be assessed carefully. l The concepts presented here are explained further by citing practical examples of landfill, surface impoundment, containment barrier, and groundwater systems.
 Contaminant transport equation
 Primary transport and secondary transport
 Primary vs secondary active transport
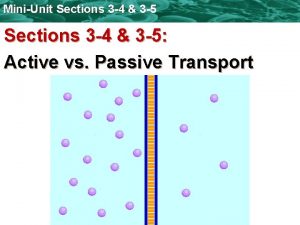
 Active and passive transport
 Now answer the following questions
 Passive transport vs active transport venn diagram
 Unlike passive transport, active transport requires
 Primary active transport vs secondary active transport
 Bioflix activity membrane transport active transport
 Bioflix membrane transport
 Fate scenes in romeo and juliet
 Unit 5 lesson 7 the age of imperialism
 Themes of the aeneid
 How is water transported in humans
 William wallace fate
 Fate exam
 John o'sullivan
 Partitioning of primordial ventricle
 John is generally pleasant but during final exams
 Discoblastula diagram
 Who does antigone blame for her death
 Non fare agli altri quello che
 Metabolic fate of pyruvate
 To whom does napoleon sell the farm’s pile of timber?
 The ultimate fate of the universe
 Origin fate
 Who is king acrisius
 Rescribi
 Man vs supernatural conflict
 Character vs. fate
 Throbus
 Amate i vostri nemici fate del bene a chi vi odia
 Cortical reaction
 Fellowships of fate
 Development of interatrial septum
 Peronial vein
 Fate of thrombus slideshare
 Primary complex symptoms
 Fate in tragedy
 Obvious fate
 Macbeth quotes
 Red infarct
 Fate slew him but he did not drop
 Fate of germ layers
 Mansa musa fate
 Chapter 3 transport layer
 Section 4 cellular transport
 Chapter 7 section 4 cellular transport

