Ch 5 Support Vector Machines Stephen Marsland Machine


 ^ (Humidity = High) THEN")


 • Problem 5. 3, p 131")
- Slides: 25
Ch. 5: Support Vector Machines Stephen Marsland, Machine Learning: An Algorithmic Perspective. CRC 2009 Based on slides by Pierre Dönnes and Ron Meir Modified by Longin Jan Latecki, Temple University
Outline • What do we mean with classification, why is it useful • Machine learning- basic concept • Support Vector Machines (SVM) – Linear SVM – basic terminology and some formulas – Non-linear SVM – the Kernel trick • An example: Predicting protein subcellular location with SVM • Performance measurments
Classification • Everyday, all the time we classify things. • Eg crossing the street: – Is there a car coming? – At what speed? – How far is it to the other side? – Classification: Safe to walk or not!!!
• Decision tree learning IF (Outlook = Sunny) ^ (Humidity = High) THEN Play. Tennis =NO IF (Outlook = Sunny)^ (Humidity = Normal) THEN Play. Tennis = YES Outlook Sunny Overcast Rain Yes Humidity High Normal No Yes Wind Strong No Training examples: Day Outlook Temp. Humidity Wind Play. Tennis D 1 Sunny Hot High Weak No D 2 Overcast Hot High Strong Yes …… Weak Yes
Classification tasks • Learning Task – Given: Expression profiles of leukemia patients and healthy persons. – Compute: A model distinguishing if a person has leukemia from expression data. • Classification Task – Given: Expression profile of a new patient + a learned model – Determine: If a patient has leukemia or not.
Problems in classifying data • • Often high dimension of data. Hard to put up simple rules. Amount of data. Need automated ways to deal with the data. • Use computers – data processing, statistical analysis, try to learn patterns from the data (Machine Learning)
Black box view of Machine Learning Training data Test-data Model Magic black box (learning machine) Prediction = cancer or not Training data: -Expression patterns of some cancer + expression data from healty person Model: - The model can distinguish between healty and sick persons. Can be used for prediction.
Tennis example 2 Temperature Humidity = play tennis = do not play tennis
Linearly Separable Classes
Linear Support Vector Machines Data: <xi, yi>, i=1, . . , l xi R d yi {-1, +1} x 2 =+1 =-1 x 1
Linear SVM 2 Data: <xi, yi>, i=1, . . , l xi R d yi {-1, +1} f(x) =-1 =+1 All hyperplanes in Rd are parameterized by a vector (w) and a constant b. Can be expressed as w • x+b=0 (remember the equation for a hyperplane from algebra!) Our aim is to find such a hyperplane f(x)=sign(w • x+b), that correctly classify our data.
Selection of a Good Hyper-Plane Objective: Select a `good' hyper-plane using only the data! Intuition: (Vapnik 1965) - assuming linear separability (i) Separate the data (ii) Place hyper-plane `far' from data
Definitions Define the hyperplane H such that: xi • w+b +1 when yi =+1 xi • w+b -1 when yi =-1 H 1 and H 2 are the planes: H 1: xi • w+b = +1 H 2: xi • w+b = -1 The points on the planes H 1 and H 2 are the Support Vectors: H 1 H 2 d+ = the shortest distance to the closest positive point d- = the shortest distance to the closest negative point The margin of a separating hyperplane is d+ + d-. d+ d- H
Maximizing the margin We want a classifier with as big margin as possible. H 1 Recall the distance from a point(x 0, y 0) to a line: Ax+By+c = 0 is|A x 0 +B y 0 +c|/sqrt(A 2+B 2) H H 2 d+ d- The distance between H and H 1 is: |w • x+b|/||w||=1/||w|| The distance between H 1 and H 2 is: 2/||w|| In order to maximize the margin, we need to minimize ||w||. With the condition that there are no datapoints between H 1 and H 2: xi • w+b +1 when yi =+1 xi • w+b -1 when yi =-1 Can be combined into yi(xi • w) 1
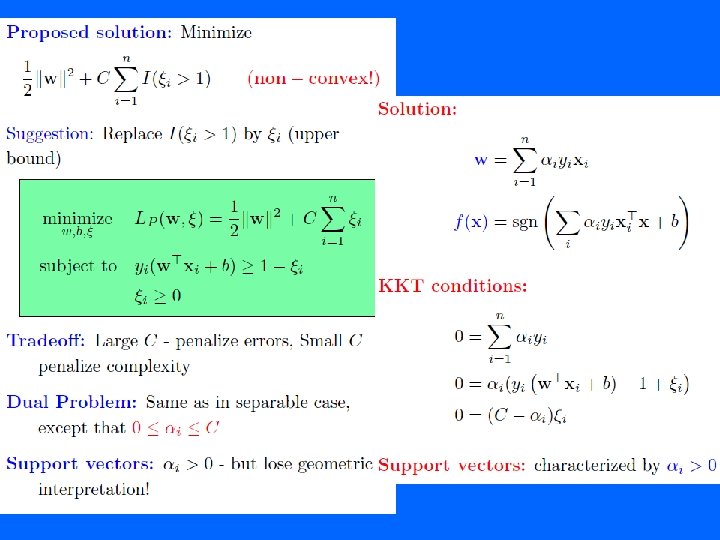
Optimization Problem
The Lagrangian trick Reformulate the optimization problem: A ”trick” often used in optimization is to do an Lagrangian formulation of the problem. The constraints will be replaced by constraints on the Lagrangian multipliers and the training data will only occur as dot products. What we need to see: xiand xj (input vectors) appear only in the form of dot product – we will soon see why that is important.
Non-Separable Case
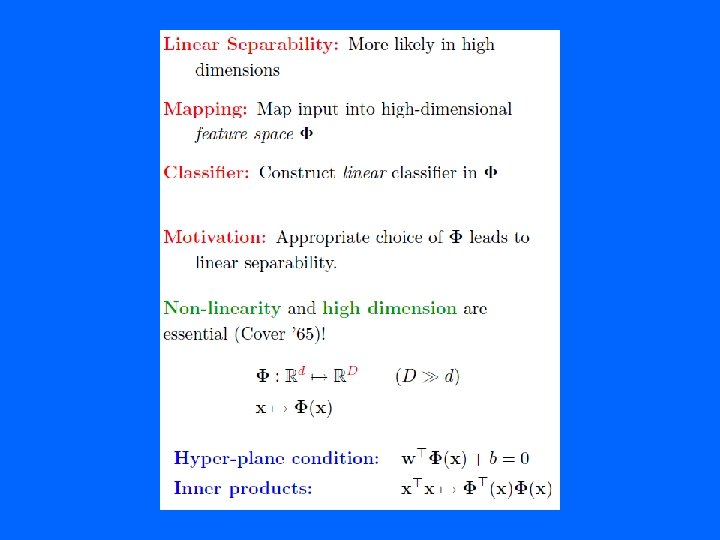
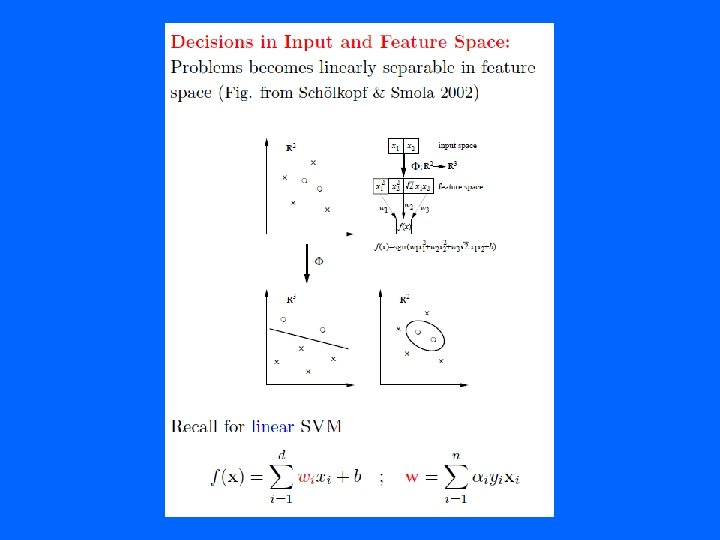
Problems with linear SVM =-1 =+1 What if the decison function is not a linear?
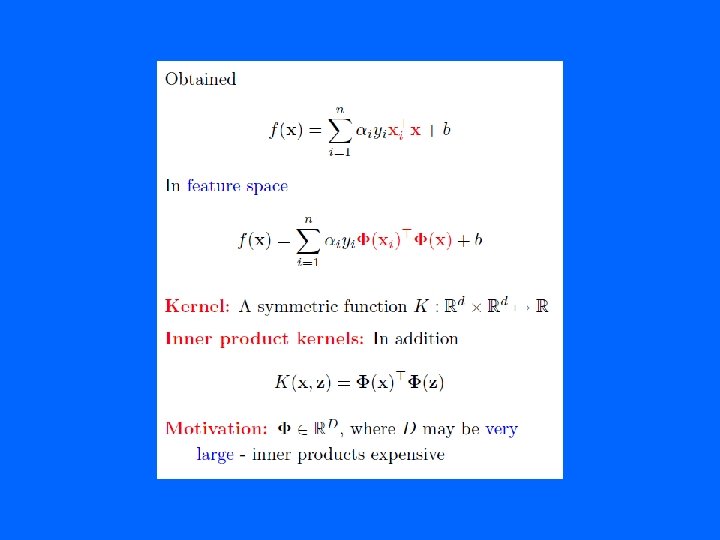
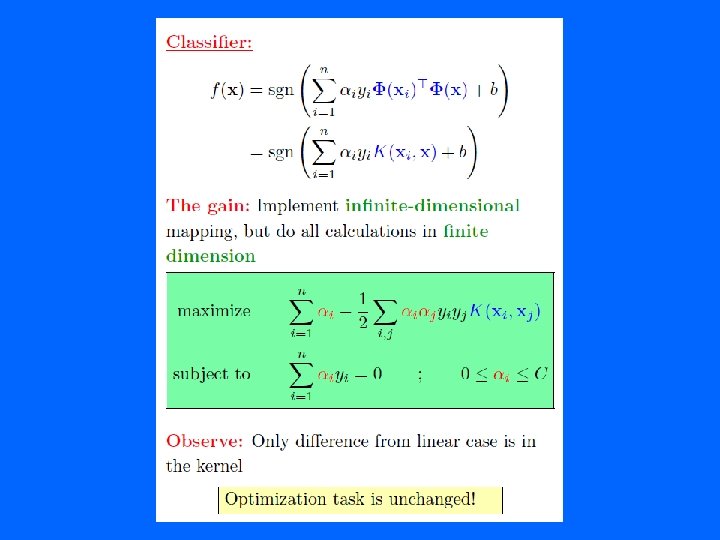
Non-linear SVM 1 The Kernel trick Imagine a function that maps the data into another space: Rd =Rd =-1 =+1 Remember the function we want to optimize: LD = i – ½ i jyiyjxi • xj, xi and xj as a dot product. We will have (xi) • (xj) in the non-linear case. If there is a ”kernel function” K such as K(xi, xj) = (xi) • (xj), we do not need to know explicitly. One example:
Homework • XOR example (Section 5. 2. 1) • Problem 5. 3, p 131