Automating Reports using putdocx and putpdf Winnie Dong
- Slides: 38
Automating Reports using putdocx and putpdf “Winnie” Dong Hua July 2018, Stata Corp. Conference CONFIDENTIAL AND PROPRIETARY INFORMATION NOT FOR DISTRIBUTION 1
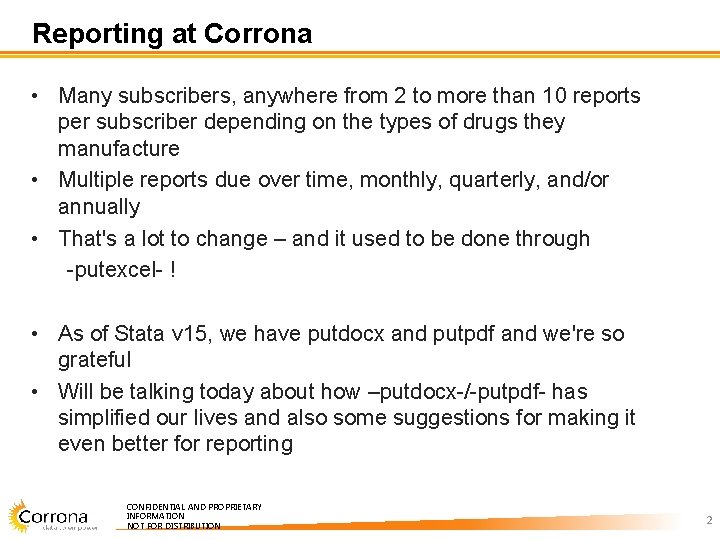
Reporting at Corrona • Many subscribers, anywhere from 2 to more than 10 reports per subscriber depending on the types of drugs they manufacture • Multiple reports due over time, monthly, quarterly, and/or annually • That's a lot to change – and it used to be done through -putexcel- ! • As of Stata v 15, we have putdocx and putpdf and we're so grateful • Will be talking today about how –putdocx-/-putpdf- has simplified our lives and also some suggestions for making it even better for reporting CONFIDENTIAL AND PROPRIETARY INFORMATION NOT FOR DISTRIBUTION 2
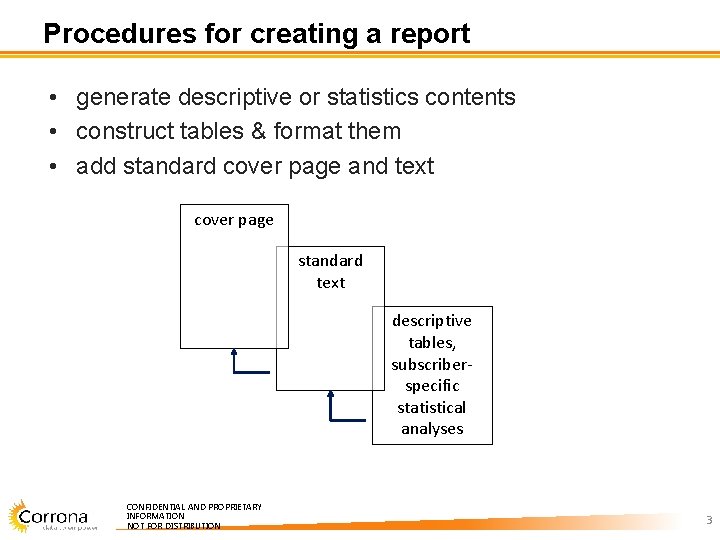
Procedures for creating a report • generate descriptive or statistics contents • construct tables & format them • add standard cover page and text cover page standard text descriptive tables, subscriberspecific statistical analyses CONFIDENTIAL AND PROPRIETARY INFORMATION NOT FOR DISTRIBUTION 3
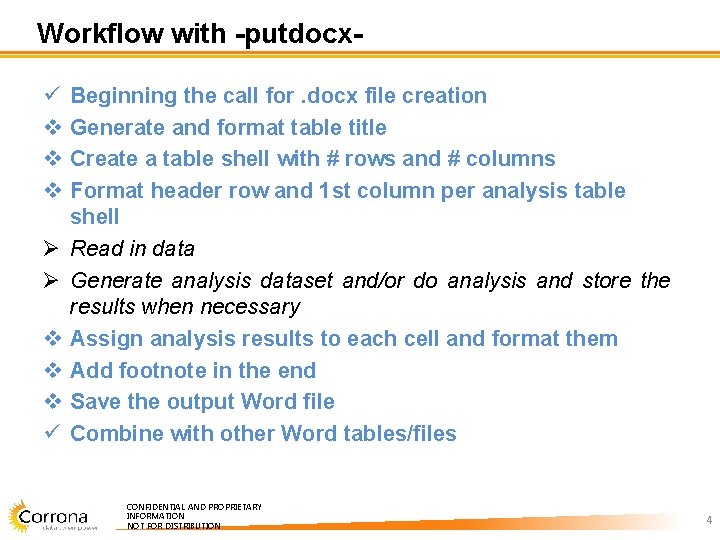
Workflow with -putdocxü v v v Ø Ø v v v ü Beginning the call for. docx file creation Generate and format table title Create a table shell with # rows and # columns Format header row and 1 st column per analysis table shell Read in data Generate analysis dataset and/or do analysis and store the results when necessary Assign analysis results to each cell and format them Add footnote in the end Save the output Word file Combine with other Word tables/files CONFIDENTIAL AND PROPRIETARY INFORMATION NOT FOR DISTRIBUTION 4
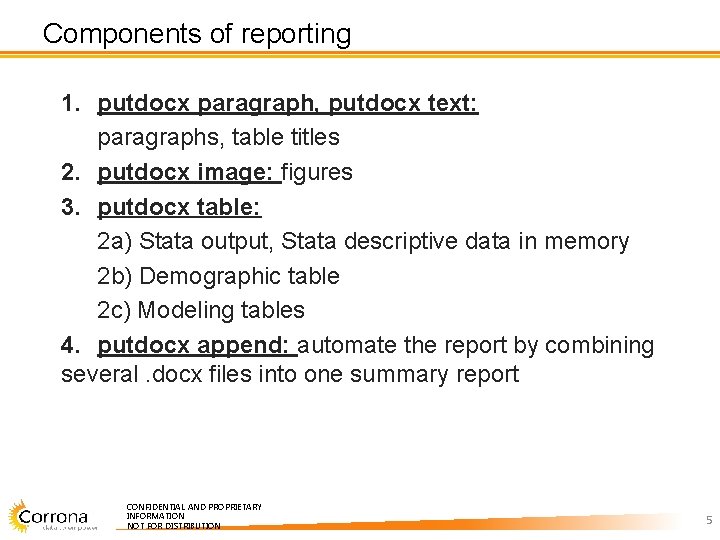
Components of reporting 1. putdocx paragraph, putdocx text: paragraphs, table titles 2. putdocx image: figures 3. putdocx table: 2 a) Stata output, Stata descriptive data in memory 2 b) Demographic table 2 c) Modeling tables 4. putdocx append: automate the report by combining several. docx files into one summary report CONFIDENTIAL AND PROPRIETARY INFORMATION NOT FOR DISTRIBUTION 5
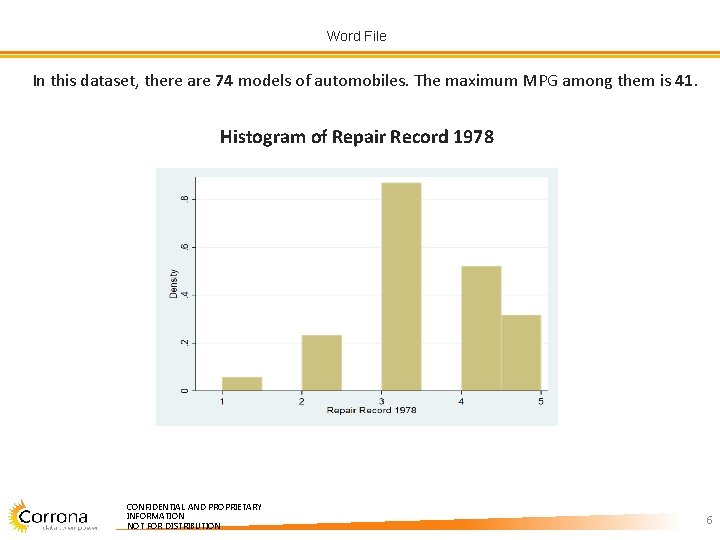
Word File In this dataset, there are 74 models of automobiles. The maximum MPG among them is 41. Histogram of Repair Record 1978 CONFIDENTIAL AND PROPRIETARY INFORMATION NOT FOR DISTRIBUTION 6
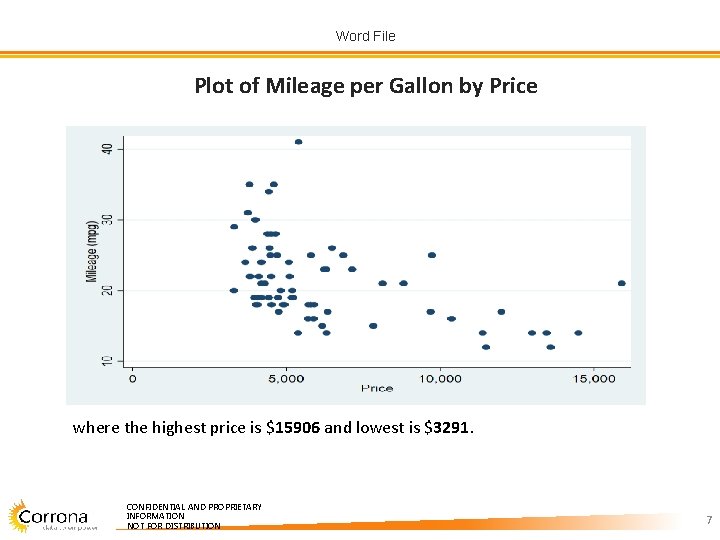
Word File Plot of Mileage per Gallon by Price where the highest price is $15906 and lowest is $3291. CONFIDENTIAL AND PROPRIETARY INFORMATION NOT FOR DISTRIBUTION 7
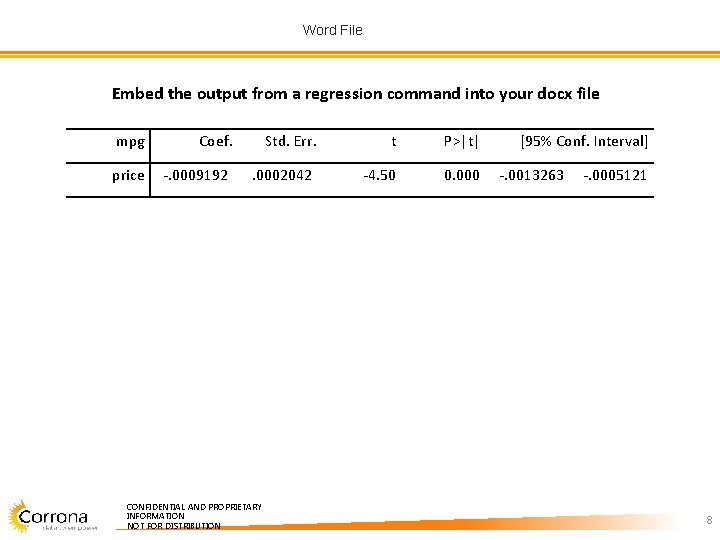
Word File Embed the output from a regression command into your docx file mpg Coef. Std. Err. t P>|t| price -. 0009192 . 0002042 -4. 50 0. 000 CONFIDENTIAL AND PROPRIETARY INFORMATION NOT FOR DISTRIBUTION [95% Conf. Interval] -. 0013263 -. 0005121 8
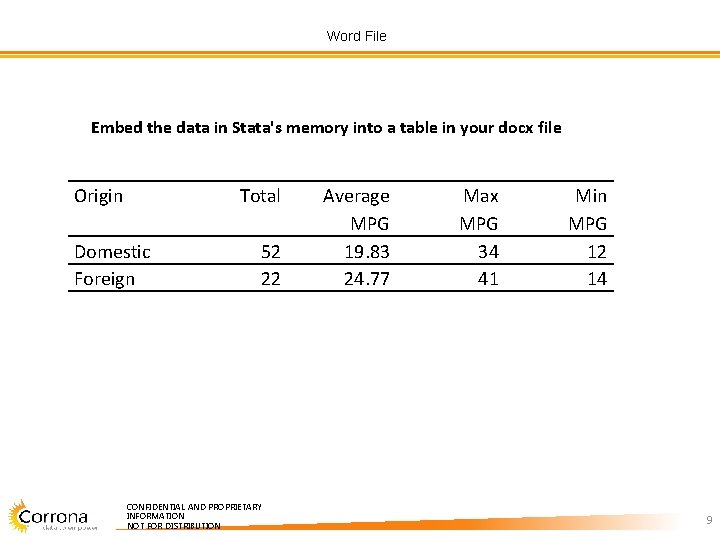
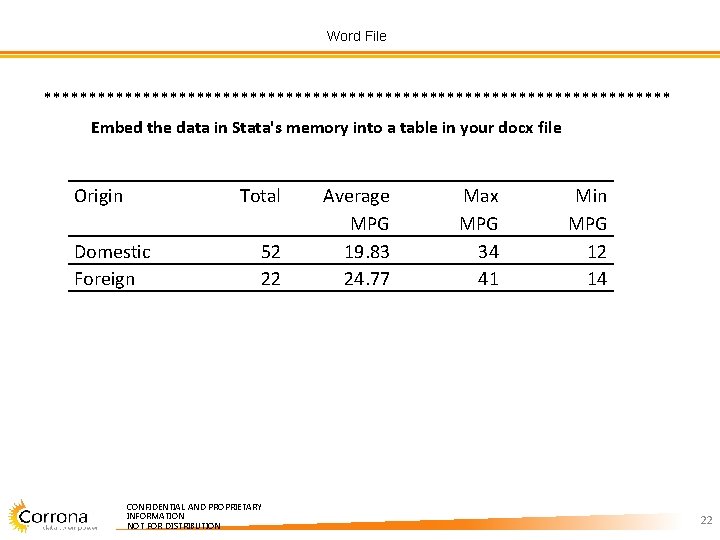
Word File Embed the data in Stata's memory into a table in your docx file Origin Total Domestic Foreign 52 22 CONFIDENTIAL AND PROPRIETARY INFORMATION NOT FOR DISTRIBUTION Average MPG 19. 83 24. 77 Max MPG 34 41 Min MPG 12 14 9
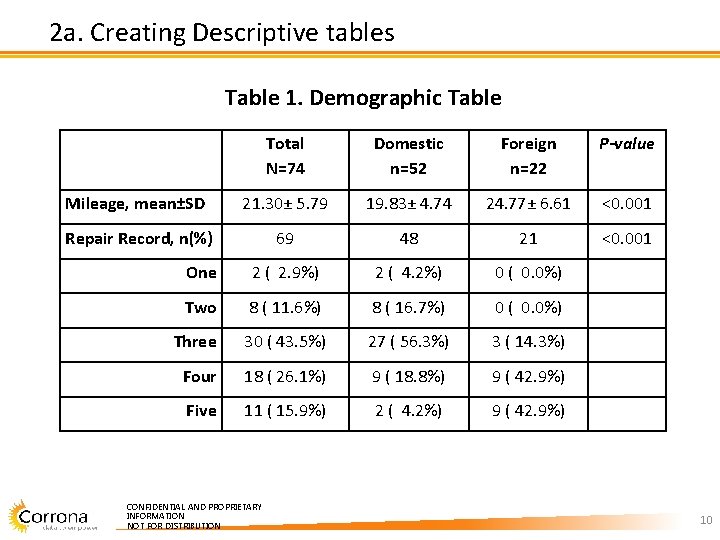
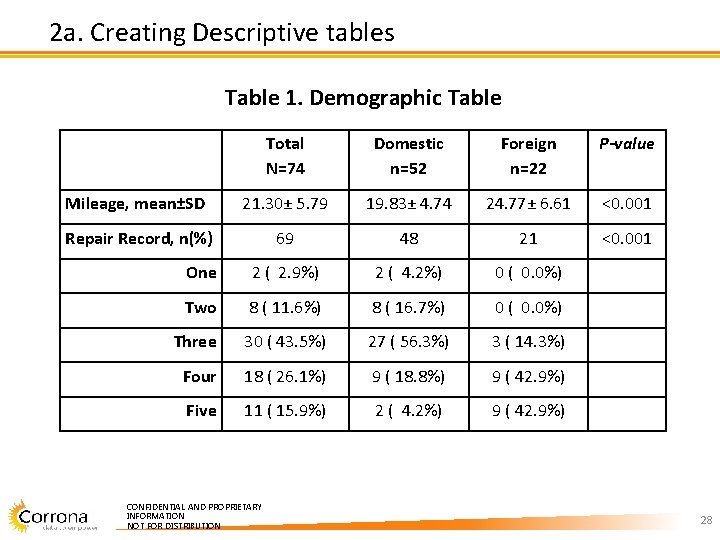
2 a. Creating Descriptive tables Table 1. Demographic Table Total N=74 Domestic n=52 Foreign n=22 P-value Mileage, mean±SD 21. 30± 5. 79 19. 83± 4. 74 24. 77± 6. 61 <0. 001 Repair Record, n(%) 69 48 21 <0. 001 One 2 ( 2. 9%) 2 ( 4. 2%) 0 ( 0. 0%) Two 8 ( 11. 6%) 8 ( 16. 7%) 0 ( 0. 0%) Three 30 ( 43. 5%) 27 ( 56. 3%) 3 ( 14. 3%) Four 18 ( 26. 1%) 9 ( 18. 8%) 9 ( 42. 9%) Five 11 ( 15. 9%) 2 ( 4. 2%) 9 ( 42. 9%) CONFIDENTIAL AND PROPRIETARY INFORMATION NOT FOR DISTRIBUTION 10
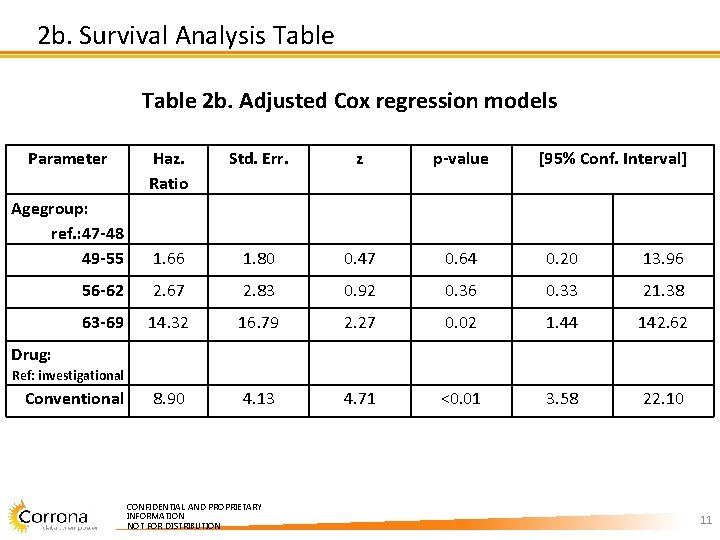
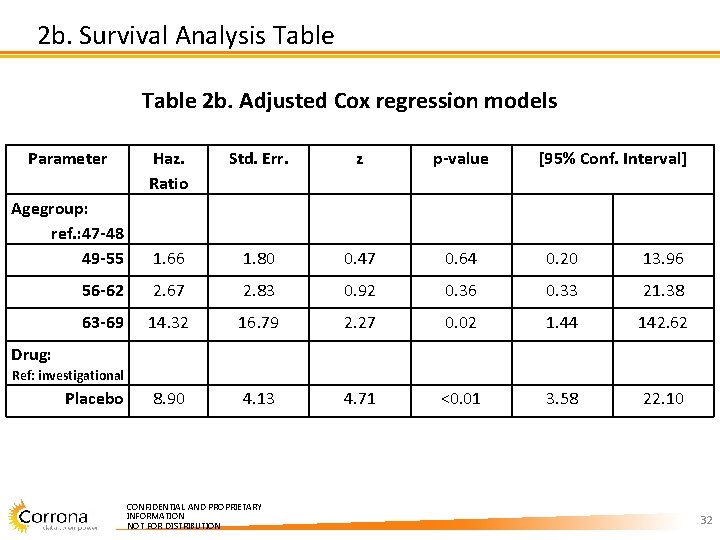
2 b. Survival Analysis Table 2 b. Adjusted Cox regression models Parameter Haz. Ratio Std. Err. z p-value 1. 66 1. 80 0. 47 0. 64 0. 20 13. 96 56 -62 2. 67 2. 83 0. 92 0. 36 0. 33 21. 38 63 -69 14. 32 16. 79 2. 27 0. 02 1. 44 142. 62 8. 90 4. 13 4. 71 <0. 01 3. 58 22. 10 Agegroup: ref. : 47 -48 49 -55 Drug: [95% Conf. Interval] Ref: investigational Conventional CONFIDENTIAL AND PROPRIETARY INFORMATION NOT FOR DISTRIBUTION 11
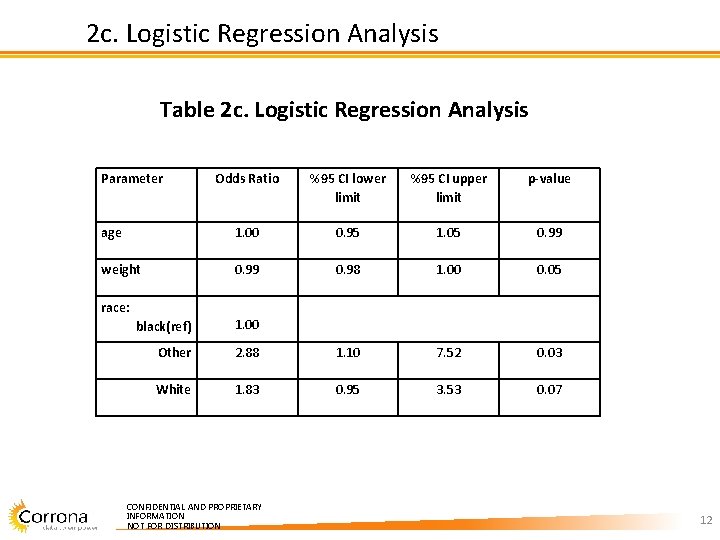
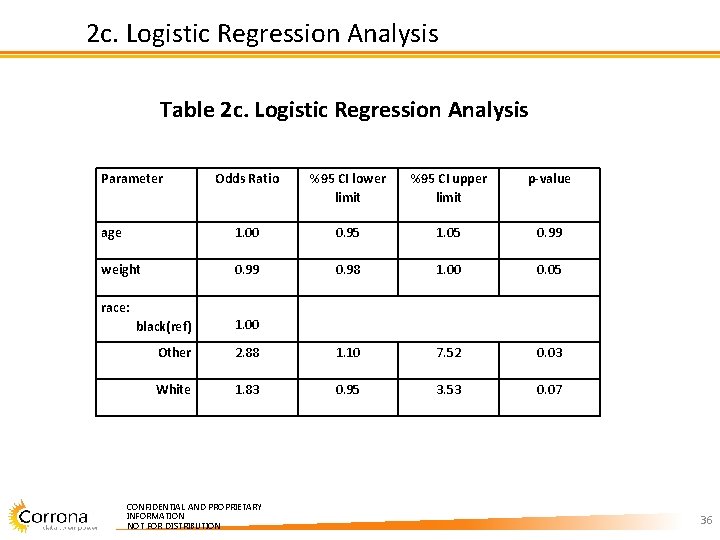
2 c. Logistic Regression Analysis Table 2 c. Logistic Regression Analysis Parameter Odds Ratio %95 CI lower limit %95 CI upper limit p-value age 1. 00 0. 95 1. 05 0. 99 weight 0. 99 0. 98 1. 00 0. 05 race: black(ref) 1. 00 Other 2. 88 1. 10 7. 52 0. 03 White 1. 83 0. 95 3. 53 0. 07 CONFIDENTIAL AND PROPRIETARY INFORMATION NOT FOR DISTRIBUTION 12
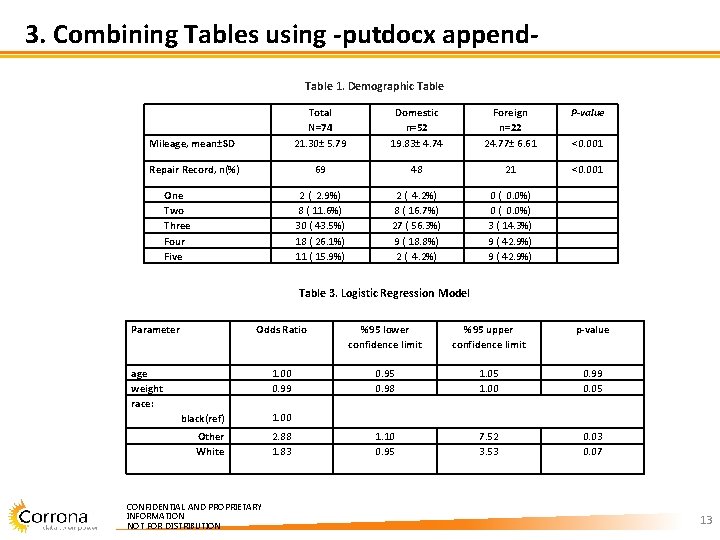
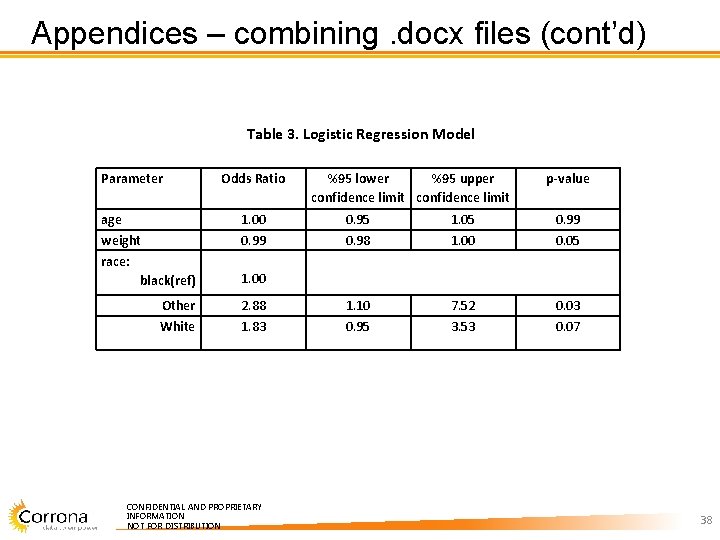
3. Combining Tables using -putdocx append. Table 1. Demographic Table Domestic n=52 19. 83± 4. 74 Foreign n=22 24. 77± 6. 61 P-value Mileage, mean±SD Total N=74 21. 30± 5. 79 Repair Record, n(%) 69 48 21 <0. 001 2 ( 2. 9%) 8 ( 11. 6%) 30 ( 43. 5%) 18 ( 26. 1%) 11 ( 15. 9%) 2 ( 4. 2%) 8 ( 16. 7%) 27 ( 56. 3%) 9 ( 18. 8%) 2 ( 4. 2%) 0 ( 0. 0%) 3 ( 14. 3%) 9 ( 42. 9%) One Two Three Four Five <0. 001 Table 3. Logistic Regression Model Parameter Odds Ratio %95 lower confidence limit %95 upper confidence limit p-value 1. 00 0. 99 0. 95 0. 98 1. 05 1. 00 0. 99 0. 05 1. 10 0. 95 7. 52 3. 53 0. 07 age weight race: black(ref) 1. 00 Other White 2. 88 1. 83 CONFIDENTIAL AND PROPRIETARY INFORMATION NOT FOR DISTRIBUTION 13
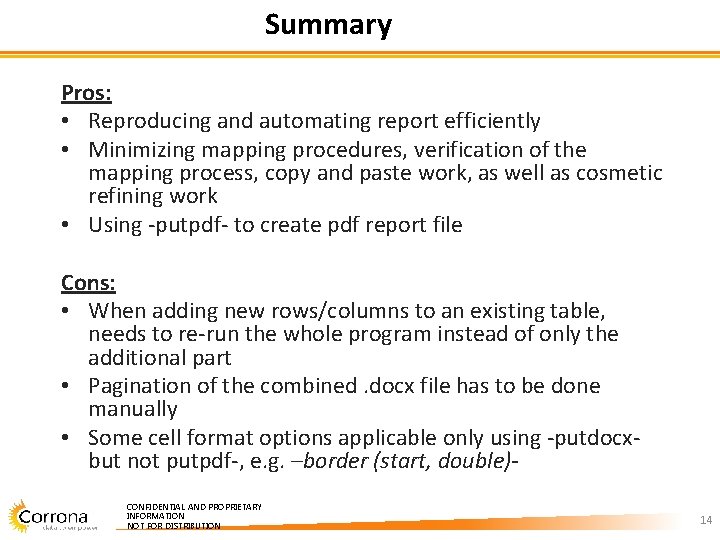
Summary Pros: • Reproducing and automating report efficiently • Minimizing mapping procedures, verification of the mapping process, copy and paste work, as well as cosmetic refining work • Using -putpdf- to create pdf report file Cons: • When adding new rows/columns to an existing table, needs to re-run the whole program instead of only the additional part • Pagination of the combined. docx file has to be done manually • Some cell format options applicable only using -putdocx- but not putpdf-, e. g. –border (start, double)CONFIDENTIAL AND PROPRIETARY INFORMATION NOT FOR DISTRIBUTION 14
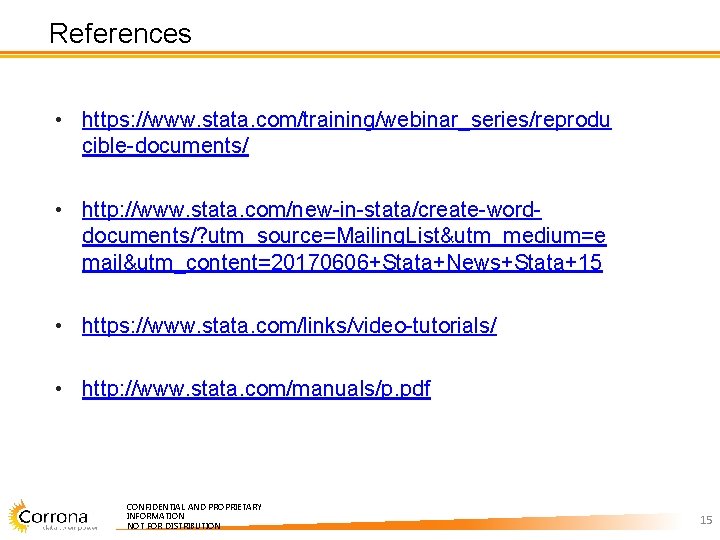
References • https: //www. stata. com/training/webinar_series/reprodu cible-documents/ • http: //www. stata. com/new-in-stata/create-worddocuments/? utm_source=Mailing. List&utm_medium=e mail&utm_content=20170606+Stata+News+Stata+15 • https: //www. stata. com/links/video-tutorials/ • http: //www. stata. com/manuals/p. pdf CONFIDENTIAL AND PROPRIETARY INFORMATION NOT FOR DISTRIBUTION 15
Automating Reports using putdocx and putpdf Questions ? Thank You ! CONFIDENTIAL AND PROPRIETARY INFORMATION NOT FOR DISTRIBUTION 16
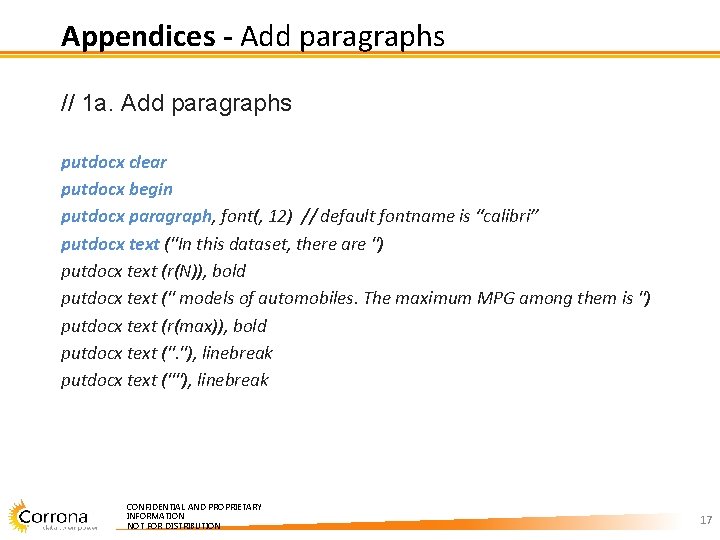
Appendices - Add paragraphs // 1 a. Add paragraphs putdocx clear putdocx begin putdocx paragraph, font(, 12) // default fontname is “calibri” putdocx text ("In this dataset, there are ") putdocx text (r(N)), bold putdocx text (" models of automobiles. The maximum MPG among them is ") putdocx text (r(max)), bold putdocx text (". "), linebreak putdocx text (""), linebreak CONFIDENTIAL AND PROPRIETARY INFORMATION NOT FOR DISTRIBUTION 17
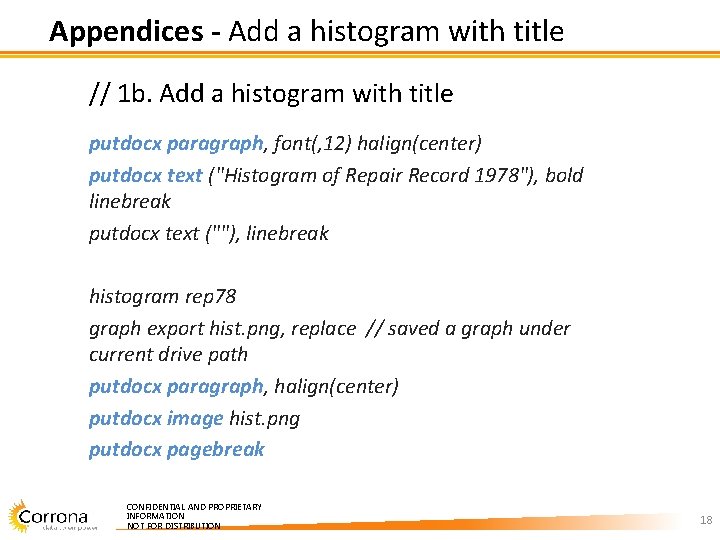
Appendices - Add a histogram with title // 1 b. Add a histogram with title putdocx paragraph, font(, 12) halign(center) putdocx text ("Histogram of Repair Record 1978"), bold linebreak putdocx text (""), linebreak histogram rep 78 graph export hist. png, replace // saved a graph under current drive path putdocx paragraph, halign(center) putdocx image hist. png putdocx pagebreak CONFIDENTIAL AND PROPRIETARY INFORMATION NOT FOR DISTRIBUTION 18
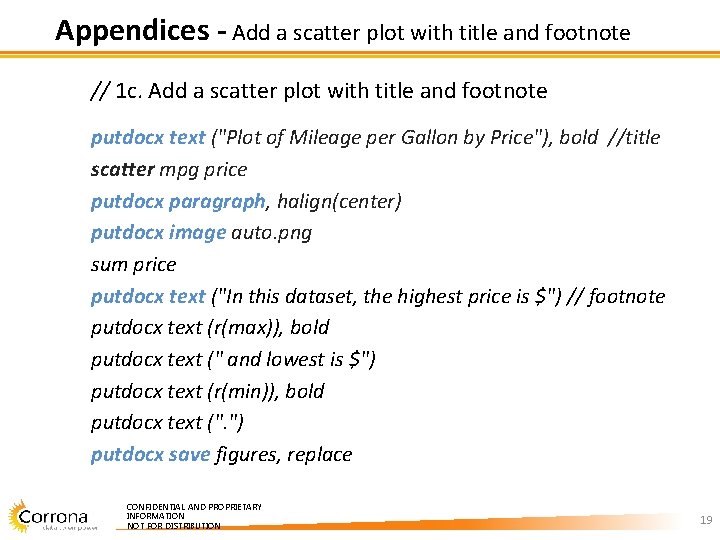
Appendices - Add a scatter plot with title and footnote // 1 c. Add a scatter plot with title and footnote putdocx text ("Plot of Mileage per Gallon by Price"), bold //title scatter mpg price putdocx paragraph, halign(center) putdocx image auto. png sum price putdocx text ("In this dataset, the highest price is $") // footnote putdocx text (r(max)), bold putdocx text (" and lowest is $") putdocx text (r(min)), bold putdocx text (". ") putdocx save figures, replace CONFIDENTIAL AND PROPRIETARY INFORMATION NOT FOR DISTRIBUTION 19
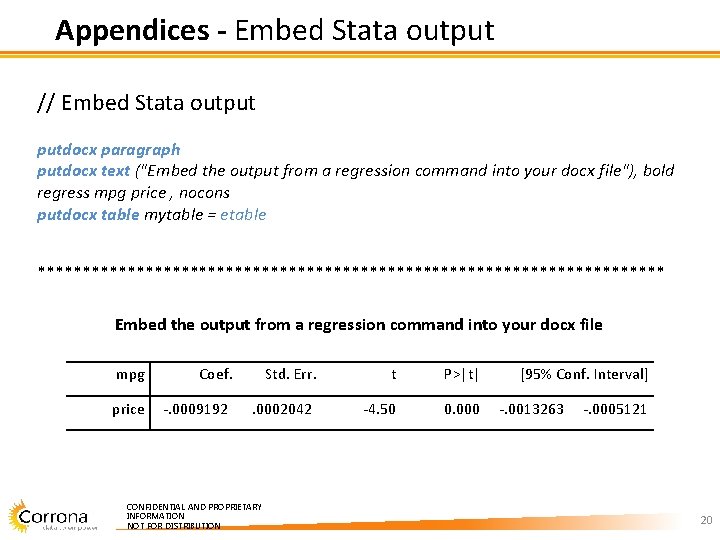
Appendices - Embed Stata output // Embed Stata output putdocx paragraph putdocx text ("Embed the output from a regression command into your docx file"), bold regress mpg price , nocons putdocx table mytable = etable *********************************** Embed the output from a regression command into your docx file mpg Coef. Std. Err. t P>|t| price -. 0009192 . 0002042 -4. 50 0. 000 CONFIDENTIAL AND PROPRIETARY INFORMATION NOT FOR DISTRIBUTION [95% Conf. Interval] -. 0013263 -. 0005121 20
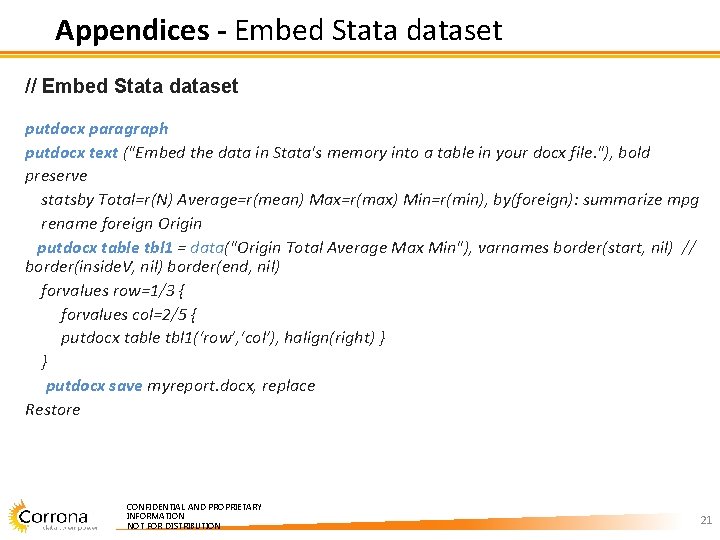
Appendices - Embed Stata dataset // Embed Stata dataset putdocx paragraph putdocx text ("Embed the data in Stata's memory into a table in your docx file. "), bold preserve statsby Total=r(N) Average=r(mean) Max=r(max) Min=r(min), by(foreign): summarize mpg rename foreign Origin putdocx table tbl 1 = data("Origin Total Average Max Min"), varnames border(start, nil) // border(inside. V, nil) border(end, nil) forvalues row=1/3 { forvalues col=2/5 { putdocx table tbl 1(‘row’, ‘col’), halign(right) } } putdocx save myreport. docx, replace Restore CONFIDENTIAL AND PROPRIETARY INFORMATION NOT FOR DISTRIBUTION 21
Word File *********************************** Embed the data in Stata's memory into a table in your docx file Origin Total Domestic Foreign 52 22 CONFIDENTIAL AND PROPRIETARY INFORMATION NOT FOR DISTRIBUTION Average MPG 19. 83 24. 77 Max MPG 34 41 Min MPG 12 14 22
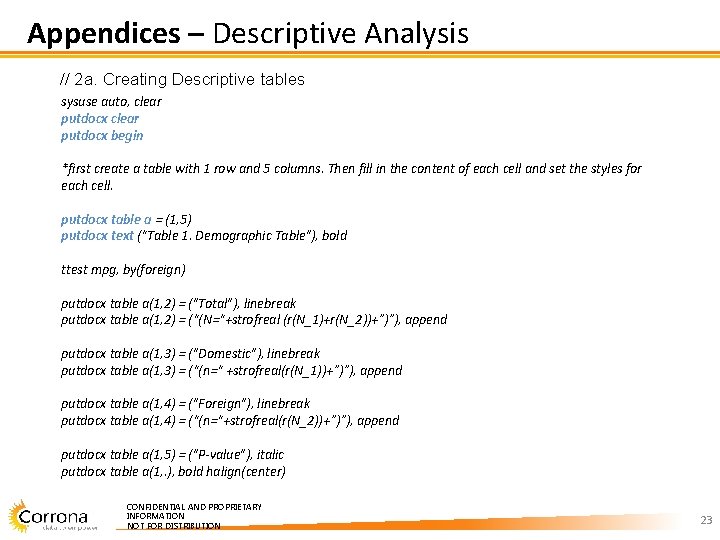
Appendices – Descriptive Analysis // 2 a. Creating Descriptive tables sysuse auto, clear putdocx begin *first create a table with 1 row and 5 columns. Then fill in the content of each cell and set the styles for each cell. putdocx table a = (1, 5) putdocx text (“Table 1. Demographic Table"), bold ttest mpg, by(foreign) putdocx table a(1, 2) = ("Total"), linebreak putdocx table a(1, 2) = (“(N=“+strofreal (r(N_1)+r(N_2))+”)”), append putdocx table a(1, 3) = ("Domestic"), linebreak putdocx table a(1, 3) = (“(n=“ +strofreal(r(N_1))+”)”), append putdocx table a(1, 4) = ("Foreign"), linebreak putdocx table a(1, 4) = (“(n=“+strofreal(r(N_2))+”)”), append putdocx table a(1, 5) = ("P-value"), italic putdocx table a(1, . ), bold halign(center) CONFIDENTIAL AND PROPRIETARY INFORMATION NOT FOR DISTRIBUTION 23
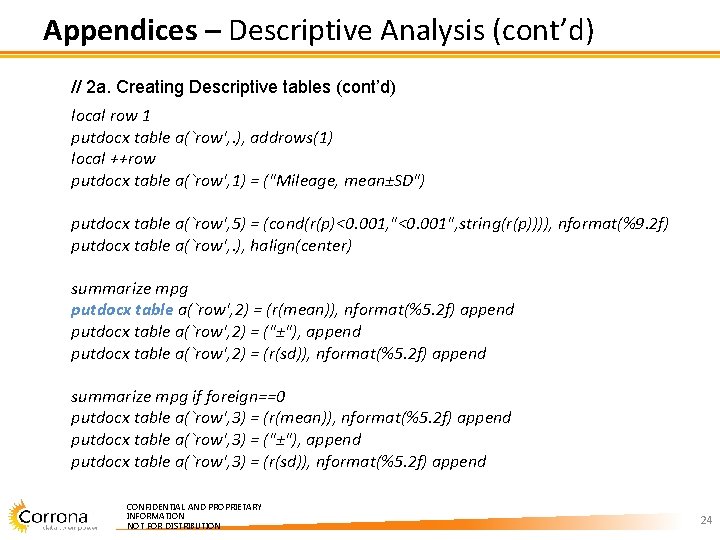
Appendices – Descriptive Analysis (cont’d) // 2 a. Creating Descriptive tables (cont’d) local row 1 putdocx table a(`row', . ), addrows(1) local ++row putdocx table a(`row', 1) = ("Mileage, mean±SD") putdocx table a(`row', 5) = (cond(r(p)<0. 001, "<0. 001", string(r(p)))), nformat(%9. 2 f) putdocx table a(`row', . ), halign(center) summarize mpg putdocx table a(`row', 2) = (r(mean)), nformat(%5. 2 f) append putdocx table a(`row', 2) = ("±"), append putdocx table a(`row', 2) = (r(sd)), nformat(%5. 2 f) append summarize mpg if foreign==0 putdocx table a(`row', 3) = (r(mean)), nformat(%5. 2 f) append putdocx table a(`row', 3) = ("±"), append putdocx table a(`row', 3) = (r(sd)), nformat(%5. 2 f) append CONFIDENTIAL AND PROPRIETARY INFORMATION NOT FOR DISTRIBUTION 24
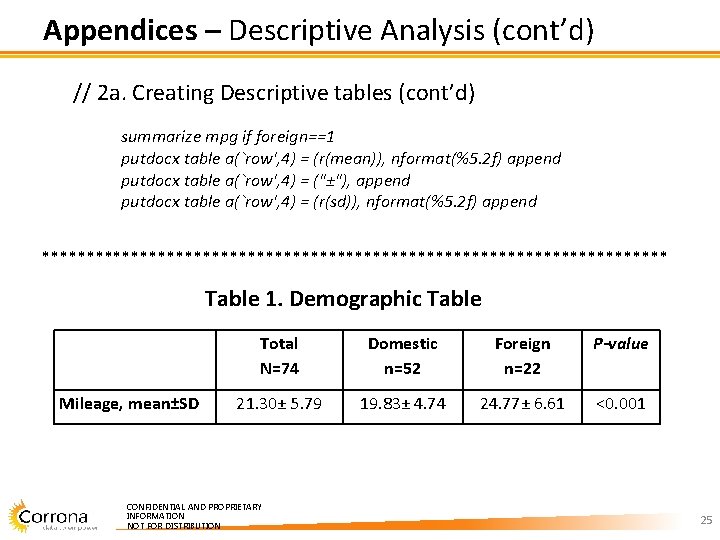
Appendices – Descriptive Analysis (cont’d) // 2 a. Creating Descriptive tables (cont’d) summarize mpg if foreign==1 putdocx table a(`row', 4) = (r(mean)), nformat(%5. 2 f) append putdocx table a(`row', 4) = ("±"), append putdocx table a(`row', 4) = (r(sd)), nformat(%5. 2 f) append *********************************** Table 1. Demographic Table Mileage, mean±SD Total N=74 Domestic n=52 Foreign n=22 P-value 21. 30± 5. 79 19. 83± 4. 74 24. 77± 6. 61 <0. 001 CONFIDENTIAL AND PROPRIETARY INFORMATION NOT FOR DISTRIBUTION 25
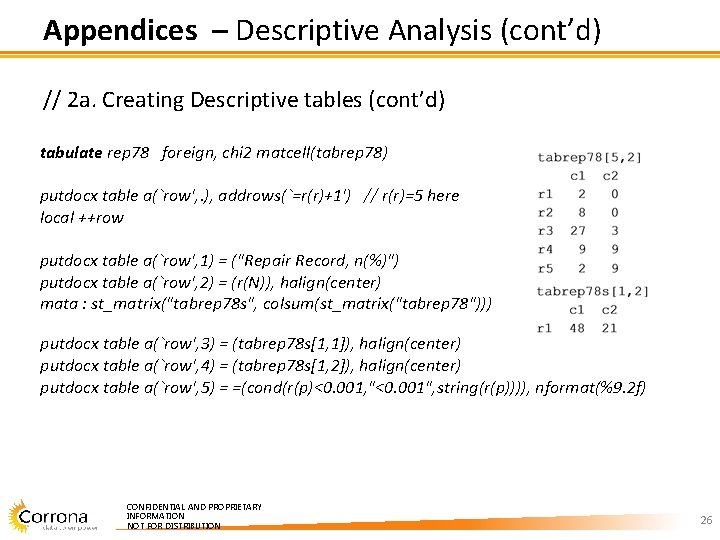
Appendices – Descriptive Analysis (cont’d) // 2 a. Creating Descriptive tables (cont’d) tabulate rep 78 foreign, chi 2 matcell(tabrep 78) putdocx table a(`row', . ), addrows(`=r(r)+1') // r(r)=5 here local ++row putdocx table a(`row', 1) = ("Repair Record, n(%)") putdocx table a(`row', 2) = (r(N)), halign(center) mata : st_matrix("tabrep 78 s", colsum(st_matrix("tabrep 78"))) putdocx table a(`row', 3) = (tabrep 78 s[1, 1]), halign(center) putdocx table a(`row', 4) = (tabrep 78 s[1, 2]), halign(center) putdocx table a(`row', 5) = =(cond(r(p)<0. 001, "<0. 001", string(r(p)))), nformat(%9. 2 f) CONFIDENTIAL AND PROPRIETARY INFORMATION NOT FOR DISTRIBUTION 26
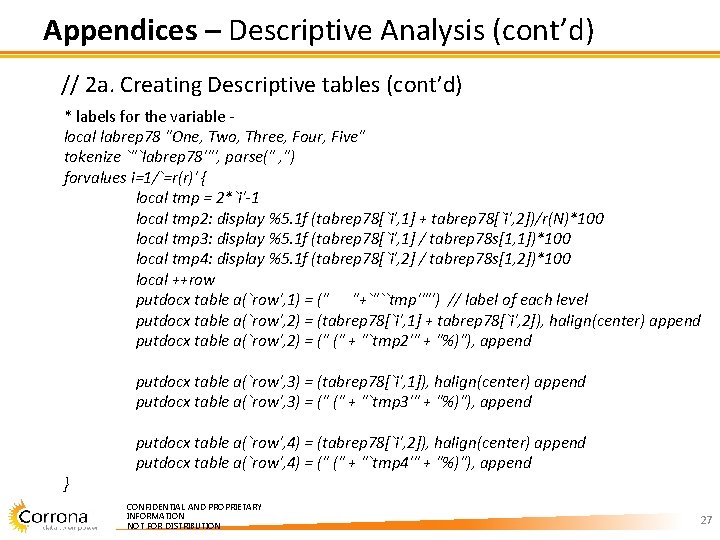
Appendices – Descriptive Analysis (cont’d) // 2 a. Creating Descriptive tables (cont’d) * labels for the variable local labrep 78 "One, Two, Three, Four, Five" tokenize `"`labrep 78'"', parse(" , ") forvalues i=1/`=r(r)' { local tmp = 2*`i'-1 local tmp 2: display %5. 1 f (tabrep 78[`i', 1] + tabrep 78[`i', 2])/r(N)*100 local tmp 3: display %5. 1 f (tabrep 78[`i', 1] / tabrep 78 s[1, 1])*100 local tmp 4: display %5. 1 f (tabrep 78[`i', 2] / tabrep 78 s[1, 2])*100 local ++row putdocx table a(`row', 1) = (" "+`"``tmp''"') // label of each level putdocx table a(`row', 2) = (tabrep 78[`i', 1] + tabrep 78[`i', 2]), halign(center) append putdocx table a(`row', 2) = (" (" + "`tmp 2'" + "%)"), append putdocx table a(`row', 3) = (tabrep 78[`i', 1]), halign(center) append putdocx table a(`row', 3) = (" (" + "`tmp 3'" + "%)"), append } putdocx table a(`row', 4) = (tabrep 78[`i', 2]), halign(center) append putdocx table a(`row', 4) = (" (" + "`tmp 4'" + "%)"), append CONFIDENTIAL AND PROPRIETARY INFORMATION NOT FOR DISTRIBUTION 27
2 a. Creating Descriptive tables Table 1. Demographic Table Total N=74 Domestic n=52 Foreign n=22 P-value Mileage, mean±SD 21. 30± 5. 79 19. 83± 4. 74 24. 77± 6. 61 <0. 001 Repair Record, n(%) 69 48 21 <0. 001 One 2 ( 2. 9%) 2 ( 4. 2%) 0 ( 0. 0%) Two 8 ( 11. 6%) 8 ( 16. 7%) 0 ( 0. 0%) Three 30 ( 43. 5%) 27 ( 56. 3%) 3 ( 14. 3%) Four 18 ( 26. 1%) 9 ( 18. 8%) 9 ( 42. 9%) Five 11 ( 15. 9%) 2 ( 4. 2%) 9 ( 42. 9%) CONFIDENTIAL AND PROPRIETARY INFORMATION NOT FOR DISTRIBUTION 28
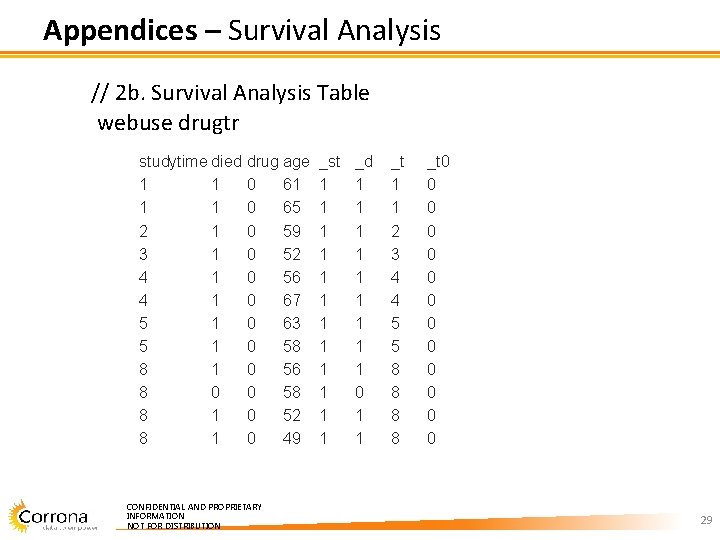
Appendices – Survival Analysis // 2 b. Survival Analysis Table webuse drugtr studytime died 1 1 2 1 3 1 4 1 5 1 8 0 8 1 drug age 0 61 0 65 0 59 0 52 0 56 0 67 0 63 0 58 0 56 0 58 0 52 0 49 CONFIDENTIAL AND PROPRIETARY INFORMATION NOT FOR DISTRIBUTION _st 1 1 1 _d 1 1 1 1 1 0 1 1 _t 1 1 2 3 4 4 5 5 8 8 _t 0 0 0 0 29
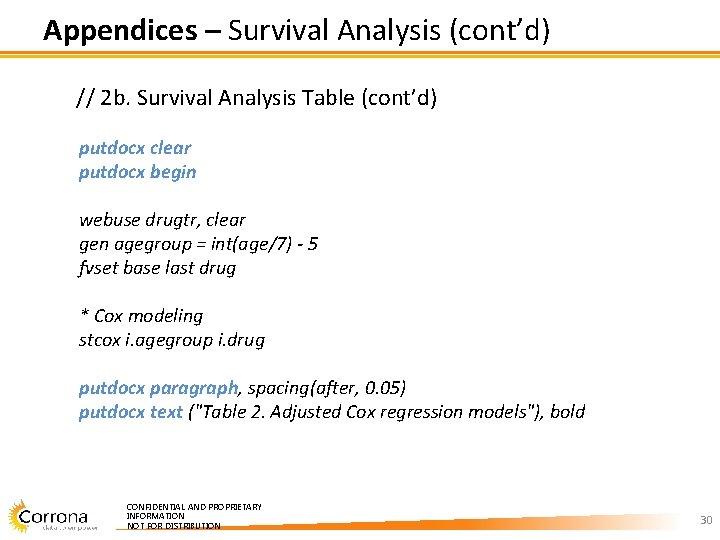
Appendices – Survival Analysis (cont’d) // 2 b. Survival Analysis Table (cont’d) putdocx clear putdocx begin webuse drugtr, clear gen agegroup = int(age/7) - 5 fvset base last drug * Cox modeling stcox i. agegroup i. drug putdocx paragraph, spacing(after, 0. 05) putdocx text ("Table 2. Adjusted Cox regression models"), bold CONFIDENTIAL AND PROPRIETARY INFORMATION NOT FOR DISTRIBUTION 30
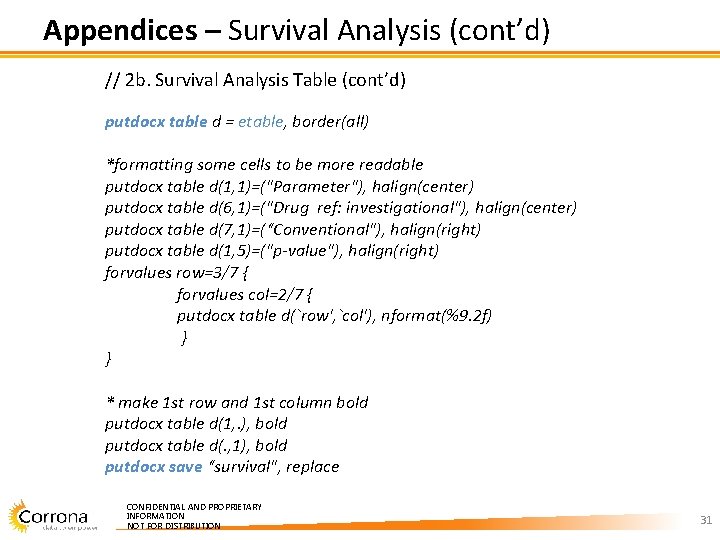
Appendices – Survival Analysis (cont’d) // 2 b. Survival Analysis Table (cont’d) putdocx table d = etable, border(all) *formatting some cells to be more readable putdocx table d(1, 1)=("Parameter"), halign(center) putdocx table d(6, 1)=("Drug ref: investigational"), halign(center) putdocx table d(7, 1)=(“Conventional"), halign(right) putdocx table d(1, 5)=("p-value"), halign(right) forvalues row=3/7 { forvalues col=2/7 { putdocx table d(`row', `col'), nformat(%9. 2 f) } } * make 1 st row and 1 st column bold putdocx table d(1, . ), bold putdocx table d(. , 1), bold putdocx save “survival", replace CONFIDENTIAL AND PROPRIETARY INFORMATION NOT FOR DISTRIBUTION 31
2 b. Survival Analysis Table 2 b. Adjusted Cox regression models Parameter Haz. Ratio Std. Err. z p-value 1. 66 1. 80 0. 47 0. 64 0. 20 13. 96 56 -62 2. 67 2. 83 0. 92 0. 36 0. 33 21. 38 63 -69 14. 32 16. 79 2. 27 0. 02 1. 44 142. 62 8. 90 4. 13 4. 71 <0. 01 3. 58 22. 10 Agegroup: ref. : 47 -48 49 -55 Drug: [95% Conf. Interval] Ref: investigational Placebo CONFIDENTIAL AND PROPRIETARY INFORMATION NOT FOR DISTRIBUTION 32
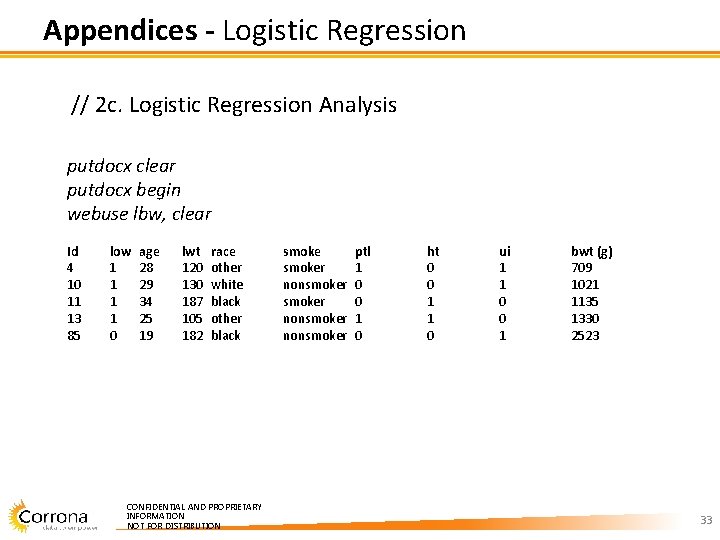
Appendices - Logistic Regression // 2 c. Logistic Regression Analysis putdocx clear putdocx begin webuse lbw, clear Id low 4 1 10 1 11 1 13 1 85 0 age lwt 28 120 29 130 34 187 25 105 19 182 race other white black other black CONFIDENTIAL AND PROPRIETARY INFORMATION NOT FOR DISTRIBUTION smoker nonsmoker ptl 1 0 0 1 0 ht 0 0 1 1 0 ui 1 1 0 0 1 bwt (g) 709 1021 1135 1330 2523 33
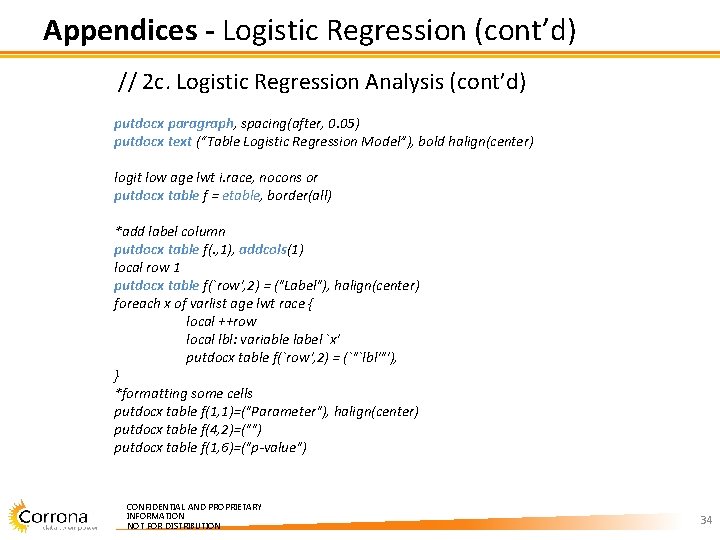
Appendices - Logistic Regression (cont’d) // 2 c. Logistic Regression Analysis (cont’d) putdocx paragraph, spacing(after, 0. 05) putdocx text (“Table Logistic Regression Model”), bold halign(center) logit low age lwt i. race, nocons or putdocx table f = etable, border(all) *add label column putdocx table f(. , 1), addcols(1) local row 1 putdocx table f(`row', 2) = ("Label"), halign(center) foreach x of varlist age lwt race { local ++row local lbl: variable label `x' putdocx table f(`row', 2) = (`"`lbl'"'), } *formatting some cells putdocx table f(1, 1)=("Parameter"), halign(center) putdocx table f(4, 2)=("") putdocx table f(1, 6)=("p-value") CONFIDENTIAL AND PROPRIETARY INFORMATION NOT FOR DISTRIBUTION 34
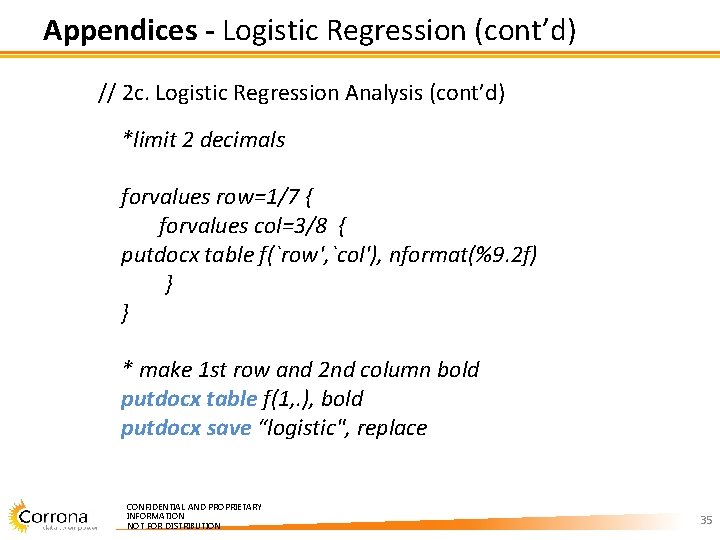
Appendices - Logistic Regression (cont’d) // 2 c. Logistic Regression Analysis (cont’d) *limit 2 decimals forvalues row=1/7 { forvalues col=3/8 { putdocx table f(`row', `col'), nformat(%9. 2 f) } } * make 1 st row and 2 nd column bold putdocx table f(1, . ), bold putdocx save “logistic", replace CONFIDENTIAL AND PROPRIETARY INFORMATION NOT FOR DISTRIBUTION 35
2 c. Logistic Regression Analysis Table 2 c. Logistic Regression Analysis Parameter Odds Ratio %95 CI lower limit %95 CI upper limit p-value age 1. 00 0. 95 1. 05 0. 99 weight 0. 99 0. 98 1. 00 0. 05 race: black(ref) 1. 00 Other 2. 88 1. 10 7. 52 0. 03 White 1. 83 0. 95 3. 53 0. 07 CONFIDENTIAL AND PROPRIETARY INFORMATION NOT FOR DISTRIBUTION 36
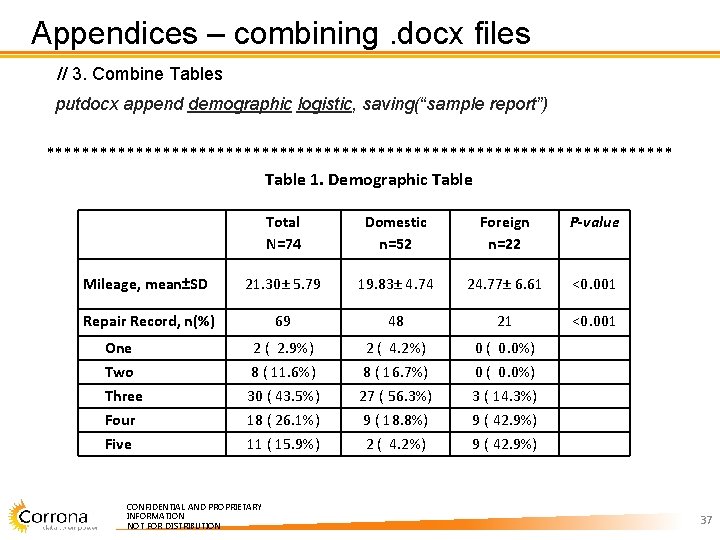
Appendices – combining. docx files // 3. Combine Tables putdocx append demographic logistic, saving(“sample report”) *********************************** Table 1. Demographic Table Total N=74 Domestic n=52 Foreign n=22 P-value Mileage, mean±SD 21. 30± 5. 79 19. 83± 4. 74 24. 77± 6. 61 <0. 001 Repair Record, n(%) 69 48 21 <0. 001 2 ( 2. 9%) 8 ( 11. 6%) 30 ( 43. 5%) 18 ( 26. 1%) 11 ( 15. 9%) 2 ( 4. 2%) 8 ( 16. 7%) 27 ( 56. 3%) 9 ( 18. 8%) 2 ( 4. 2%) 0 ( 0. 0%) 3 ( 14. 3%) 9 ( 42. 9%) One Two Three Four Five CONFIDENTIAL AND PROPRIETARY INFORMATION NOT FOR DISTRIBUTION 37
Appendices – combining. docx files (cont’d) Table 3. Logistic Regression Model Parameter Odds Ratio age weight race: black(ref) 1. 00 0. 99 Other White 2. 88 1. 83 %95 lower %95 upper confidence limit p-value 0. 95 0. 98 1. 05 1. 00 0. 99 0. 05 1. 10 0. 95 7. 52 3. 53 0. 07 1. 00 CONFIDENTIAL AND PROPRIETARY INFORMATION NOT FOR DISTRIBUTION 38