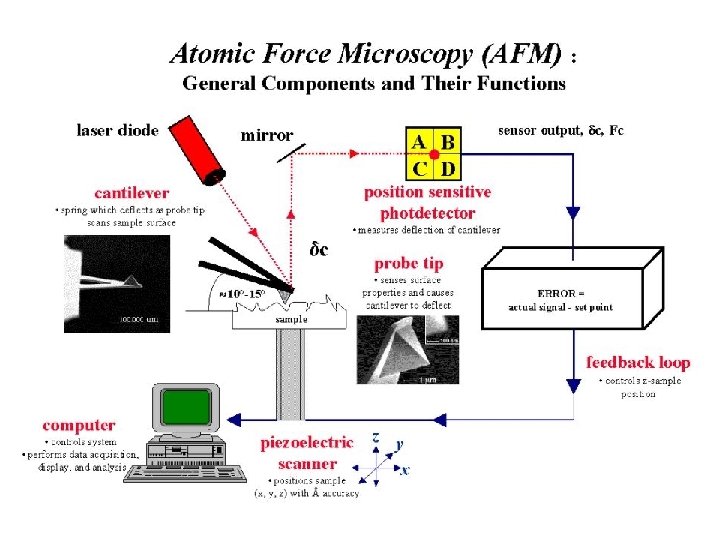
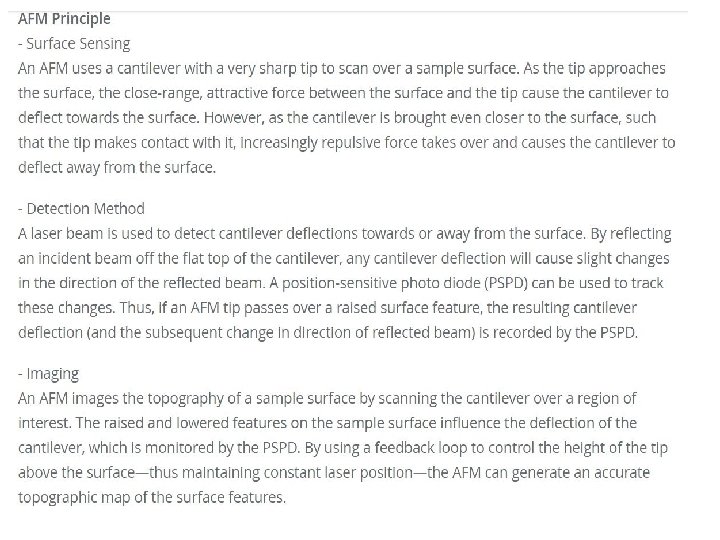
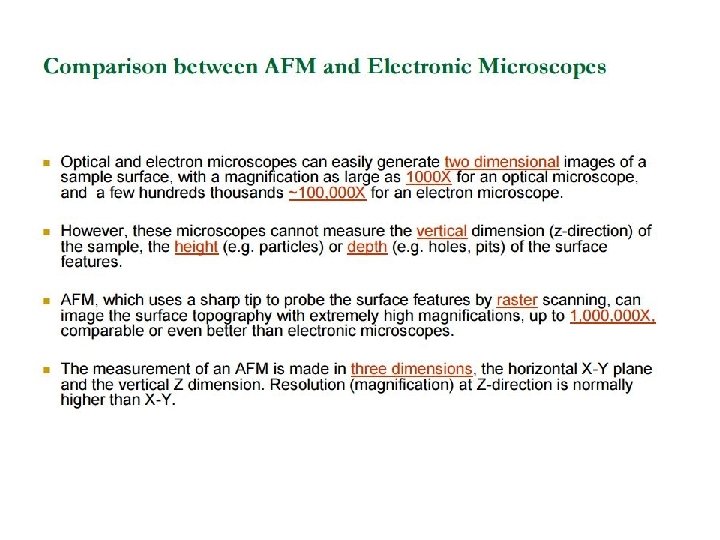
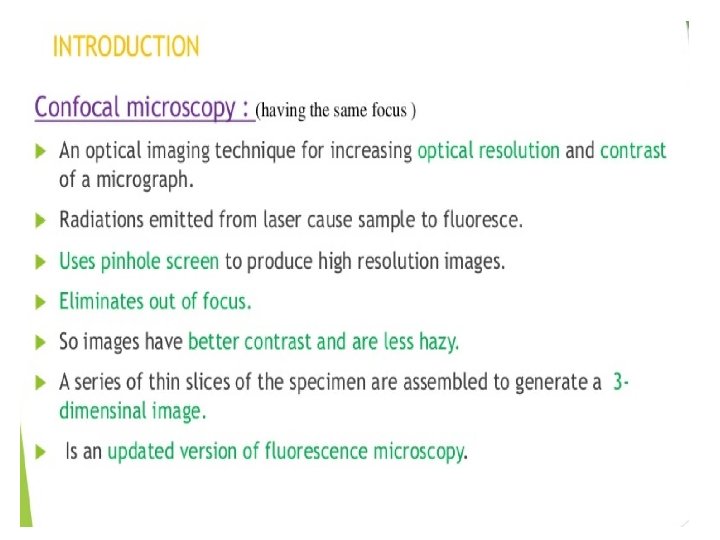
Atomic Force Microscopy Confocal Microscopy Differential Interference Contrast

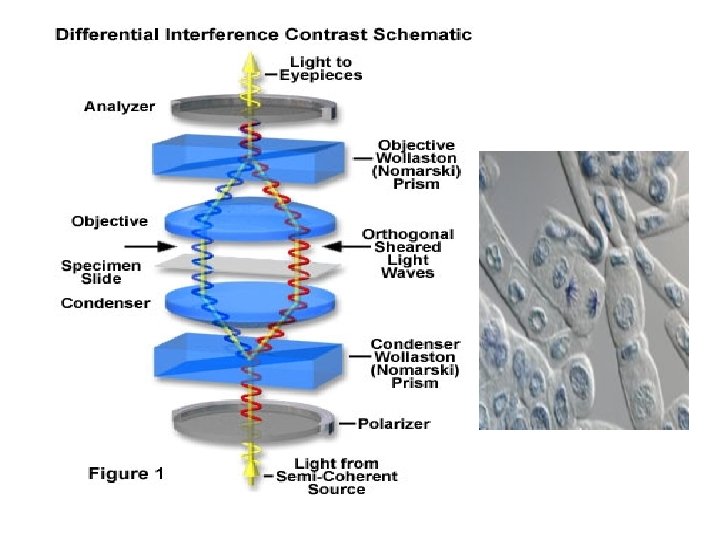
 microscopy • Similar in some respects to phase contrast microscopy,")
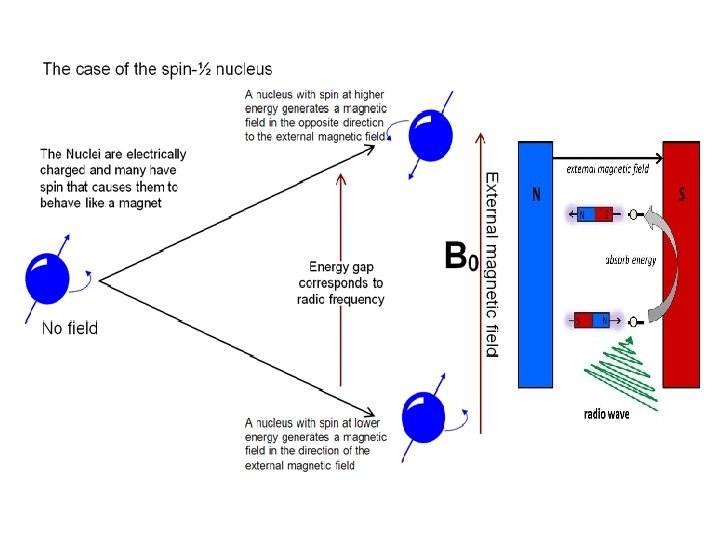
 Nuclear magnetic resonance (NMR) is based upon the measurement of absorption")
 or symmetric chromophores in asymmetric environments")


- Slides: 23
• • • Atomic Force Microscopy Confocal Microscopy Differential Interference Contrast Microscopy Nuclear Magnetic Resonance Spectroscopy Circular Di-chroism Spectroscopy Mass Spectroscopy Dr. Christo Rajan Asst. Professor Dept of Zoology Mar Thoma College, Thiruvalla
Differential Interference contrast (Nomarsky) microscopy • Similar in some respects to phase contrast microscopy, differential interference contrast microscopy allows transparent objects to be seen by using the difference in light’s refraction when transmitted through the varying thicknesses of a specimen. • This technique gives a greater depth of focus allowing thicker specimens to be observed under higher magnifications. • Producing a monochromatic image, areas of the object appear brighter as the optical path of the transmitted light increases and darker in areas of decreased length of optical path. • A major advantage of the differential interference contrast technique is in examining living specimens when normal biological processes might be impeded by normal staining procedures. • A drawback to this type of imaging is that the three-dimensional image of a specimen may not be accurate. • The enhanced areas of light and shadow might add distortion to the appearance of the image.
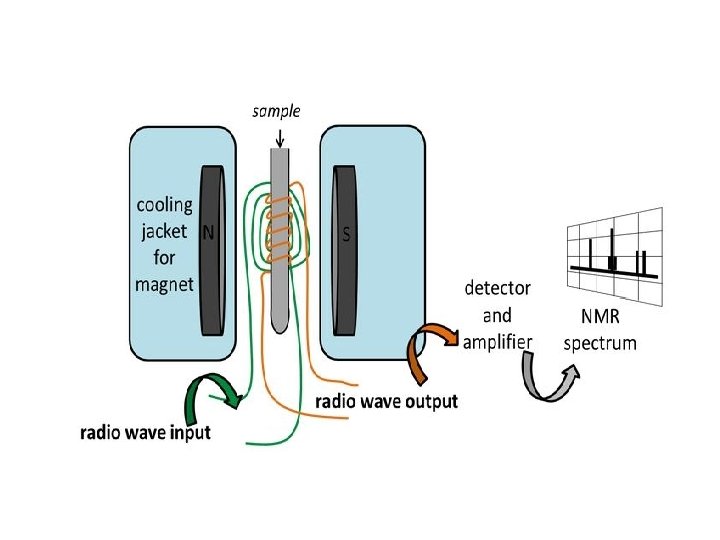
NMR(Nuclear magnetic resonance) Nuclear magnetic resonance (NMR) is based upon the measurement of absorption of radiofrequency (RF) radiation by a nucleus in a strong magnetic field.
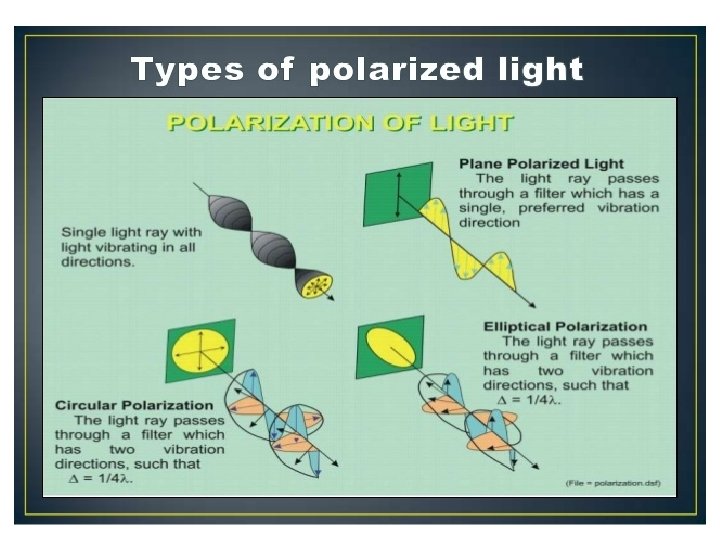
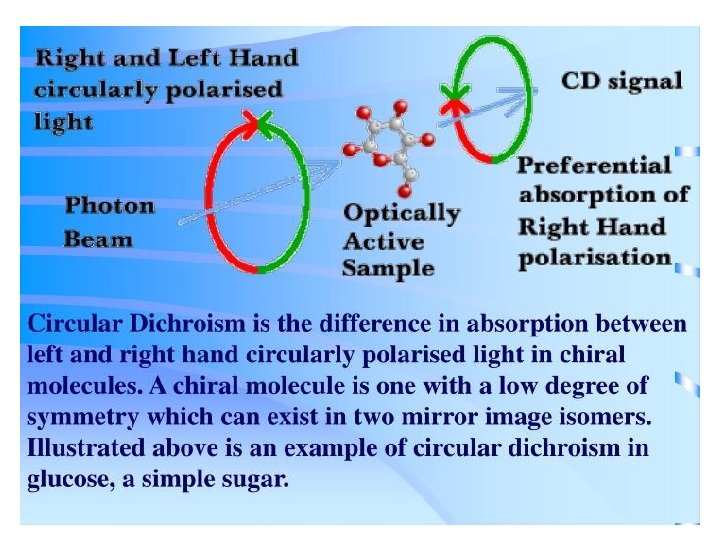
Circular Dichroism Spectroscopy • Inherently asymmetric chromophores (uncommon) or symmetric chromophores in asymmetric environments will interact differently with right- and left-circularly polarized light resulting in two related phenomena. • Circularly-polarized light rays will travel through an optically active medium with different velocities due to the different indices of refraction for right- and left-circularly polarized light called optical rotation or circular birefringence. • The variation of optical rotation as a function of wavelength is called optical rotary dispersion (ORD). • Right- and left-circularly polarized light will also be absorbed to different extents at some wavelengths due to differences in extinction coefficients for the two polarized rays called circular dichroism (CD). • Optical rotary dispersion enables a chiral molecule to rotate the plane of polarized light.
• The differential absorption of radiation polarized in two directions as function of frequency is called dichroism. • When applied to plane polarized light, this is called linear dichroism; for circularly polarized light, circular dichroism. • The phenomenon of circular dichroism is very sensitive to the secondary structure of polypeptides and proteins • It has been shown that CD spectra between 260 and approximately 180 nm can be analyzed for the different secondary structural types: alpha helix, parallel and antiparallel beta sheet, turn, and other.
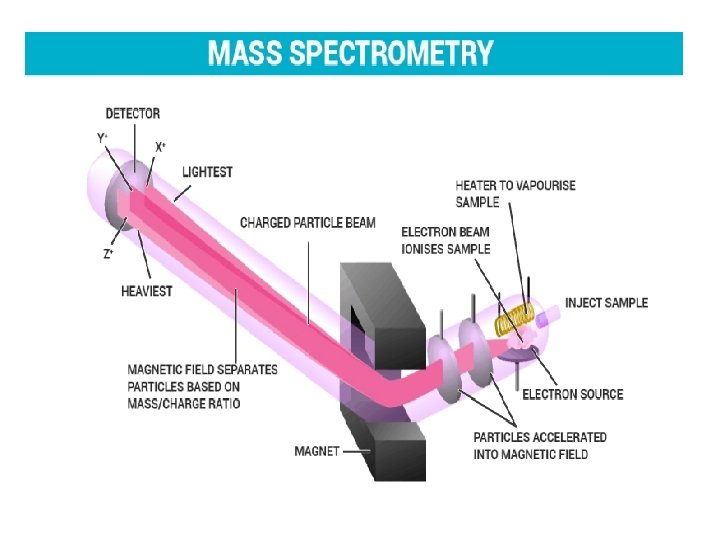
Mass Spectrometry • • • Mass spectrometry is a powerful analytical technique used to quantify known materials, to identify unknown compounds within a sample. The complete process involves the conversion of the sample into gaseous ions, with or without fragmentation, which are then characterized by their mass to charge ratios (m/z) and relative abundances. The first step in the mass spectrometric analysis of compounds is the production of gas phase ions of the compound, basically by electron ionization. This molecular ion undergoes fragmentation. Each primary product ion derived from the molecular ion, in turn, undergoes fragmentation, and so on. The ions are separated in the mass spectrometer according to their mass-tocharge ratio, and are detected in proportion to their abundance. A mass spectrum of the molecule is thus produced. It displays the result in the form of a plot of ion abundance versus mass-to-charge ratio. Ions provide information concerning the nature and the structure of their precursor molecule. In the spectrum of a pure compound, the molecular ion, if present, appears at the highest value of m/z (followed by ions containing heavier isotopes) and gives the molecular mass of the compound.
• • • A mass spectrum of the molecule is thus produced. It displays the result in the form of a plot of ion abundance versus mass-to-charge ratio. Ions provide information concerning the nature and the structure of their precursor molecule. In the spectrum of a pure compound, the molecular ion, if present, appears at the highest value of m/z (followed by ions containing heavier isotopes) and gives the molecular mass of the compound. Components The instrument consists of three major components: – Ion Source: For producing gaseous ions from the substance being studied. – Analyzer: For resolving the ions into their characteristics mass components according to their mass-to-charge ratio. – Detector System: For detecting the ions and recording the relative abundance of each of the resolved ionic species. – In addition, a sample introduction system is necessary to admit the samples to be studied to the ion source while maintaining the high vacuum requirements (~10 -6 to 108 mm of mercury) of the technique; and a computer is required to control the instrument, acquire and manipulate data, and compare spectra to reference libraries.
THANK YOU