
Lecture 10 RICS and FLIM Enrico Gratton Laboratory
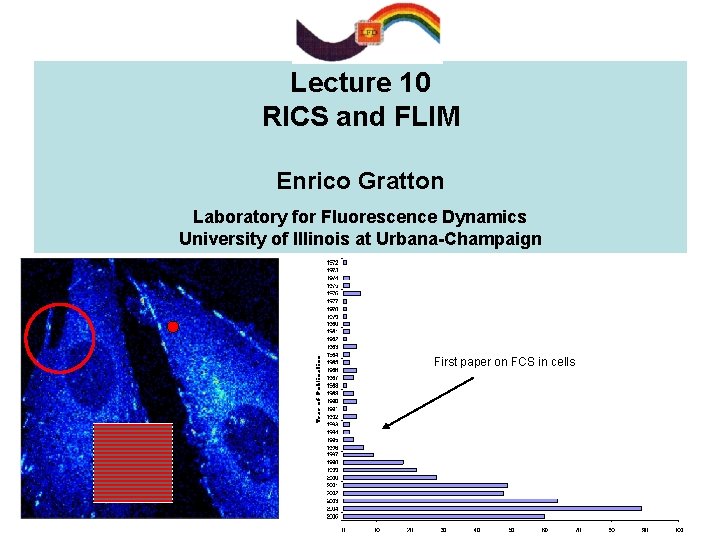
Lecture 10 RICS and FLIM Enrico Gratton Laboratory for Fluorescence Dynamics University of Illinois at Urbana-Champaign First paper on FCS in cells
INTRODUCTION Fluctuation Spectroscopy in cells is rapidly expanding Advantages and challenges of FCS in cells C Single point autocorrelation and cross-correlation provide information on molecular mobility and interactions C PCH provides information on molecular concentration and brightness. Titration experiments in cells C Most studies use fluorescent proteins D Single point FCS is difficult to interpret D Immobile fraction and bleaching perturb the correlation function Negative-going correlation curves Different cell locations show different dynamics!
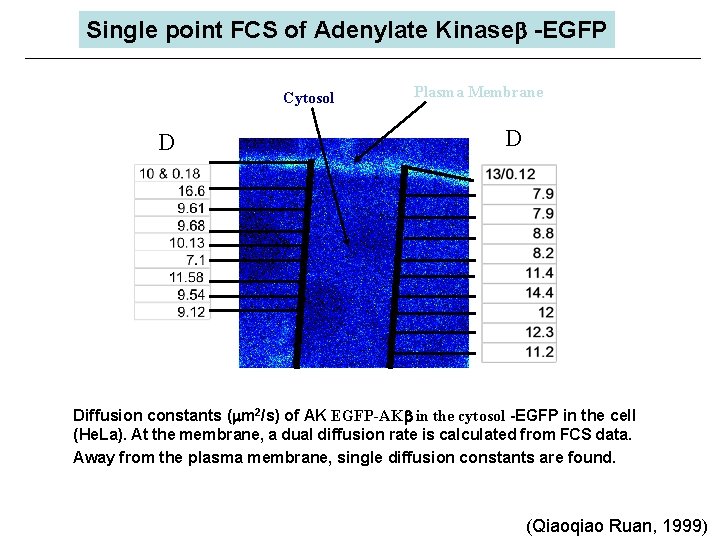
Single point FCS of Adenylate Kinaseb -EGFP Cytosol D Plasma Membrane D Diffusion constants ( m 2/s) of AK EGFP-AKb in the cytosol -EGFP in the cell (He. La). At the membrane, a dual diffusion rate is calculated from FCS data. Away from the plasma membrane, single diffusion constants are found. (Qiaoqiao Ruan, 1999)
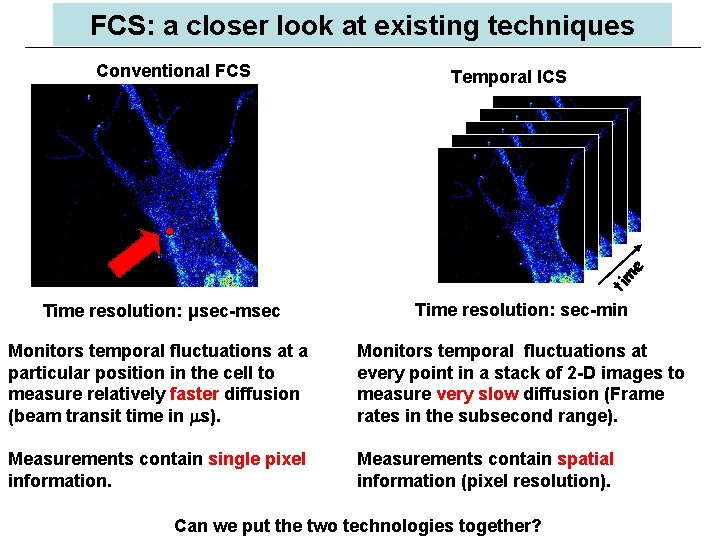
FCS: a closer look at existing techniques Temporal ICS ti m e Conventional FCS Time resolution: μsec-msec Time resolution: sec-min Monitors temporal fluctuations at a particular position in the cell to measure relatively faster diffusion (beam transit time in s). Monitors temporal fluctuations at every point in a stack of 2 -D images to measure very slow diffusion (Frame rates in the subsecond range). Measurements contain single pixel information. Measurements contain spatial information (pixel resolution). Can we put the two technologies together?
FCS in cells: Challenges Need for spatial resolution: Spatio-temporal correlations ØFew years ago we proposed scanning FCS (circular orbit) as a method to measure the correlation function at several points in a cell simultaneously (Berland et al, 1995) ØN. Petersen and P. Wiseman proposed image correlation spectroscopy (ICS) and recently, time-resolved ICS, similar in concept of scanning FCS in which a point in the image is measured repetitively These methods have very high spatial resolution but limited time resolution Scanning correlation in the millisecond Image correlation in the sub-second Can we improve the temporal resolution to the level that we can measure freely diffusing molecules, and at the same time have high (pixel) spatial resolution?
FCS: novel ideas The quick answer is not yet, but we can have a combination of very high time resolution with good spatial resolution. In addition, there are other major benefits of the technique I will present: ØIt can be done with commercial laser scanning microscopes (either one or two photon systems) ØIt can be done with analog detection, as well as with photon counting systems, although the statistics is different ØThe new technique provides a simple method to account for the immobile fraction ØIt provides a powerful method to distinguish diffusion from binding How does it work?
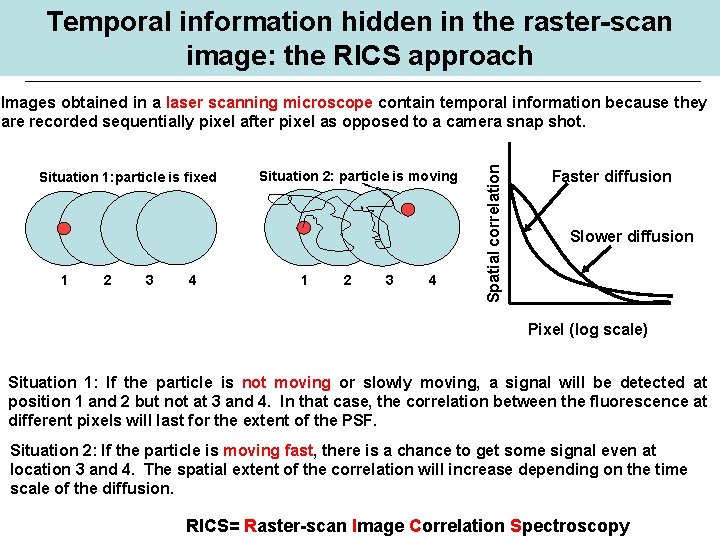
Temporal information hidden in the raster-scan image: the RICS approach Situation 1: particle is fixed 1 2 3 4 Situation 2: particle is moving 1 2 3 4 Spatial correlation Images obtained in a laser scanning microscope contain temporal information because they are recorded sequentially pixel after pixel as opposed to a camera snap shot. Faster diffusion Slower diffusion Pixel (log scale) Situation 1: If the particle is not moving or slowly moving, a signal will be detected at position 1 and 2 but not at 3 and 4. In that case, the correlation between the fluorescence at different pixels will last for the extent of the PSF. Situation 2: If the particle is moving fast, there is a chance to get some signal even at location 3 and 4. The spatial extent of the correlation will increase depending on the time scale of the diffusion. RICS= Raster-scan Image Correlation Spectroscopy
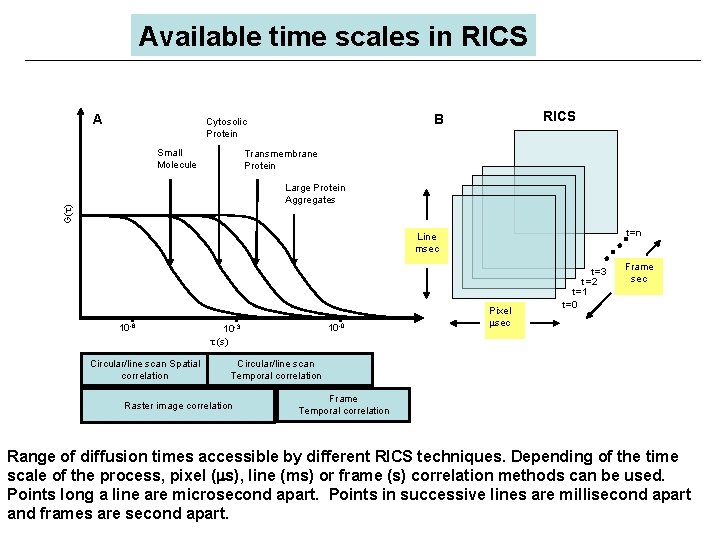
Available time scales in RICS A Small Molecule RICS B Cytosolic Protein Transmembrane Protein G( ) Large Protein Aggregates t=n Line msec 10 -6 Circular/line scan Spatial correlation 10 -0 10 -3 (s) Pixel sec t=3 t=2 t=1 t=0 Frame sec Circular/line scan Temporal correlation Raster image correlation Frame Temporal correlation Range of diffusion times accessible by different RICS techniques. Depending of the time scale of the process, pixel ( s), line (ms) or frame (s) correlation methods can be used. Points long a line are microsecond apart. Points in successive lines are millisecond apart and frames are second apart.
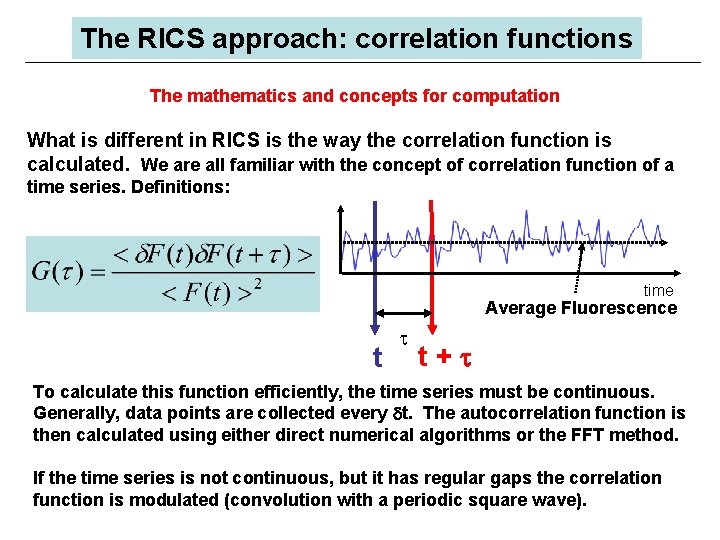
The RICS approach: correlation functions The mathematics and concepts for computation What is different in RICS is the way the correlation function is calculated. We are all familiar with the concept of correlation function of a time series. Definitions: time Average Fluorescence t t+t To calculate this function efficiently, the time series must be continuous. Generally, data points are collected every dt. The autocorrelation function is then calculated using either direct numerical algorithms or the FFT method. If the time series is not continuous, but it has regular gaps the correlation function is modulated (convolution with a periodic square wave).
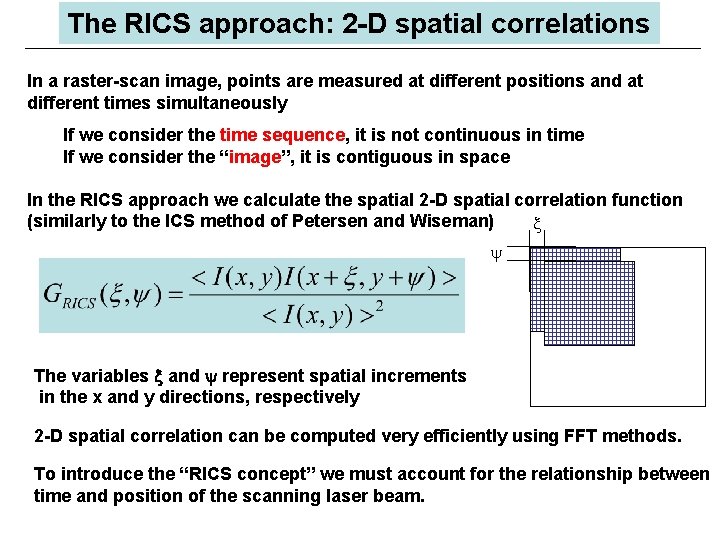
The RICS approach: 2 -D spatial correlations In a raster-scan image, points are measured at different positions and at different times simultaneously If we consider the time sequence, it is not continuous in time If we consider the “image”, it is contiguous in space In the RICS approach we calculate the spatial 2 -D spatial correlation function (similarly to the ICS method of Petersen and Wiseman) x y The variables x and y represent spatial increments in the x and y directions, respectively 2 -D spatial correlation can be computed very efficiently using FFT methods. To introduce the “RICS concept” we must account for the relationship between time and position of the scanning laser beam.
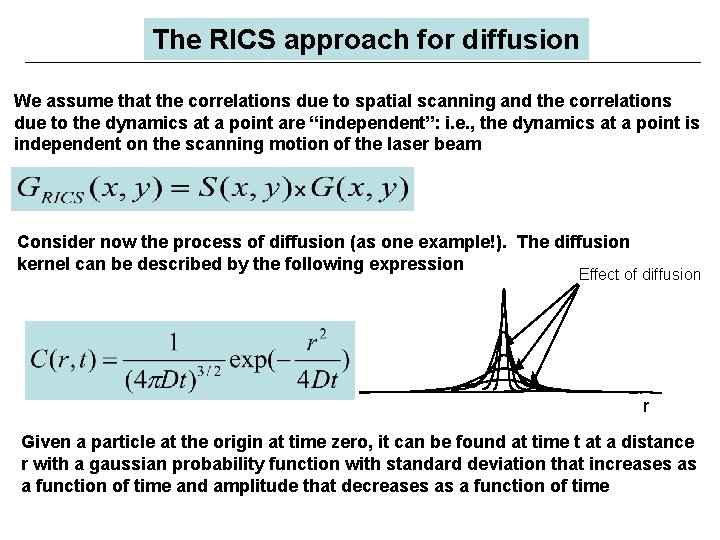
The RICS approach for diffusion We assume that the correlations due to spatial scanning and the correlations due to the dynamics at a point are “independent”: i. e. , the dynamics at a point is independent on the scanning motion of the laser beam Consider now the process of diffusion (as one example!). The diffusion kernel can be described by the following expression Effect of diffusion r Given a particle at the origin at time zero, it can be found at time t at a distance r with a gaussian probability function with standard deviation that increases as a function of time and amplitude that decreases as a function of time
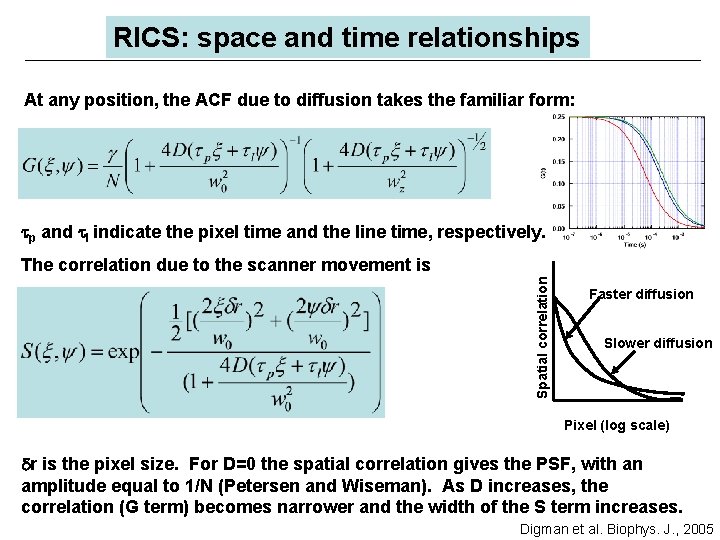
RICS: space and time relationships At any position, the ACF due to diffusion takes the familiar form: tp and tl indicate the pixel time and the line time, respectively. Spatial correlation The correlation due to the scanner movement is Faster diffusion Slower diffusion Pixel (log scale) dr is the pixel size. For D=0 the spatial correlation gives the PSF, with an amplitude equal to 1/N (Petersen and Wiseman). As D increases, the correlation (G term) becomes narrower and the width of the S term increases. Digman et al. Biophys. J. , 2005
Performing a RICS measurement Setup: any laser confocal microscope ØAcquire a raster scan image with a pixel time generally in the microsecond range and a line scan time in the millisecond range. ØCalculate the 2 -D spatial correlation (or RICS analysis). ØFit the 2 -D autocorrelation with the previous equations. ØFor circular or line scanning represent data as pseudo-image, one coordinate being spatial (along the line) and the other being time. This representation allows us to use the RICS approach. The fitting expressions are slightly different (see Digman et al, BJ 2005).
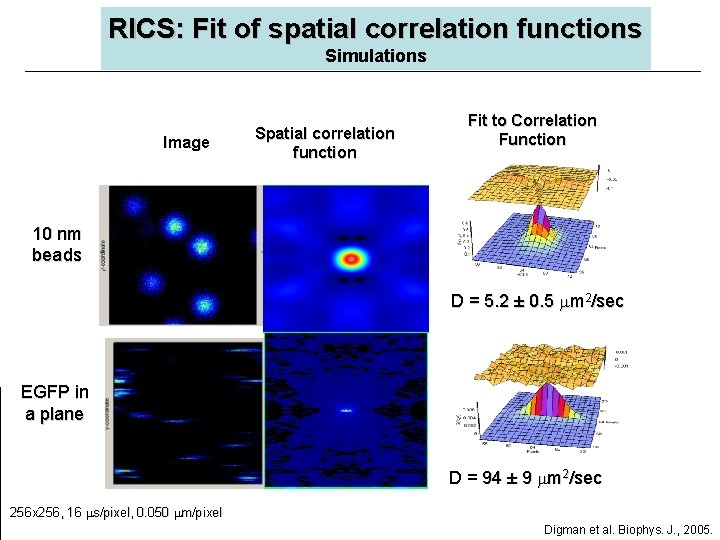
RICS: Fit of spatial correlation functions Simulations Image Spatial correlation function Fit to Correlation Function 10 nm beads D = 5. 2 ± 0. 5 m 2/sec EGFP in a plane D = 94 ± 9 m 2/sec 256 x 256, 16 s/pixel, 0. 050 m/pixel Digman et al. Biophys. J. , 2005.
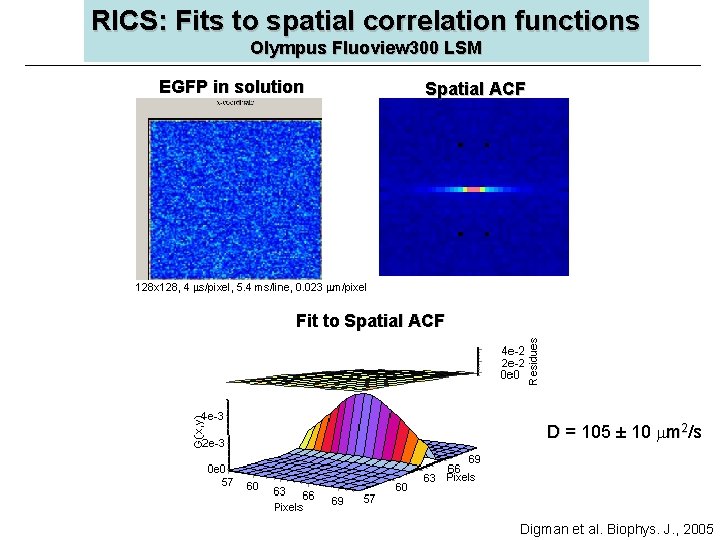
RICS: Fits to spatial correlation functions Olympus Fluoview 300 LSM EGFP in solution Spatial ACF 128 x 128, 4 s/pixel, 5. 4 ms/line, 0. 023 m/pixel Fit to Spatial ACF D = 105 ± 10 m 2/s Digman et al. Biophys. J. , 2005
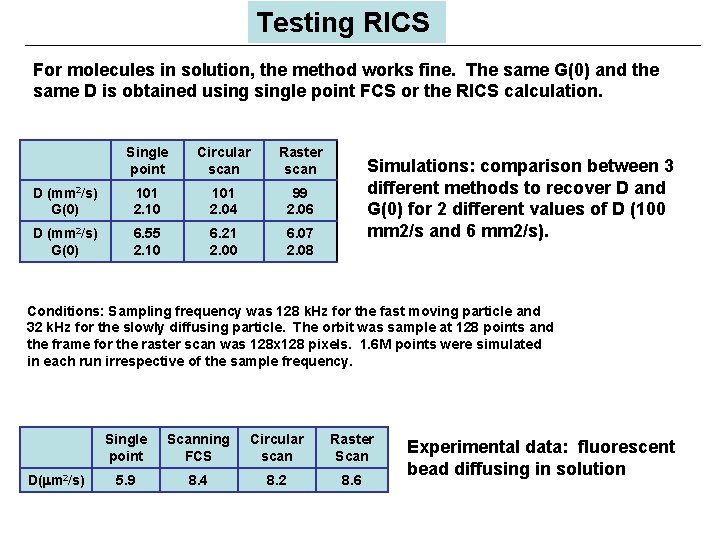
Testing RICS For molecules in solution, the method works fine. The same G(0) and the same D is obtained usingle point FCS or the RICS calculation. Single point Circular scan Raster scan D (mm 2/s) G(0) 101 2. 10 101 2. 04 99 2. 06 D (mm 2/s) G(0) 6. 55 2. 10 6. 21 2. 00 6. 07 2. 08 Simulations: comparison between 3 different methods to recover D and G(0) for 2 different values of D (100 mm 2/s and 6 mm 2/s). Conditions: Sampling frequency was 128 k. Hz for the fast moving particle and 32 k. Hz for the slowly diffusing particle. The orbit was sample at 128 points and the frame for the raster scan was 128 x 128 pixels. 1. 6 M points were simulated in each run irrespective of the sample frequency. D( m 2/s) Single point Scanning FCS Circular scan Raster Scan 5. 9 8. 4 8. 2 8. 6 Experimental data: fluorescent bead diffusing in solution
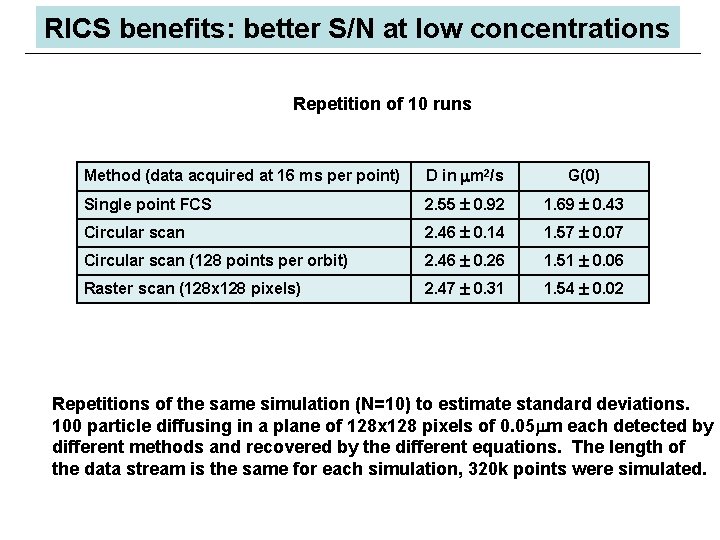
RICS benefits: better S/N at low concentrations Repetition of 10 runs Method (data acquired at 16 ms per point) D in m 2/s G(0) Single point FCS 2. 55 0. 92 1. 69 0. 43 Circular scan 2. 46 0. 14 1. 57 0. 07 Circular scan (128 points per orbit) 2. 46 0. 26 1. 51 0. 06 Raster scan (128 x 128 pixels) 2. 47 0. 31 1. 54 0. 02 Repetitions of the same simulation (N=10) to estimate standard deviations. 100 particle diffusing in a plane of 128 x 128 pixels of 0. 05 m each detected by different methods and recovered by the different equations. The length of the data stream is the same for each simulation, 320 k points were simulated.
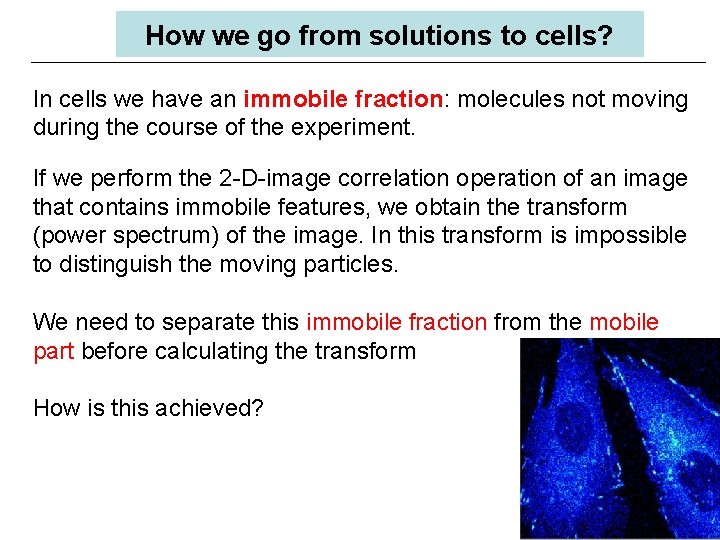
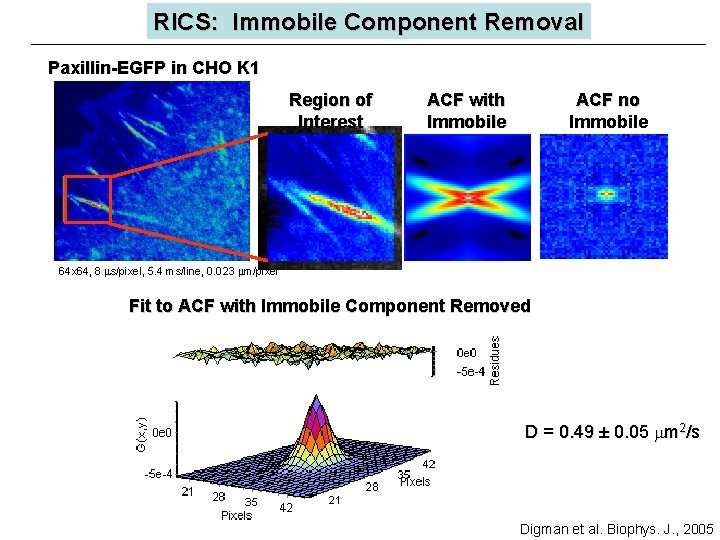
How we go from solutions to cells? In cells we have an immobile fraction: molecules not moving during the course of the experiment. If we perform the 2 -D-image correlation operation of an image that contains immobile features, we obtain the transform (power spectrum) of the image. In this transform is impossible to distinguish the moving particles. We need to separate this immobile fraction from the mobile part before calculating the transform How is this achieved?
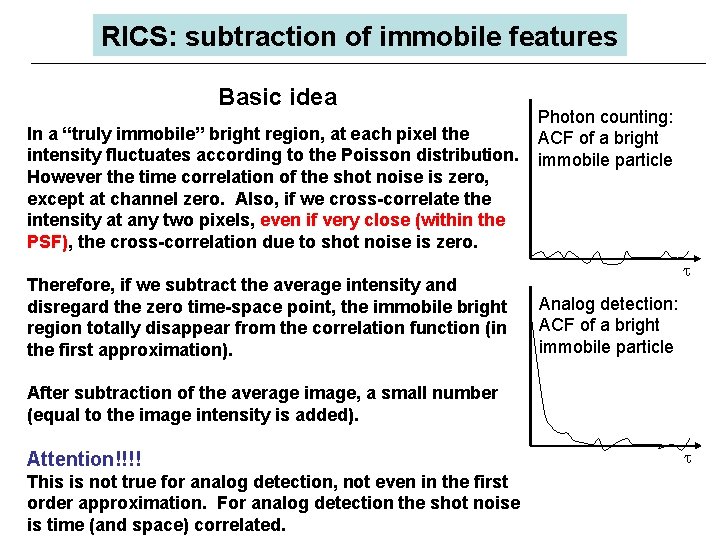
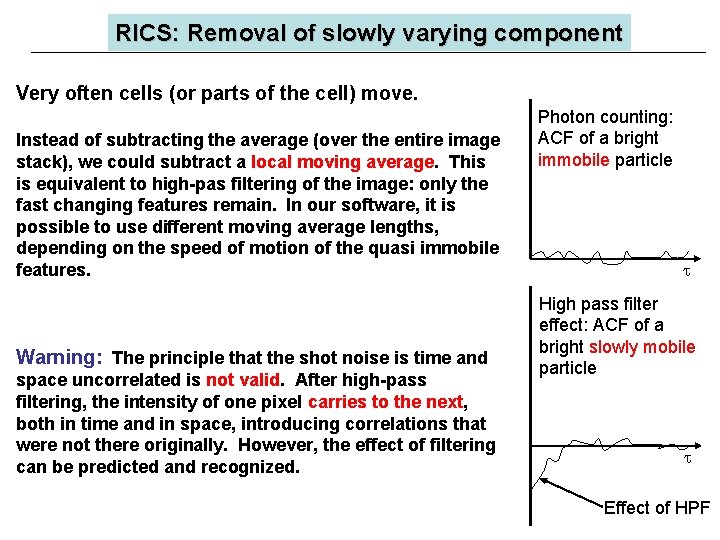
RICS: subtraction of immobile features Basic idea In a “truly immobile” bright region, at each pixel the intensity fluctuates according to the Poisson distribution. However the time correlation of the shot noise is zero, except at channel zero. Also, if we cross-correlate the intensity at any two pixels, even if very close (within the PSF), the cross-correlation due to shot noise is zero. Therefore, if we subtract the average intensity and disregard the zero time-space point, the immobile bright region totally disappear from the correlation function (in the first approximation). Photon counting: ACF of a bright immobile particle Analog detection: ACF of a bright immobile particle After subtraction of the average image, a small number (equal to the image intensity is added). Attention!!!! This is not true for analog detection, not even in the first order approximation. For analog detection the shot noise is time (and space) correlated.
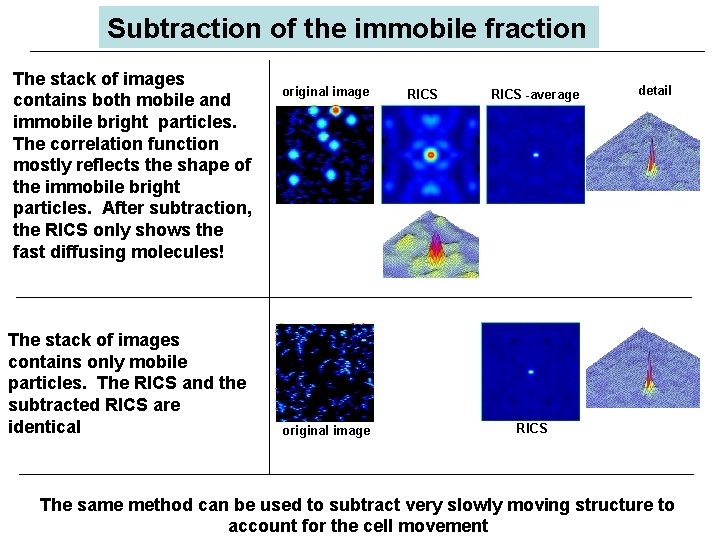
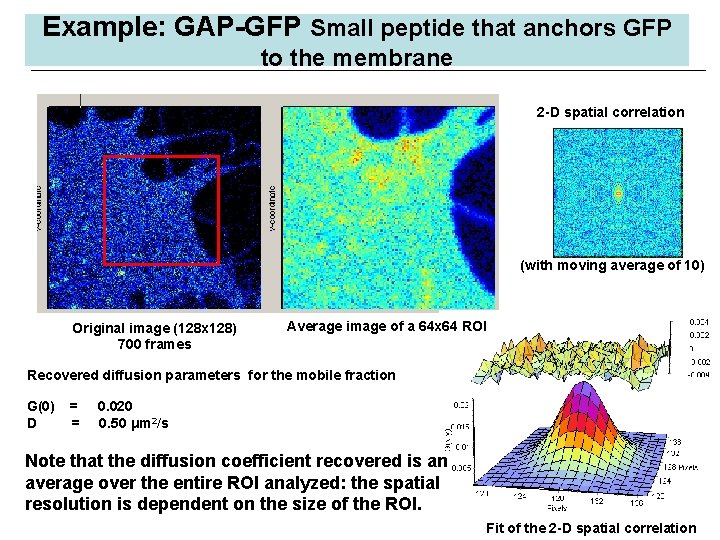
Subtraction of the immobile fraction The stack of images contains both mobile and immobile bright particles. The correlation function mostly reflects the shape of the immobile bright particles. After subtraction, the RICS only shows the fast diffusing molecules! The stack of images contains only mobile particles. The RICS and the subtracted RICS are identical original image RICS -average detail RICS The same method can be used to subtract very slowly moving structure to account for the cell movement
RICS: Immobile Component Removal Paxillin-EGFP in CHO K 1 Region of Interest ACF with Immobile ACF no Immobile 64 x 64, 8 s/pixel, 5. 4 ms/line, 0. 023 m/pixel Fit to ACF with Immobile Component Removed D = 0. 49 ± 0. 05 m 2/s Digman et al. Biophys. J. , 2005
RICS: Removal of slowly varying component Very often cells (or parts of the cell) move. Instead of subtracting the average (over the entire image stack), we could subtract a local moving average. This is equivalent to high-pas filtering of the image: only the fast changing features remain. In our software, it is possible to use different moving average lengths, depending on the speed of motion of the quasi immobile features. Warning: The principle that the shot noise is time and space uncorrelated is not valid. After high-pass filtering, the intensity of one pixel carries to the next, both in time and in space, introducing correlations that were not there originally. However, the effect of filtering can be predicted and recognized. Photon counting: ACF of a bright immobile particle High pass filter effect: ACF of a bright slowly mobile particle Effect of HPF
Example: GAP-GFP Small peptide that anchors GFP to the membrane 2 -D spatial correlation (with moving average of 10) Original image (128 x 128) 700 frames Average image of a 64 x 64 ROI Recovered diffusion parameters for the mobile fraction G(0) D = = 0. 020 0. 50 μm 2/s Note that the diffusion coefficient recovered is an average over the entire ROI analyzed: the spatial resolution is dependent on the size of the ROI. Fit of the 2 -D spatial correlation
RICS: Spatio-temporal correlations Diffusion or binding? (or blinking) • Frequently, we obtain apparent diffusion coefficients below 0. 01 mm 2/s. These values are highly suspicious for single molecules or small aggregates! • Experimentally it is difficult to distinguish between binding (exponential functions) and diffusion. PCH analysis often show that the amplitude fluctuations correspond to few fluorescent molecules. • The original work of Elson, Magde and Webb in FCS was to measure binding. • In solution is possible to predict the value of the diffusion; in cell this is problematic. • The spatial correlation resulting from binding to immobile structures is different from diffusion. RICS could identify binding (to immobile structures), blinking of diffusing particles and pure diffusion.
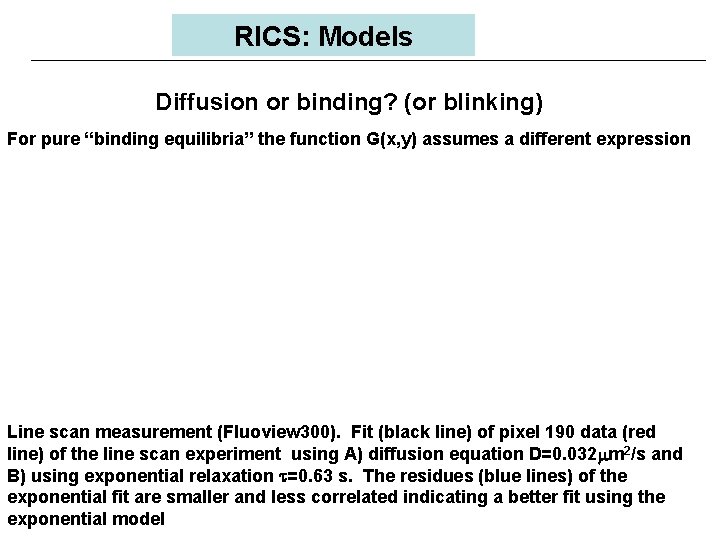
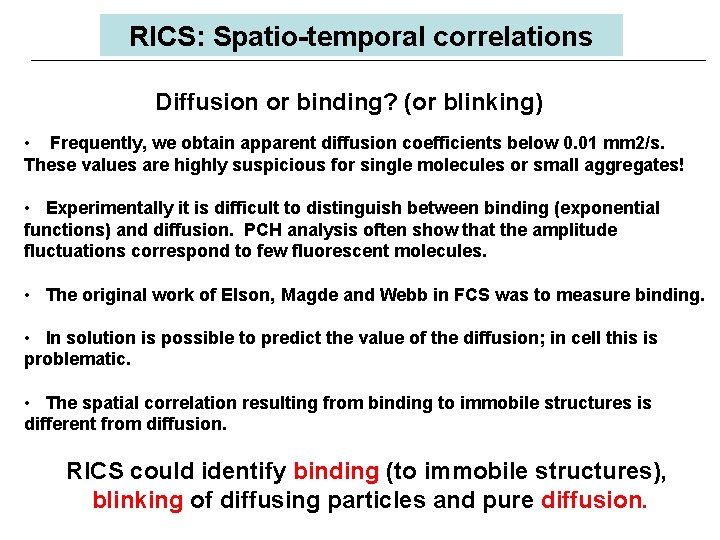
RICS: Models Diffusion or binding? (or blinking) For pure “binding equilibria” the function G(x, y) assumes a different expression Line scan measurement (Fluoview 300). Fit (black line) of pixel 190 data (red line) of the line scan experiment using A) diffusion equation D=0. 032 m 2/s and B) using exponential relaxation t=0. 63 s. The residues (blue lines) of the exponential fit are smaller and less correlated indicating a better fit using the exponential model
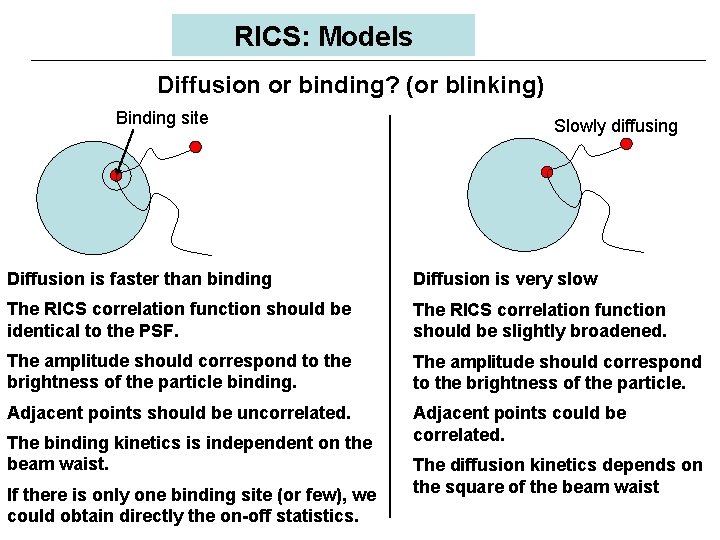
RICS: Models Diffusion or binding? (or blinking) Binding site Slowly diffusing Diffusion is faster than binding Diffusion is very slow The RICS correlation function should be identical to the PSF. The RICS correlation function should be slightly broadened. The amplitude should correspond to the brightness of the particle binding. The amplitude should correspond to the brightness of the particle. Adjacent points should be uncorrelated. Adjacent points could be correlated. The binding kinetics is independent on the beam waist. If there is only one binding site (or few), we could obtain directly the on-off statistics. The diffusion kinetics depends on the square of the beam waist
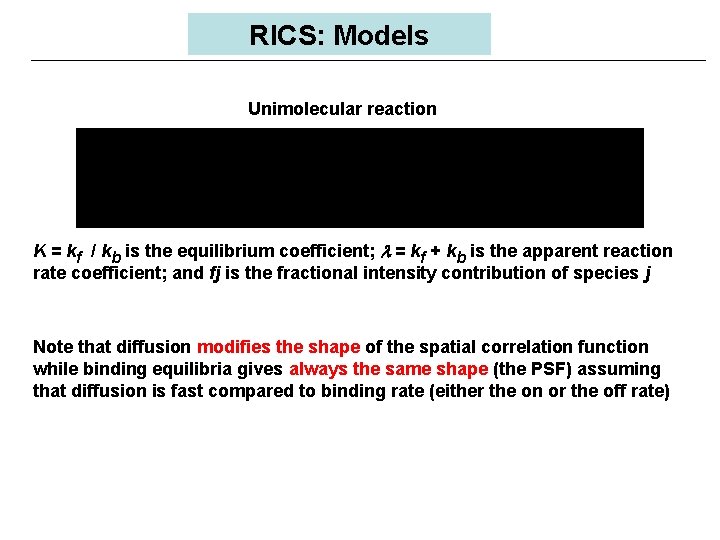
RICS: Models Unimolecular reaction K = kf / kb is the equilibrium coefficient; l = kf + kb is the apparent reaction rate coefficient; and fj is the fractional intensity contribution of species j Note that diffusion modifies the shape of the spatial correlation function while binding equilibria gives always the same shape (the PSF) assuming that diffusion is fast compared to binding rate (either the on or the off rate)
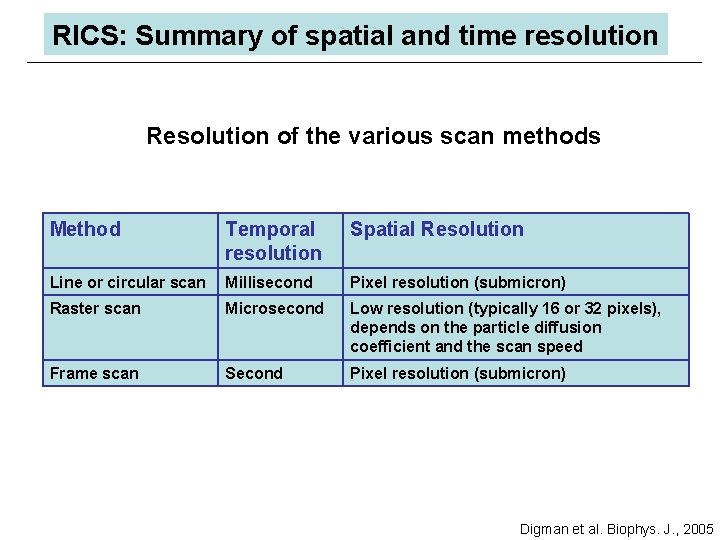
RICS: Summary of spatial and time resolution Resolution of the various scan methods Method Temporal resolution Spatial Resolution Line or circular scan Millisecond Pixel resolution (submicron) Raster scan Microsecond Low resolution (typically 16 or 32 pixels), depends on the particle diffusion coefficient and the scan speed Frame scan Second Pixel resolution (submicron) Digman et al. Biophys. J. , 2005
RICS: Conclusions There is a hidden time structure in the laser scanning images that can be exploited to obtain information about ØDiffusion ØVelocity ØBrightness ØAggregation ØBlinking, binding-unbinding equilibria We developed a general method to separate mobile from immobile fraction This new development has great potential consequences for anyone interested in cellular imaging and dynamics

Gs Globals spectroscopy by Enrico Gratton Gi images The Globals program originally developed at the LFD for analysis of multiple files from spectroscopy is now available for image analysis. This new program analyzes FCS in images by the RICS approach, and lifetime images using the phasor approach. Available in the Fall of 2005. Price $1000 for Globals for Spectroscopy $1000 for Globals for Images More information at www. lfd. uiuc. edu
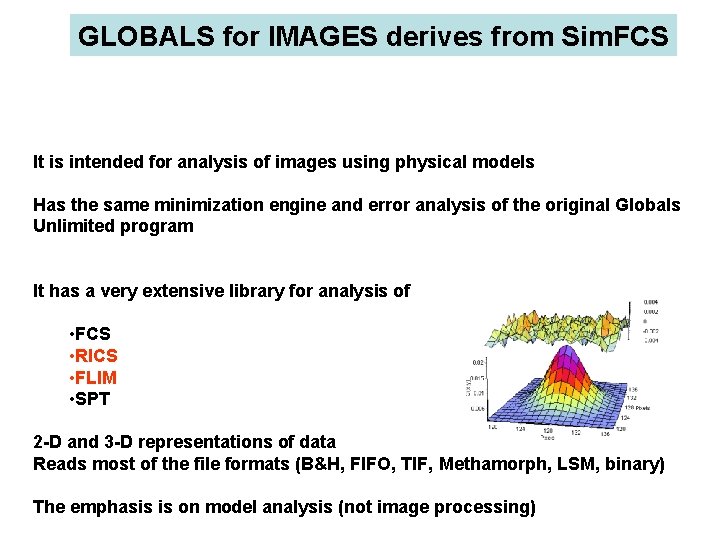
GLOBALS for IMAGES derives from Sim. FCS It is intended for analysis of images using physical models Has the same minimization engine and error analysis of the original Globals Unlimited program It has a very extensive library for analysis of • FCS • RICS • FLIM • SPT 2 -D and 3 -D representations of data Reads most of the file formats (B&H, FIFO, TIF, Methamorph, LSM, binary) The emphasis is on model analysis (not image processing)
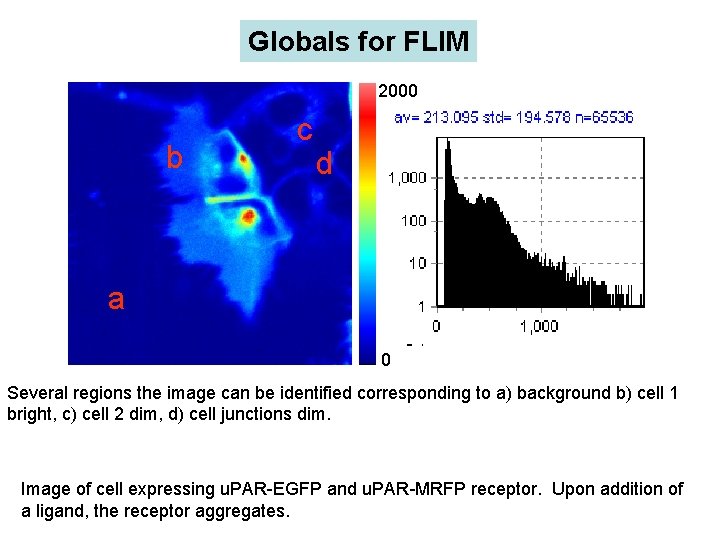
Globals for FLIM 2000 b c d a 0 Several regions the image can be identified corresponding to a) background b) cell 1 bright, c) cell 2 dim, d) cell junctions dim. Image of cell expressing u. PAR-EGFP and u. PAR-MRFP receptor. Upon addition of a ligand, the receptor aggregates.
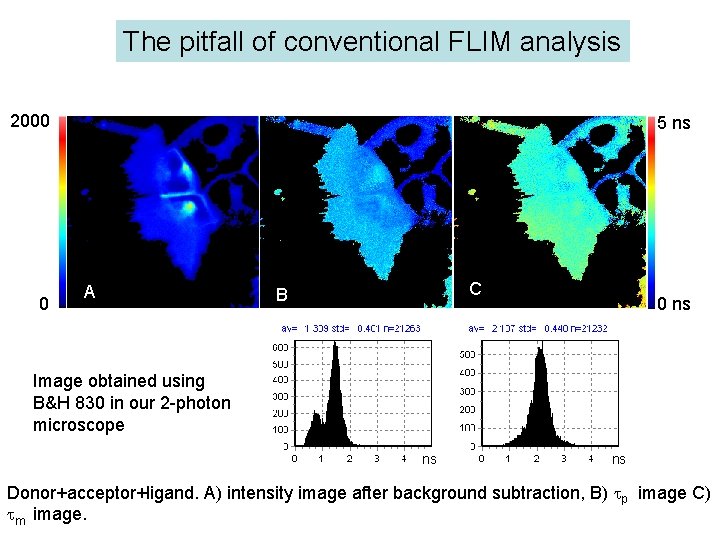
The pitfall of conventional FLIM analysis 2000 0 5 ns A C B 0 ns Image obtained using B&H 830 in our 2 -photon microscope ns ns Donor+acceptor+ligand. A) intensity image after background subtraction, B) p image C) m image.
Frequency-domain Time-domain
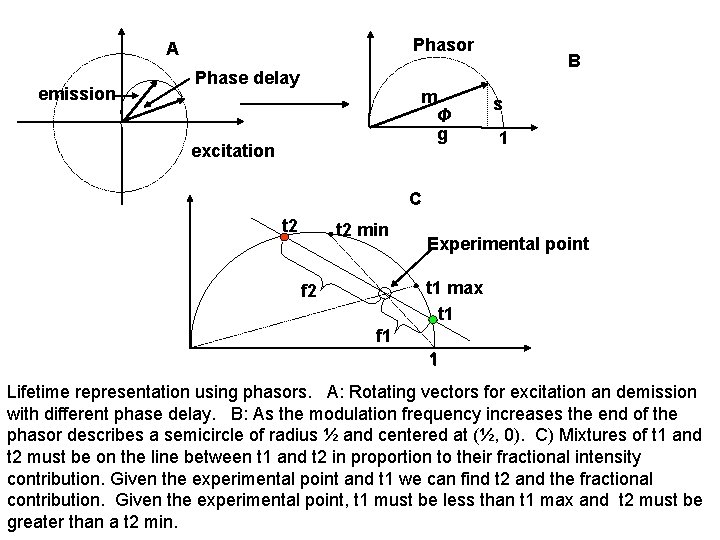
Phasor A emission Phase delay m Φ g excitation B s 1 C t 2 min Experimental point t 1 max t 1 f 2 f 1 1 Lifetime representation using phasors. A: Rotating vectors for excitation an demission with different phase delay. B: As the modulation frequency increases the end of the phasor describes a semicircle of radius ½ and centered at (½, 0). C) Mixtures of t 1 and t 2 must be on the line between t 1 and t 2 in proportion to their fractional intensity contribution. Given the experimental point and t 1 we can find t 2 and the fractional contribution. Given the experimental point, t 1 must be less than t 1 max and t 2 must be greater than a t 2 min.
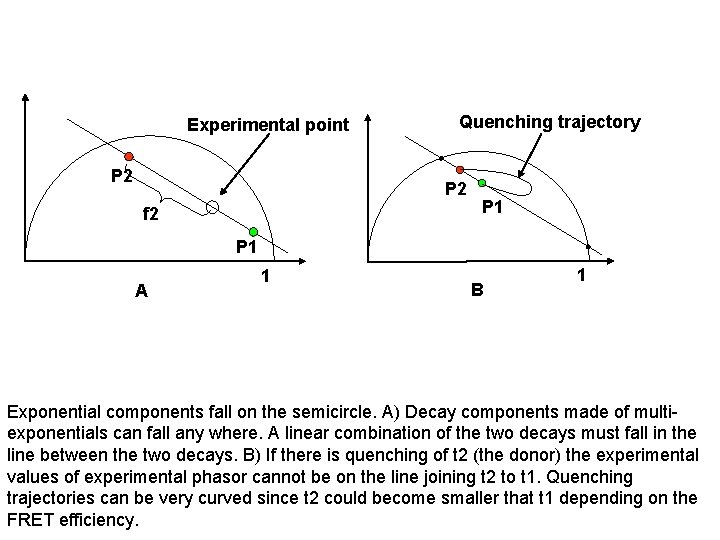
Experimental point P 2 Quenching trajectory P 2 f 2 P 1 A 1 B 1 Exponential components fall on the semicircle. A) Decay components made of multiexponentials can fall any where. A linear combination of the two decays must fall in the line between the two decays. B) If there is quenching of t 2 (the donor) the experimental values of experimental phasor cannot be on the line joining t 2 to t 1. Quenching trajectories can be very curved since t 2 could become smaller that t 1 depending on the FRET efficiency.
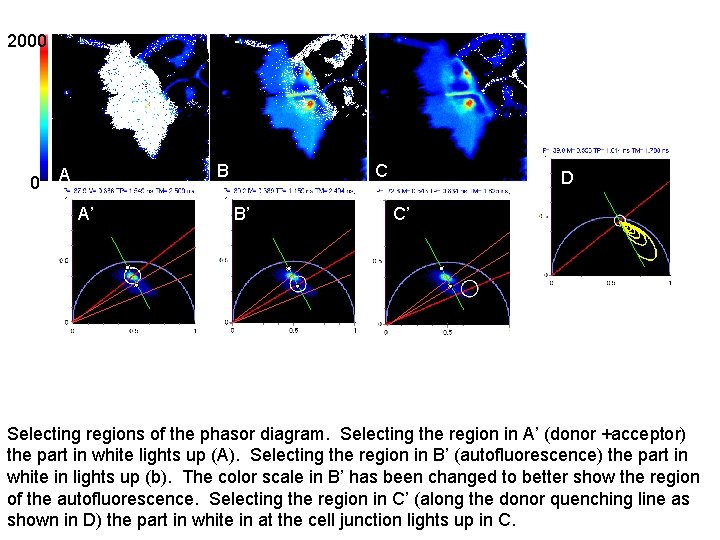
2000 0 B A A’ C B’ CD C’ Selecting regions of the phasor diagram. Selecting the region in A’ (donor +acceptor) the part in white lights up (A). Selecting the region in B’ (autofluorescence) the part in white in lights up (b). The color scale in B’ has been changed to better show the region of the autofluorescence. Selecting the region in C’ (along the donor quenching line as shown in D) the part in white in at the cell junction lights up in C.
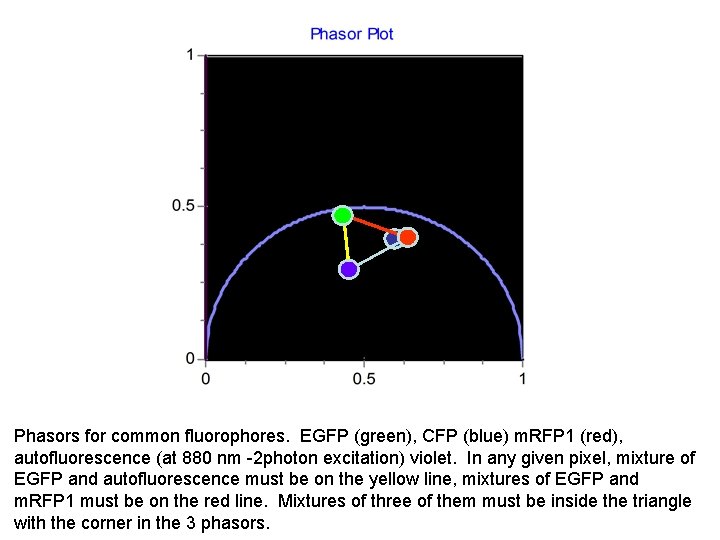
Phasors for common fluorophores. EGFP (green), CFP (blue) m. RFP 1 (red), autofluorescence (at 880 nm -2 photon excitation) violet. In any given pixel, mixture of EGFP and autofluorescence must be on the yellow line, mixtures of EGFP and m. RFP 1 must be on the red line. Mixtures of three of them must be inside the triangle with the corner in the 3 phasors.
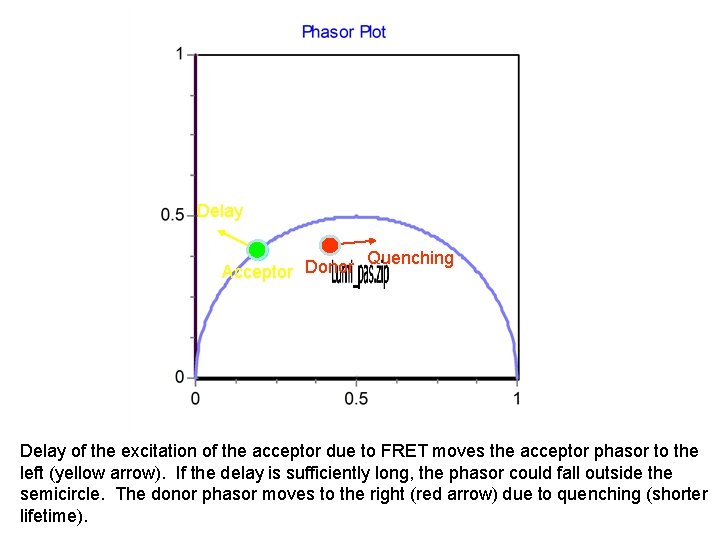
Delay Acceptor Donor Quenching Delay of the excitation of the acceptor due to FRET moves the acceptor phasor to the left (yellow arrow). If the delay is sufficiently long, the phasor could fall outside the semicircle. The donor phasor moves to the right (red arrow) due to quenching (shorter lifetime).
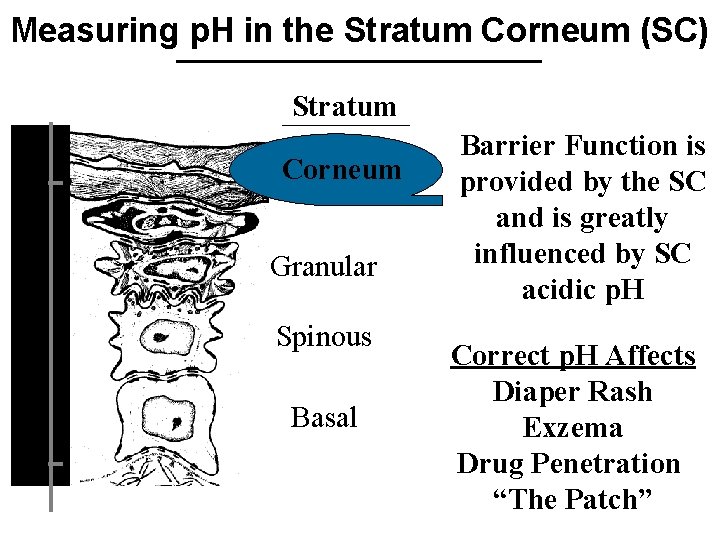
Measuring p. H in the Stratum Corneum (SC) Stratum Depth ( m) 10 Corneum Granular Spinous Basal 80 Barrier Function is provided by the SC and is greatly influenced by SC acidic p. H Correct p. H Affects Diaper Rash Exzema Drug Penetration “The Patch”

p. H Increases with SC Depth ( m) 0. 8 p. H 4. 5 -5. 6 Stratum Corneum 10 From Tape-Stripping Measurements p. H 7. 2 5 0 15 Depth ( m) Acta Dermatol. Venereol. 74: 375 -379 (1994) With each SC layer • Is p. H uniform? • Do pockets of variable p. H exist?
Goal: • Measure p. H on the cellular level Protocol 1. Two-Photon Fluorescence Lifetime Imaging Depth penetration Submicron spatial resolution Single excitation wavelength Insensitive to inhomogeneous labeling Fast Little photodamage
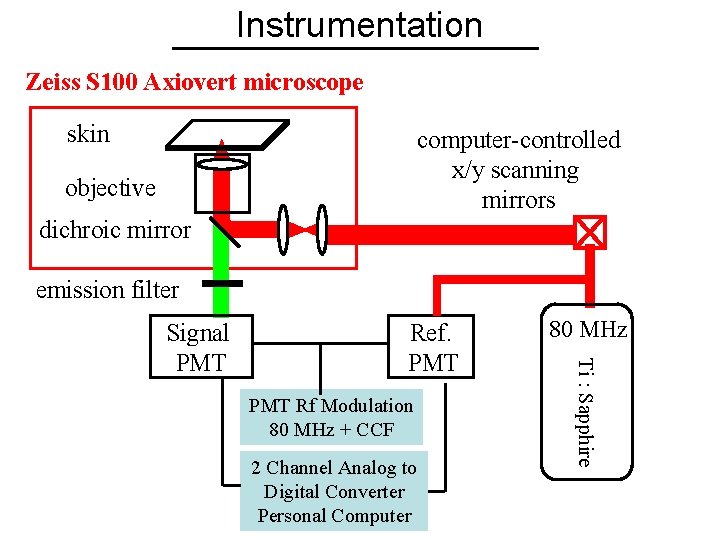
Instrumentation Zeiss S 100 Axiovert microscope skin computer-controlled x/y scanning mirrors objective dichroic mirror emission filter Ref. PMT Rf Modulation 80 MHz + CCF 2 Channel Analog to Digital Converter Personal Computer 80 MHz Ti : Sapphire Signal PMT
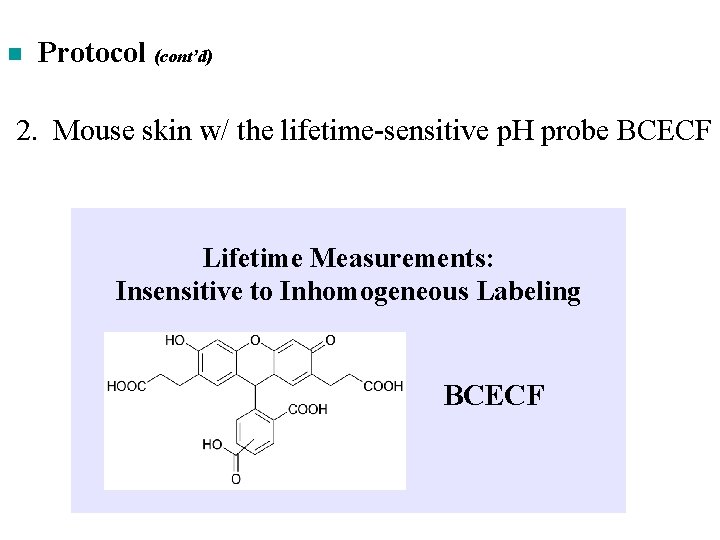
n Protocol (cont’d) 2. Mouse skin w/ the lifetime-sensitive p. H probe BCECF Lifetime Measurements: Insensitive to Inhomogeneous Labeling BCECF
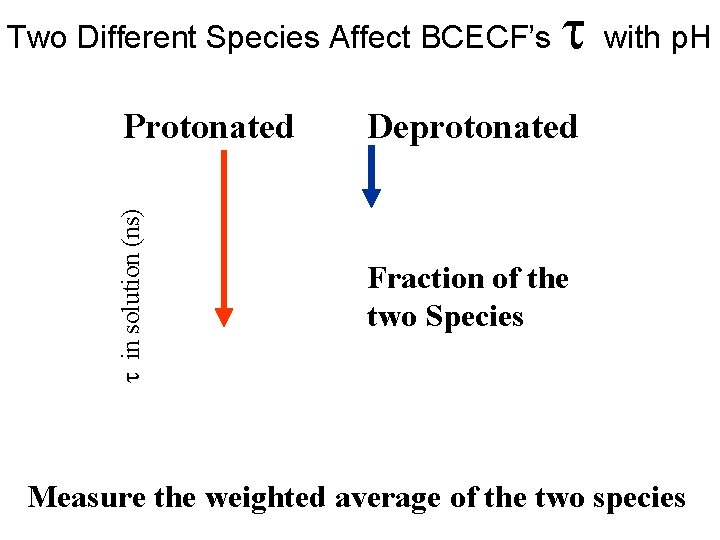
Two Different Species Affect BCECF’s in solution (ns) Protonated with p. H Deprotonated Fraction of the two Species Measure the weighted average of the two species
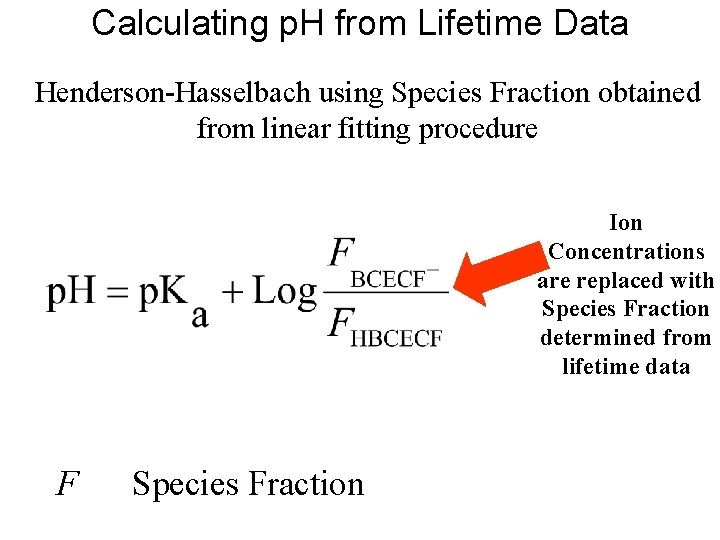
Calculating p. H from Lifetime Data Henderson-Hasselbach using Species Fraction obtained from linear fitting procedure Ion Concentrations are replaced with Species Fraction determined from lifetime data F Species Fraction
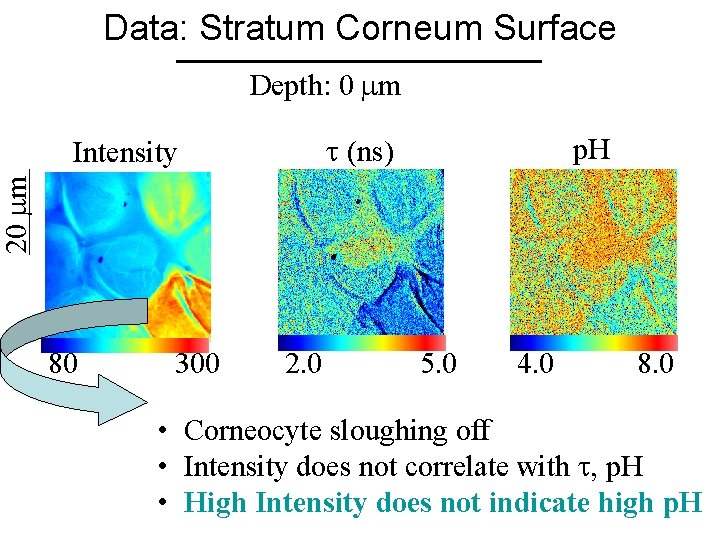
Data: Stratum Corneum Surface Depth: 0 m (ns) p. H 20 m Intensity 80 300 2. 0 5. 0 4. 0 8. 0 • Corneocyte sloughing off • Intensity does not correlate with , p. H • High Intensity does not indicate high p. H
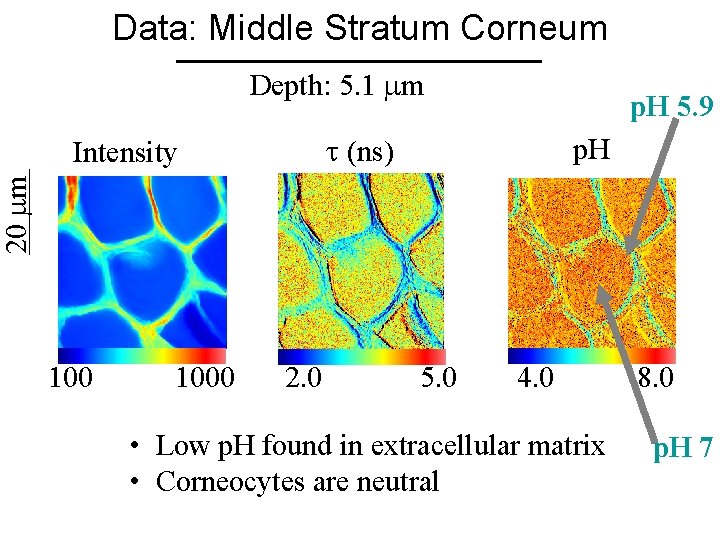
Data: Middle Stratum Corneum Depth: 5. 1 m p. H 5. 9 (ns) p. H 20 m Intensity 1000 2. 0 5. 0 4. 0 • Low p. H found in extracellular matrix • Corneocytes are neutral 8. 0 p. H 7
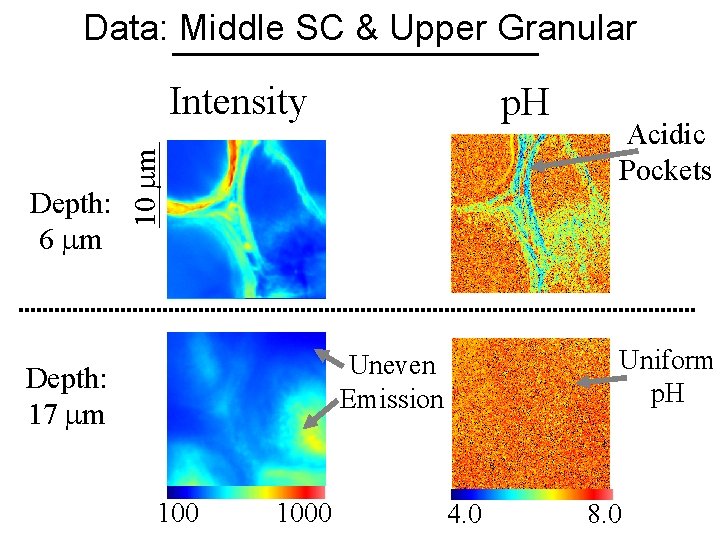
Data: Middle SC & Upper Granular Intensity 10 m Depth: 6 m p. H Uniform p. H Uneven Emission Depth: 17 m 1000 Acidic Pockets 4. 0 8. 0
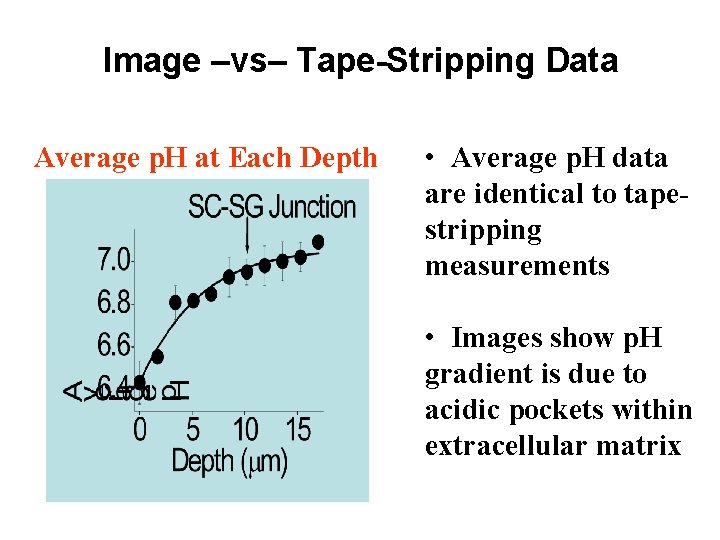
Image –vs– Tape-Stripping Data Average p. H at Each Depth • Average p. H data are identical to tapestripping measurements • Images show p. H gradient is due to acidic pockets within extracellular matrix
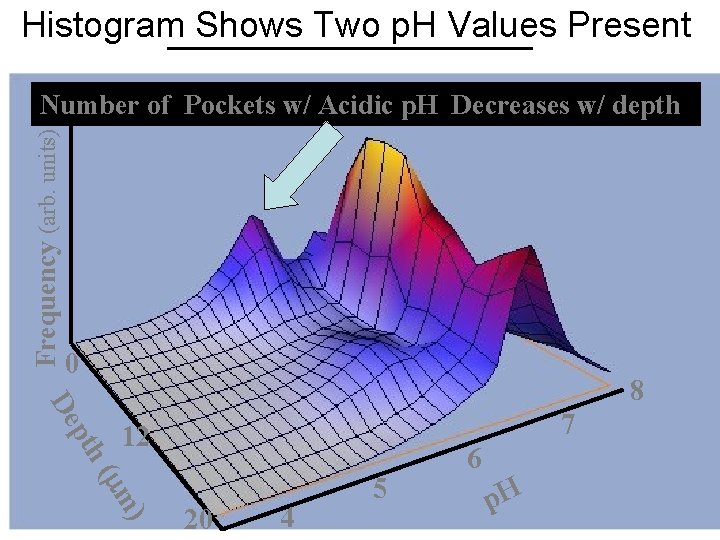
Histogram Shows Two p. H Values Present Frequency (arb. units) Number of Pockets w/ Acidic p. H Decreases w/ depth • Average p. H increases 0 pth De 8 7 12 ( m) 20 4 5 6 p. H
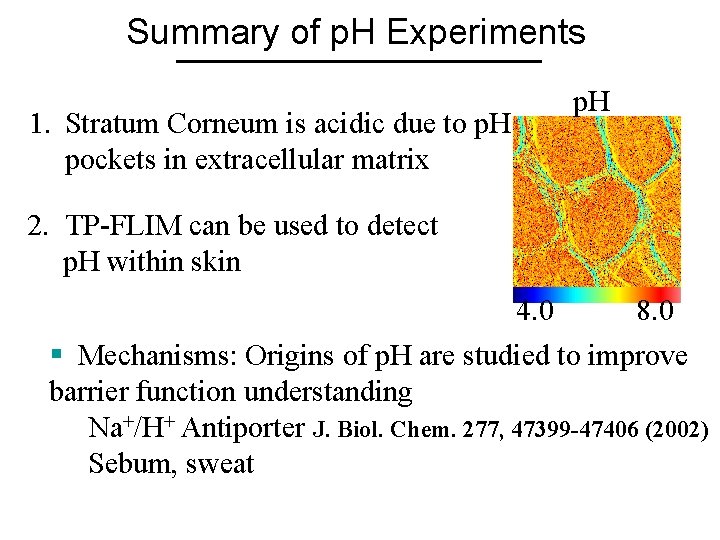
Summary of p. H Experiments 1. Stratum Corneum is acidic due to p. H pockets in extracellular matrix p. H 2. TP-FLIM can be used to detect p. H within skin 4. 0 8. 0 § Mechanisms: Origins of p. H are studied to improve barrier function understanding Na+/H+ Antiporter J. Biol. Chem. 277, 47399 -47406 (2002) Sebum, sweat
1. Two-photon fluorescence microscopy can generate useful data and images in HUMAN tissue, which is the ultimate goal for the Medical/Biomedical Pharmaceutical Cosmetic industry communities. 2. Next Goal: More specific targets within the skin.
- Slides: 53