Anthropometry Technique of measuring people Measure Index Reference


 + ((1 -Sp) * (1")


- Slides: 44
Anthropometry • Technique of measuring people Measure Index Reference Indicator Information
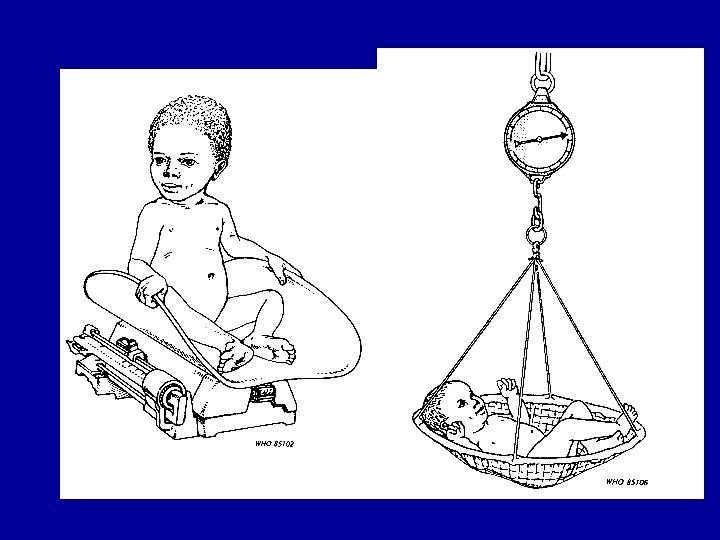
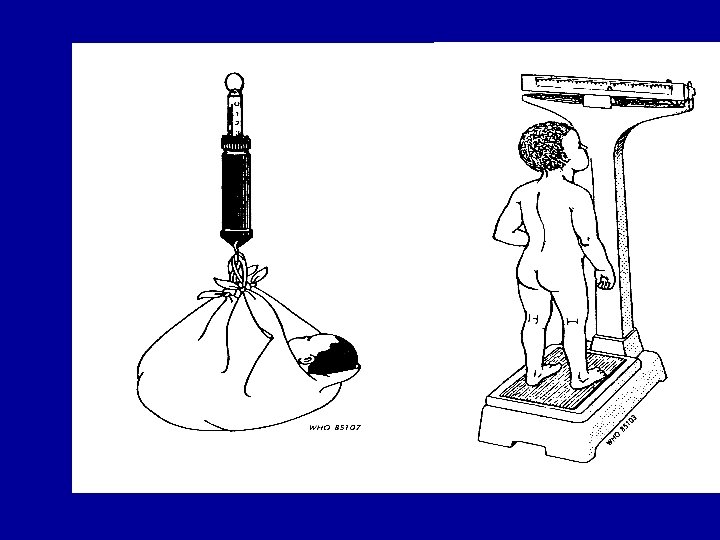
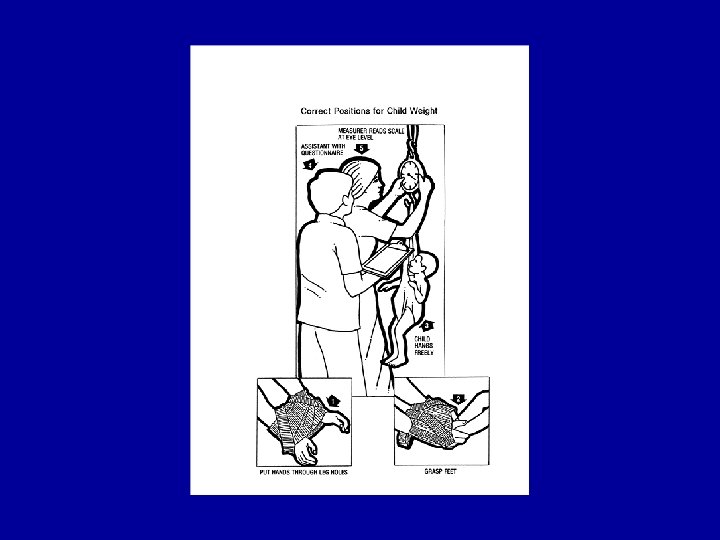
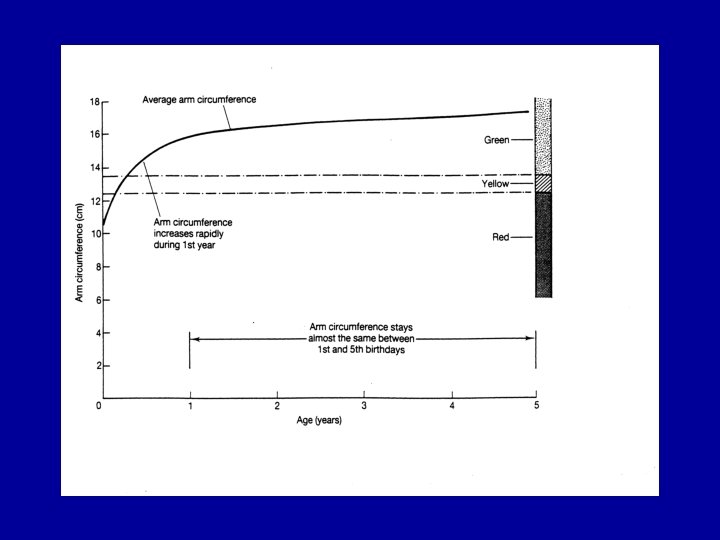
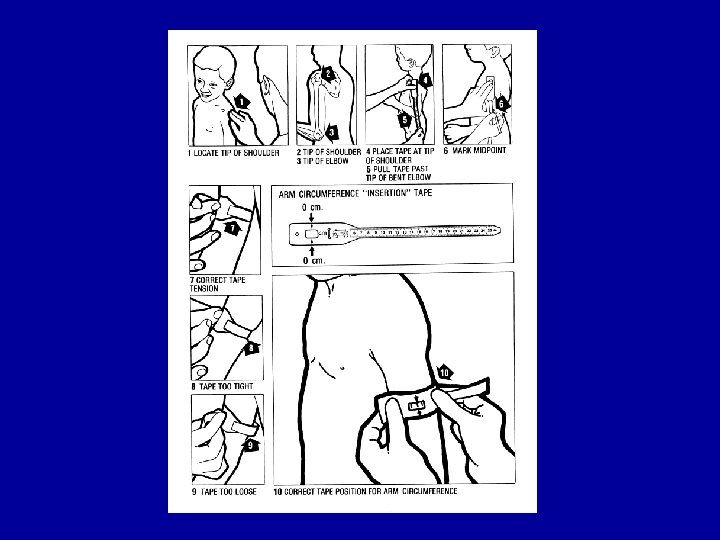
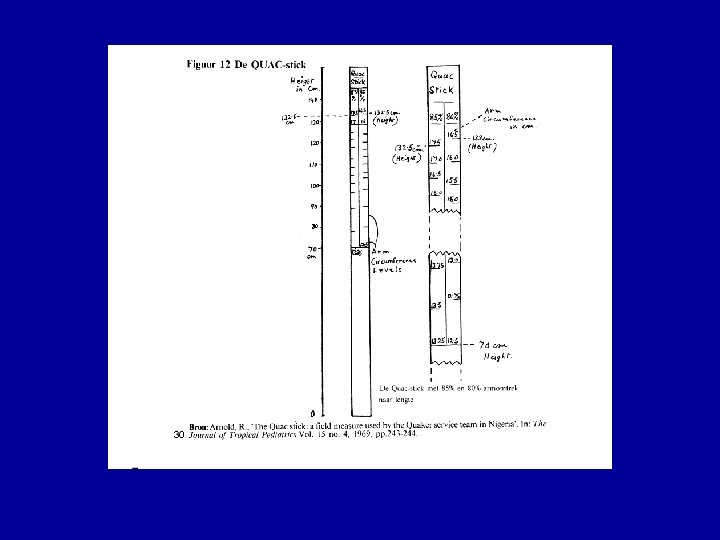
Measurements • • Weight Height Length and stature or height Mid Upper Arm Circumference MUAC Characteristics we need: » » easy cheap acceptable reproducible
INDEX • Relation between two measurements • weight for age W/A or W//A general appreciation of nutritional status • height for age H/A or H//A measure of linear growth deficit or STUNTING • weight for height/length W/H or W//H measure of weight deficit according to length WASTING
WEIGHT • • • Sensitive to changes Changes in two directions up and down Fast change Usually easy to collect Standardisation of scales needed, calibration Small changes are difficult to measure: food intake of the child, urine, dehydration, temp, etc: not very specific • community aversion: connotations • can be difficult: co-operation of children • to nearest 100 gr.
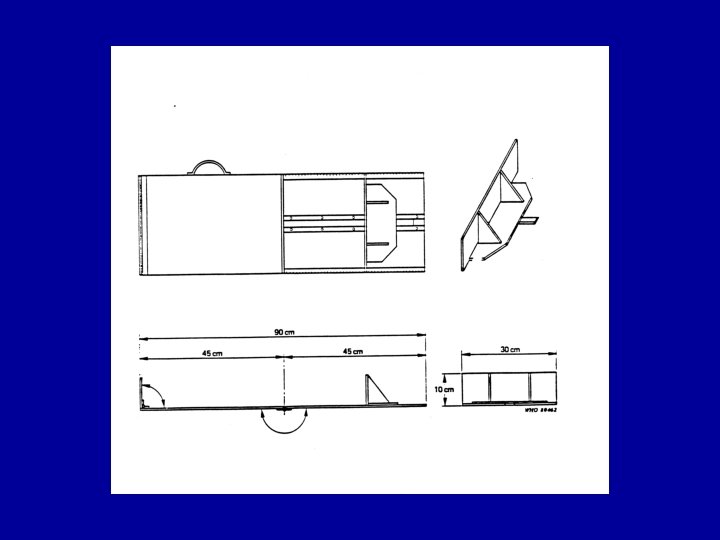
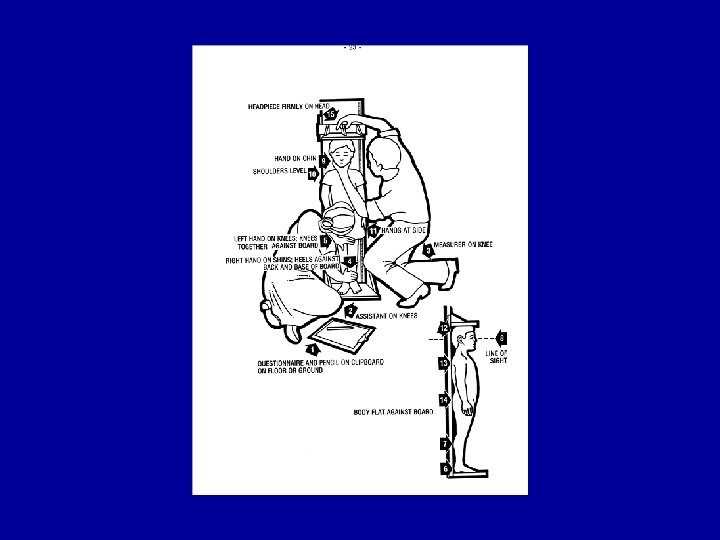
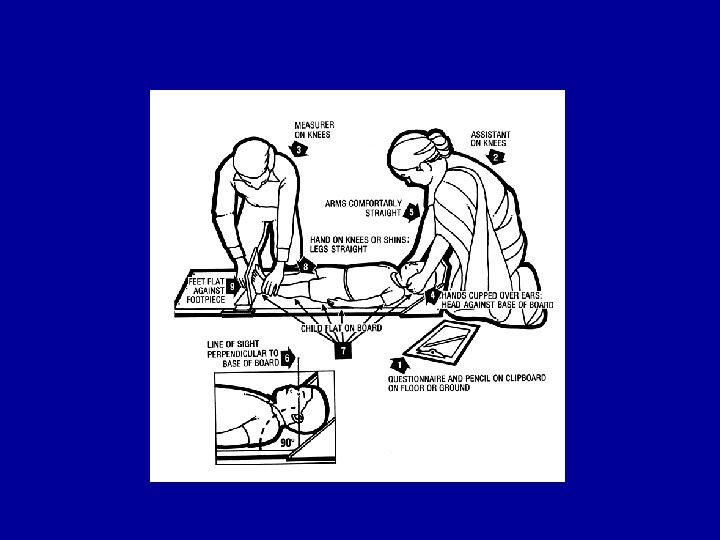
Height • Difficult to measure, accuracy, large variations • Differences are small: 24 cm increment in the first year of life, 11 cm second year, 8 third • Low sensitivity • Large measurement errors • Stunted versus stunting – stunted is a heterogeneous group – stunting is the active process: determinants are acting • Measure to the nearest mm • Below 2 recumbent, above standing
AGE • Usually the most difficult and inaccurate measurement • Less of a problem if a trend in the same child is measured, the mistake is repeated every time and thus cancels out
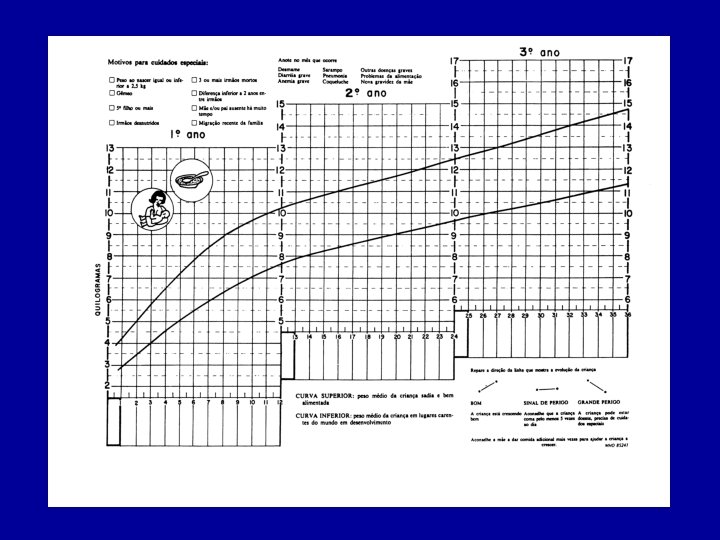
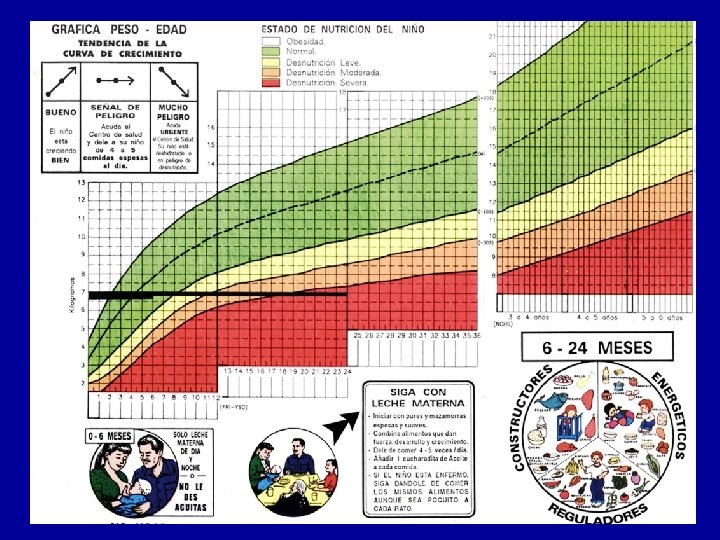
Growth of a child
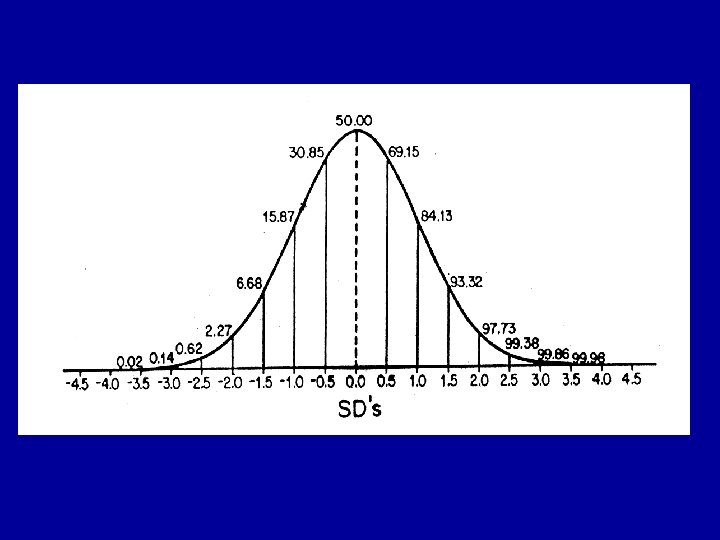
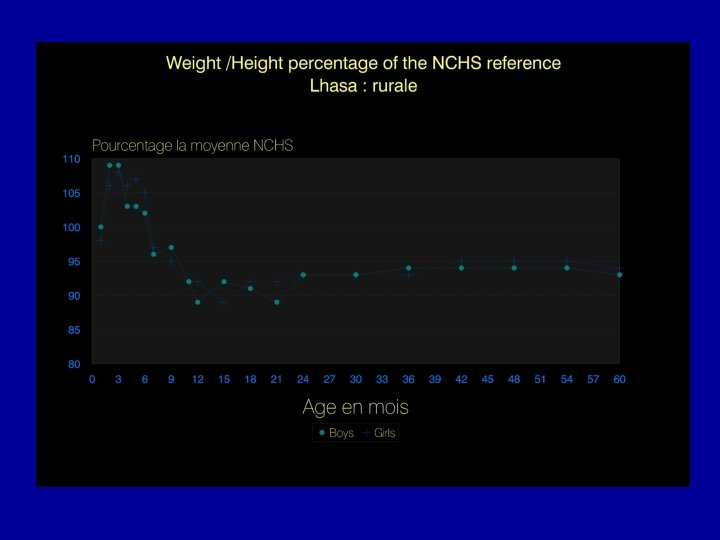
Indicator • Partial quantification of a concept – partial – quantification – concept • number or percent of defined group below a cutoff value • cut-off : z-scores, -2 and +2 , 95% of population • z-score = X-Mean / SD • below -2 in normal distribution 2. 27 % !! • Percentages: value = % of the mean • percentiles: range from 1 to 100
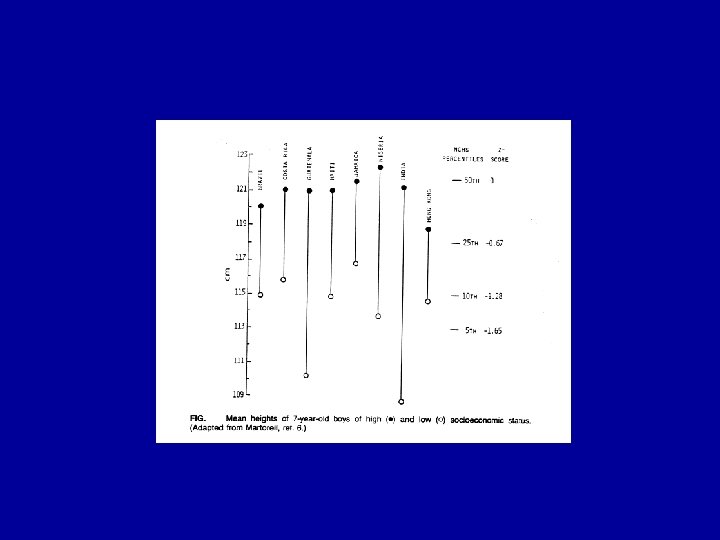
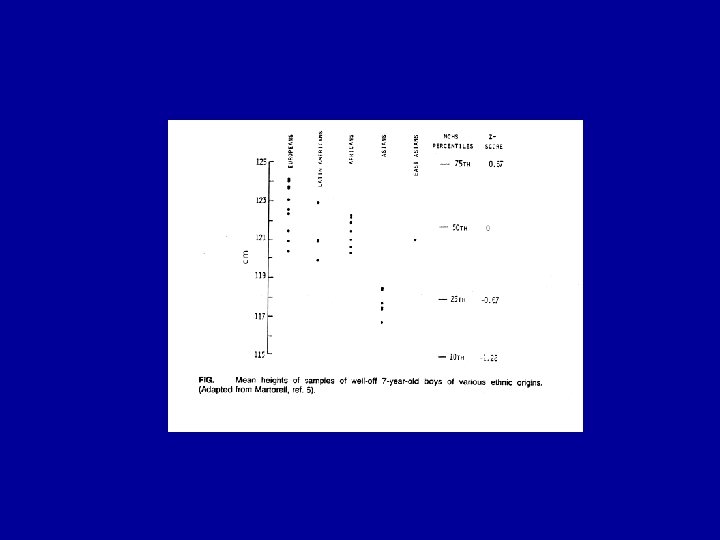
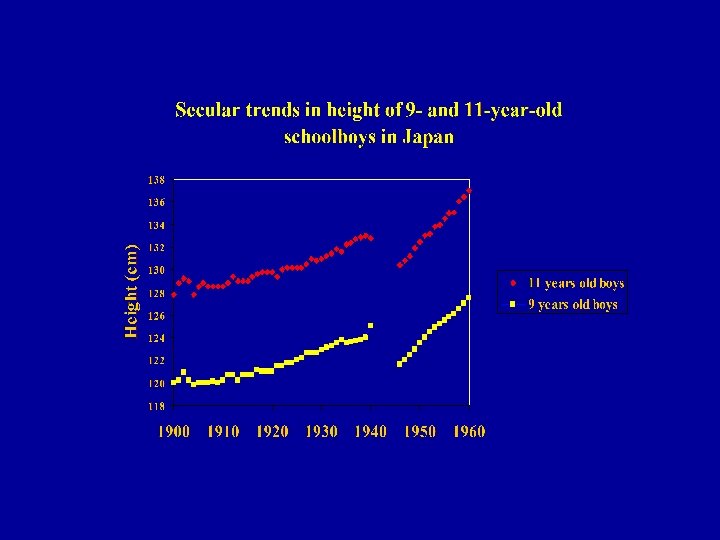
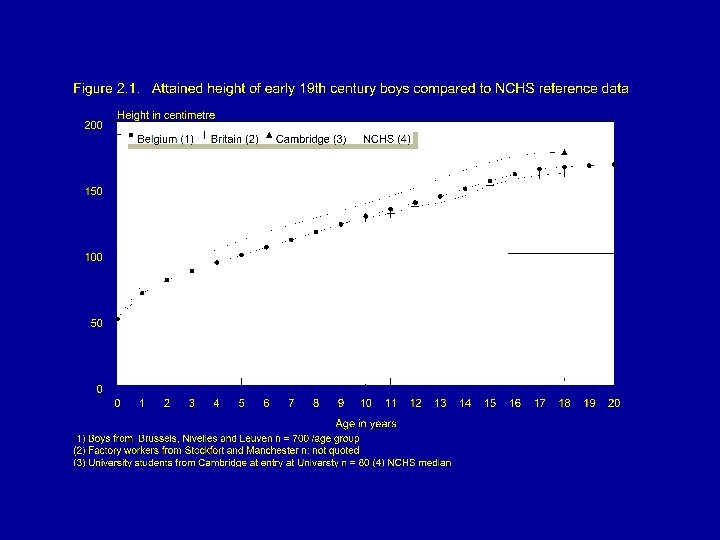
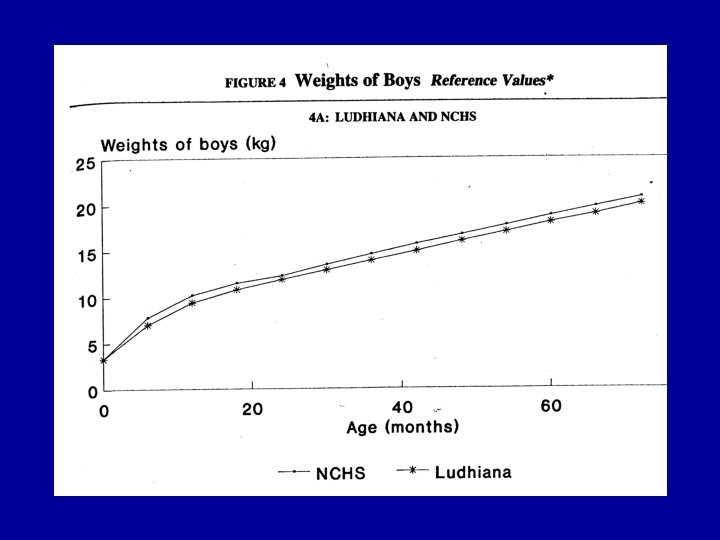
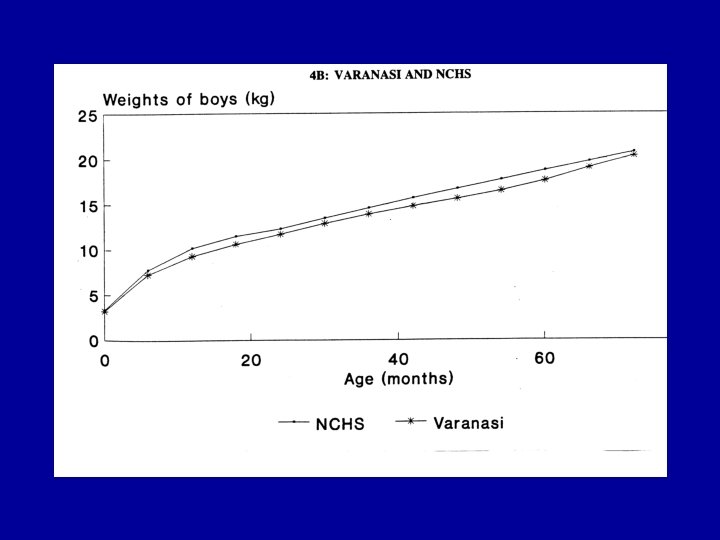
The reference • One reference for all? ? • Reference or standard? • Genetic differences – Do they exist – Are they important • Reference means operational decisions
Criteria for a reference • 1. Measurements should relate to a well-nourished population. • 2. Sample : at least 200 individuals in each age and sex group. • 3. Sample: cross-sectional, since the comparisons that will be made are of a cross-sectional nature. • 4. Sampling procedures should be defined and reproducible. • 5. Measurements should be carefully made and recorded by observers trained in anthropometric techniques, using equipment of well tested design and calibrated at frequent intervals. • 6. The measurements made on the sample should include all the anthropometric variables that will be used in the evaluation of nutritional status. • 7. The data from which reference graphs and tables are prepared should be available for anyone wishing to use them, and the procedures used for smoothing curves and preparing tables should be adequately described and documented.
COMMON ERRORS • First year of life is up to 11. 9 months of age and not O-12 • Length and height; change technique at 24 mo • Percentage and z-score – 80% is -1. 5 Z-score at 6 mo and -2 Z score at 2 yrs • Lack of distinction between descriptive use and operational use • No use of statistics: Confidence intervals and tests to compare prevalence and averages • Undernutrition Wasting Stunting
Classifications: GOMEZ
Classifications: WATERLOW
Anthropometry is an operational tool • Identification serve a purpose , the identified should be dealt with. Capacity of numbers. • Sensitivity (Se) is the ability of a test to identify as positive those who are diseased. • Specificity (Sp) is the ability of a test to identify as negative those who are healthy. • Positive predictive value: If you test positive, what is the chance of really being positive. • Negative predictive value is the chance of being healthy whilst being identified as negative. The chance of being really negative is higher when there are no false negatives, i. e. when the sensitivity is higher.
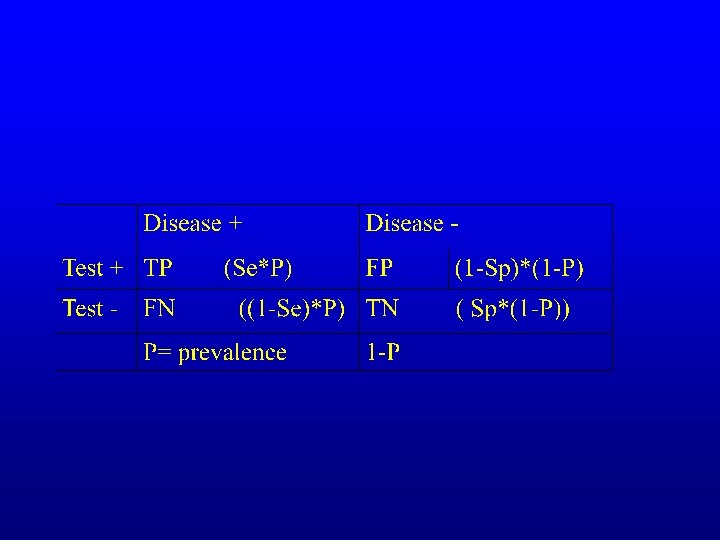
Se and Sp Diagnosed as malnourished Yes No Truly Malnourished Yes TP FN • • TP= true positive FP= false positive TN= true negative FN= false negative • • Se= TP/(TP+FN) Sp= TN/(TN+FP) Positive predictive value (PPV) = TP/(TP+FP) Negative predictive value (NPV) = TN/(TN+FN) No FP TN
reformulation PPV= TP /TP +FP PPV= Se*P / (Se*P) + ((1 -Sp) * (1 -P)) NPP= TN/FN + TN NPP= Sp(1 -P) / (Sp * (1 -P) + ((1 -Se) * P)
Use of Anthropometry · Individual Level · SCREENING: ONE TIME ASSESSMENT · to immediately decrease case fatality (emergency situations) · in non-emergency situations · GROWTH MONITORING: TREND ASSESSMENT · Population Level · ONE TIME ASSESSMENT · under circumstances of food crisis · for long-term planning · NUTRITIONAL SURVEILLANCE: TREND ASSESSMENT · for long-term planning · for timely warning · for programme management
Indices • W/A: combined measurement: – NO individual diagnosis but trend assessment – For growth monitoring and FU • W/H indicates degree of wasting – Individual diagnosis – Community diagnosis – Sensitive to change • H/A indicates linear growth retardation – not sensitive to change – slow progress – Community diagnosis • ALL complex causality
Summary of applications