Populations Chapter 19 Understanding Populations Section 19 1


 u Essay on the Principal of Population u In nature,")


 space, food, accumulation")


")
- Slides: 28
Populations Chapter 19
Understanding Populations Section 19. 1
Definition: u A group of organisms of the same species living in the same place at one time
Thomas Malthus (1766 -1834) u Essay on the Principal of Population u In nature, plants and animals produce far more offspring than can survive u Man, too, is capable of overproducing if left unchecked u Famine and poverty are natural outcomes of overpopulation
3 Characteristics: 1. Size 2. Density 3. Dispersion
Population Size u# of individuals in a given area u Difficult to measure u Estimates often taken
Population Density u u u How crowded a population is # of individuals per unit area Ex) 30 people/classroom
Population Dispersion u Spatial 1. distribution of individuals Clumped - social flocks or herds - clump around resources - most common 2. Even - due to competition among individuals to maximize distance 3. Random - pattern-less - rare in nature - ex) snakes, clams, dandelion
Population Dynamics u Populations u Birth change over time due to: rates u Death (Mortality) rates u Life expectancy rates u Age Structure u Patterns of Mortality
Age Structure u Distribution of individuals among different ages in a population
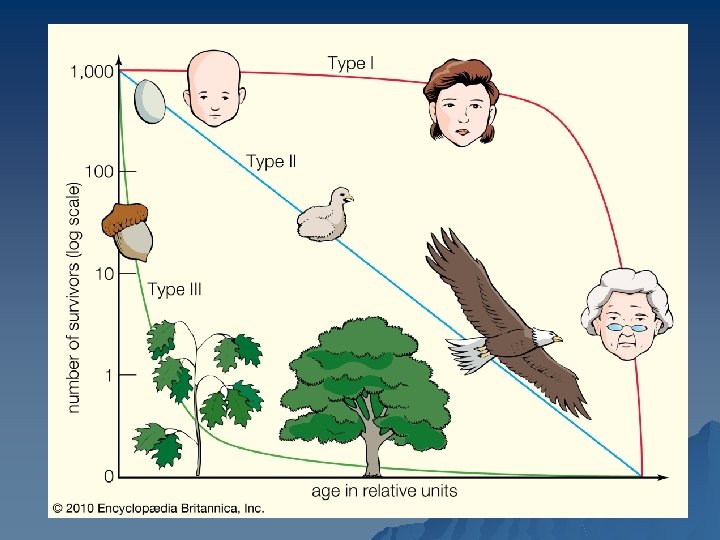
Survivorship Curve
Survivorship Curves u Type I – death at old age – humans u Type II – death at any age – Birds, many reptiles u Type III – death at young age – Plants, many insects
Measuring Populations Section 19. 2
Population Growth Rate u u # by which a population’s size changes over time Population changes by: 1. u 2. u 3. u 4. u birth rate death rate emigration immigration
Calculations u ADDS to population = birth & immigration u SUBTRACTS from population = death & emigration u ASSUME immigration = emigration u THEREFORE: birth rate – death rate = growth rate
2 Models of Growth 1. Exponential Model J-shaped curve 2. Logistic Model S-shaped curve
Exponential Model At a steady, positive growth rate, the population will add a larger # of individuals with each generation u The larger the population gets, the faster it grows! u Limitation: only exists under rare conditions u
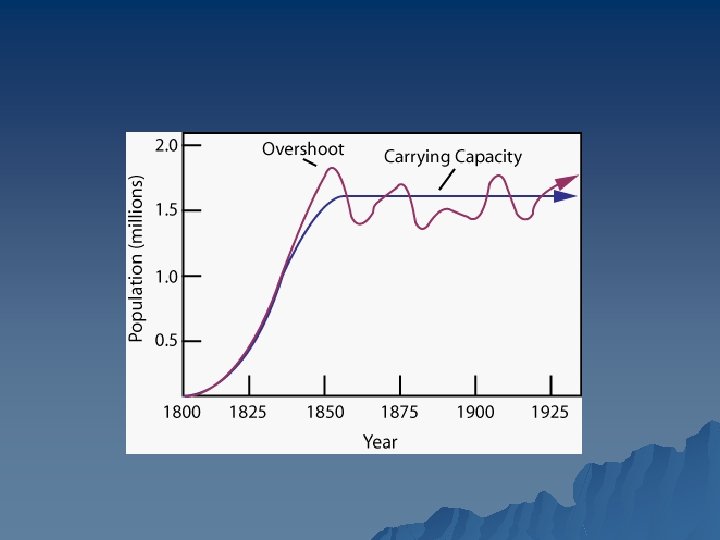
Logistic Model u u The exponential model accounting for the influence of limiting factors Carrying capacity (K): # of individuals the environment can support of a long period of time – Fluctuates slightly
Limiting Factors u condition that restricts growth of a population ex) space, food, accumulation of waste
Carrying Capacity
Population Regulation u 2 types of limiting factors u 1. Density-independent factors – Abiotic factors – Reduction of population by same proportion no matter what size it is – Ex) floods or extreme temp.
u 2. Density-dependent factors – Biotic factors – The larger the population, the larger the proportion of reduction. – Ex) disease or starvation
Population Growth, 19. 3 video Human
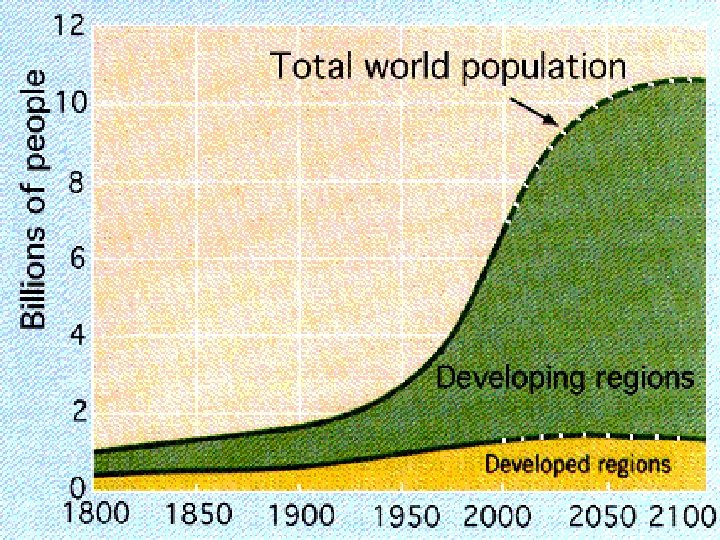
History Lesson u u Hunter-gatherer lifestyle: slow human growth because of high mortality rate Agricultural revolution: human population growth because of an increase in the food supply Industrial revolution: rapid human population growth because of decline in death rates u video u
Today’s Growth u Developed Countries: 20% of world’s population, low growth rates – Ex) USA, Japan, Germany, France, etc. u Developing Countries: 80% of world’s population, high growth rate – Ex) Central America, South America, Asia, Africa