Animation and Games Industries Motion Picture Market Motion


")


 Age Demographics")


 Job Probability (inverse percentage) Source: US Bureau of Labor Statistics")

 Source: glassdoor. com Dreamworks Animation")

 Revenue: $521 million (2800")

 Can be used as a")
 Running time: 10 min, 54 sec")


 “The number of transistors on an")


 84 million Kinect, Microsoft (2010) 10")

- Slides: 50
Animation and Games Industries
Motion Picture - Market
Motion Picture - Market Source: Motion Picture Association of America (MPAA)
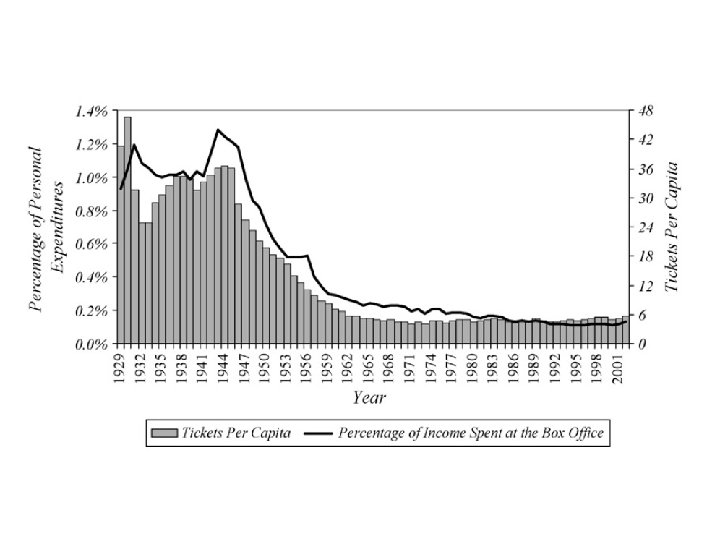
Market How is it that fewer people are seeing films in the US, but the US box office $ is increasing?
Motion Picture - Market Motion Pictures are higher than most other forms of entertainment combined. Source: Motion Picture Association of America (MPAA)
Motion Picture - Demographics Source: Motion Picture Association of America (MPAA) Age Demographics
India and the US have a 94% and 93% domestic market, suggesting that people in these nations rarely watch films outside their own country. The next highest is China at 60%. Domestic Consumption
How much do you spend to watch movies per year? What percentage of your income is it? Percentage of Income: Food Car / Transport Housing Health Taxes 9% (USA) 30% 35% 20 -50% 25% 20% (India) 55% (Denmark)
From the 1920 s to 1950 s, people spent much more of their money on social forms of entertainment (i. e. going to the movies). Television dramatically changed entertainment habits to be more individual.
Motion Picture – Production World Wide Film Production Source: Screen Digest, June 2006
Denmark was one of the best performing territories in 2005, along with Korea and the UK, with domestic shares of 30%, 57% and 34%. The common theme among these three is the strong showing of locally produced films. In 2005, Danish titles captured the largest number of admissions since 1981. In all, 31 Danish films and 10 documentaries were released in 2005. Of these, six were in the top 10. The widest release and most successful local title was Father of Four (116 screens, 495, 614 admissions) — second behind Harry Potter and the Goblet of Fire, which attracted 623, 656 visits.
However… Of the 1, 500+ films produced world wide… Ten of these, the “blockbuster hits”, will take 25% of the world revenue. Hollywood Studios are moving toward bigger films, with bigger budgets. India is number on producer of films. US is the number one exporter of films. Notice: 65% to Europe 17% to Asia 13% to Americas Revenue: $7 billion (1999)
The market size for films The first observation is that because feature films have high development costs, they also have a relatively large minimum market size for making profit (Vogel, 2003; Caves, 2000; Wasko, 2003; Eliashberg et al. , 2006). The small home markets, for e. g. European films, mean that even when producers here hold production budgets down by opting for low production values, the production of most films hinges upon state subsidies (Moran, 1996; de Turegano, 2006). The countries that have become specialized in film production, i. e. those with a high annual number of non-subsidized feature film releases, are countries with vast home audiences, such as India (1041 film releases in 2005), USA (599 releases in 2006), Japan (417 in 2006), and China (330 in 2006)(figures from European Audiovisual Observatory, 2007). Of course, what matters for such specialization is not merely the size of a home consumer base, but also its purchase power. During the first half of the last century, Hollywood became the world’s largest producer of films on the basis of an increasingly wealthy US population that at the time depended mostly on cinema for mass entertainment. Consumer preferences also matter: In the latter half of the century, India, where the audience remains hugely attached to cinema going, overtook USA as the World’s largest film producer, even if India’s population is smaller than that of China, and its purchase power smaller than USA, Japan, and China. Countries with sizeable home markets are also relatively protected against imports. Due to consumer stylistic and language preferences, imported films generally suffer from liabilities of foreignness, and smaller countries exporting to larger markets are at a disadvantage compared to larger countries exporting to smaller markets (Hoskins and Mirus, 1988; Oh, 2001). For that reason, the countries that capture most of their home markets are India (with a home market share of 94. 1% in 2005), USA (93. 4%) and China (60%) (Screen. Digest, 2006).
12% of all Internet traffic comes from movie downloads and streaming. Note: This chart does not indicate absolute growth, but only relative usage.
Independent Films are rapidly increasing in number. “Independent films represent a new creative area, which we can expect to see substatial growth. Yet the Hollywood majors will most likely continue to take the world share of revenue due to their huge budgets. ” (Allen Scott, A New Map of Hollywood, Regional Studies, Vol. 36. 9, 2002)
Seasonal film attendance
Salary ($1000/yr) Job Probability (inverse percentage) Source: US Bureau of Labor Statistics
Animation – Production / Structure
Animation – Labor (Top Tier) Source: glassdoor. com Dreamworks Animation
Animation - Labor Animation is increasingly outsourced to 3 rd world countries. Entry Animator – USA Entry Animator – India $50, 000 / yr = 23, 000 DKK/mo. $2, 112 / yr = 8000 Rs. = 1, 000 DKK/mo. More outsourcing takes place with 2 D than with 3 D. Lower technology jobs are outsourced first. “Indian animation market, estimated at $494 million in 2008, will likely grow at a rate of 22% till 2012. The industry is poised to touch $100 billion by 2012, aided by increased outsourcing and growing domestic markets. ” Maya Academy of Advanced Cinematics (MAAC), Ram Kumar Worrier http: //www. maacindia. com/ Source: Animation Market in India may hit $1 bn, Business Standard, March 15, 2011. (Press: Trust of India)
Animation - Economics Wall-E Budget: $170 million ( 967 Mdk) Revenue: $521 million (2800 Mdk), $223 m USA, $297 m Intl. Marketing: $150 million ~50% Length: 98 minutes Cost per min: $1, 020, 408 Cost per sec: $ 17, 000
Animation - Economics Wall-E Assume an average hourly rate of $33 / hr Total man hours = $ budget / hourly rate = 3, 030, 000 total hours Total man years = 830 years for one person Work Hours per Minute = 3, 030, 000 hrs / 98 mins = 30, 921 hrs / min Work Days per Film Sec = 51 days / film sec (DPS) This means that one person would need to work for 51 days to produce a completed, animated, rendered second of film. “How much final animation for one character per week? 3 secs / week” (this is equal 2. 3 days / sec) Compare: 2. 30 days / sec - one character, animation only 51. 00 days / sec - animated, rendered, all characters
Animation - Economics Work Days per Film Sec (DPS) Can be used as a measure of film quality. Why? If one studio requires 51 days / film sec, and another requires 6 days / film sec, what are the factors that cause this? - Different techniques will dramatically change DPS (e. g. mocap) - Better techniques will decrease DPS - Rendering time will increase DPS - More time spent on story or animation will increase DPS - Higher DPS will cost more $ per film Assuming the technology is similar across animation studios, then the DPS measures how much quality time is needed to make a second of film.
Elephants Dream Budget: $192, 000 (1 mil DKK) Running time: 10 min, 54 sec Produced entirely with open source software (Blender). Created by a team of seven artists and animators over 8 months. (Hourly rate comes out to: $14 / hr, versus $33 / hr in industry) Rendering took 125 days, using 2. 8 GB per frame using a 2. 1 TFLOPS G 5 XServe
High quality animation takes time and money to produce. Indirect relationship between time/cost and quality of result, which can only be decreased by: 1) talented artists, 2) better technology Impact of 3 D on 2 D Animation (David Mitchell): http: //www. zenoshrdlu. com/zenocgi. htm
Animation - Rendering Moore’s Law: (after 1965 paper) “The number of transistors on an integrated circuit will double every two years. ”
Animation - Rendering Law: “The complexity of rendered models always grows to fit available computing memory and speed. ”
Animation - Rendering Combining Moore’s Law and the Graphics Law… The result is a rendered frame in a motion pictures takes the same amount of time as it did a decade ago. Jurassic Park 16 hrs / frame, 1993 Tyrannosaurus rex, complex lighting, compositing. Monsters, Inc. 13 hrs / frame (Ed Catmull), 2001 Individually rendered hairs, more characters, light scattering http: //magazine. creativecow. net/article/how-cgi-in-commercialschanged-the-history-of-film-a-creative-cow-magazine-extra
Limit to Moore’s law: When transistors wires become smaller than single atoms, they cannot be made any smaller. Parallelism: “Moore’s Law is for wimps”, Sanford Russell (Nvidia) Instead, we can double the number of chips. All modern graphics computing is shifting toward GPU-based computing, parallel programming. Computation power of graphics chips has increased 8 times every 18 months. Most motion picture studios use CPU software written in the 1970/80 s. A whole new trend of GPU-based rendering is just starting.
Render. Ants: Interactive REYES Rendering on GPUs, Zhou et al. , 2009 Up to now, nearly all motion picture rendering uses the REYES system. Polygons are broken down, “diced”, until they are smaller than a pixel. This rendering process removes all jagged edges, produced film quality. (This is why films look crisp, and games look jagged) Micro-polygons are then raytraced. This is now typically done on render farms with 1, 000 s of CPU cores. GPUs have 100 x the processing power of CPUs. However, they don’t have enough memory. GPU programming is hard. GPU Rendering is a very active area, with many unsolved problems. http: //www. 3 dworldmag. com/2011/01/07/pros-and-cons-of-gpu-accelerated-rendering/
Games Industry
US Game Industry Developers Microsoft, EA, Ubi. Soft, Blizzard Publishers Hardware Microsoft, EA, Eidos Sony, Microsoft Royalty Co. Distributors Universal Studios, Disney, Warner Bros. Walmart, Electronic Botique - 5 major groups - Large companies do many things - Total of 144, 400 employees
In the USA, 90% of all game sales come from one distributor: Wal-mart. Games that are purchased by parents around Christmas. Thus, the driving factor in the purchase of games is exposure to the public. How visible is your game? With the exception of major titles, people expect games to be almost free. This causes the price of the majority of games to be driven downward. On Steam, many sophisticated games can be found on sale for $5. 00 - $10. 00 Call of Duty, Black Ops - $13 (68 DKK) Neverwinter Nights - $10 (60 DKK)
US Game Development Example Development Cost $6 mil USD Marketing, Production $4 mil USD Total Cost Purchase Price Must Sell $10 mil USD 30 USD 1, 300, 000 units Examples - Must sell 1, 300, 000 units just to break even. Myst, Riven, Doom - Sequels help recover costs Warcraft II, III, Tomb Raider - US Companies focus on new technology Splinter Cell (shadows) Half Life (physics)
- 6 years to create - Very large teams: 80+ people - $40 million, same cost as a movie - 1. 7 million copies sold $50 USD each = $85 million
Game demand for unique titles is outgrowing new Game designs. Why? Games require new technology to implement new designs. Economic Trends: - “Content is king”. . Recycling content using the same game engine allows for newer titles, at the cost of innovation. - Increasingly larger stake in huge titles with all technology focused on a single game. Attempt to create engines that can “do everything”. - Shortage of skilled engineers moves the games industry into other markets. .
http: //www. alanemrich. com/Writing_Archive_pages/Game_idea_value. htm But there are so many good ideas that have not been tried, why do we need more game programmers? ”Let’s look at the game publishers. They pony up those millions, employ all sorts of talented people, spend countless "man months". Now, I’ve seen a lot of game budgets in my day. I know that most of the money for a game goes for art, programming and material costs. Somewhere down near the bottom of the money barrel is the game’s design. But what you usually don’t find a line for in a budget is the idea or concept for a game (i. e. , that part where you come in). Why? Because everyone has a "great game idea!" And I mean everyone. Marketing knows they do, management thinks they do, the teams in the trenches making these games are very passionate about their ideas regarding what would make a great game. Even the custodian, receptionist, and postman will offer their ideas for what they think would make a great game. It never stops! It is axiomatic that people value least what they have the most of. In the game business, the most common coin of the realm (and, hence, the most worthless) is the "great idea for a game. " No one pays for great ideas, because everyone has them already. What’s really hard to come up with is the millions of dollars, talented teams, clever marketing, and so forth. So, it is with a sigh and a heavy heart that I need to tell you that 1) we don’t sit around playing games all day; 2) we know our games aren’t perfect (and that you believe that you could do better); and 3) that your idea for a great game is truly and absolutely worthless, it won’t make you a penny. Sorry. ” Alan Emrich, Comp. Gaming World magazine
Online Gaming Second Life, Linden Research - Players buy land, build the world - $200, 000 real USD traded every day - 700, 000 residents - Players create and trade skills - 7, 500 active at any time - Content is created by the players
Spore, Will Wright Games, due to their interactivity, are an inherently technical medium. Technology will continue to drive new markets.
Recent Trends – Alternative interfaces Wii, Nintendo (2006) 84 million Kinect, Microsoft (2010) 10 million Guitar Hero, Vicarious Visions / Activision 25 million (2005) Dance Revolution, Konami 3 million (2001)
In both animation and gaming, innovation will increasingly take place at the intersection of new devices, new software, and relationships to other fields. More so than motion pictures (for now), classic ways of making games will be replaced by community methods, online content, virtual worlds, and independent developers. Economically, value will be retained in novel technology (difficult to engineer), and in innovative collaboration (working together). The value of content, and game ideas, will be increasingly shared with the rest of the world.