An Introduction to Chromatographic Methods In its various


 The sample is forced")


 of a column for the two species")


 H")
 H =")
 H =")


 of a column provides a")


 / (1. 11 + 1.")
- Slides: 54
An Introduction to Chromatographic Methods In its various forms chromatography has become the most widely used separation technique of all. It can be used as a means in itself for separation and identification, but when connected to a mass spectrometer it is extremely powerful.
General Description In chromatography, separation of components is achieved by entraining the sample in a mobile phase and allowing it to pass over a stationary phase. Separation takes place because the stationary phase has differing affinities for each of the components entrained in the mobile phase, and these components therefore have different migration rates.
Classification of Chromatographic Methods Two types of chromatography exist: (1) The sample is forced through a narrow tube containing the stationary phase. Gravity or high pressure are used. This is known as column chromatography. (2) The sample is separated on a flat surface of either paper or a layer of inert compound spread on a sheet of plastic or glass. The mobile phase moves through the pores of the stationary phase by capillary action or under the force of gravity. This is known as planar chromatography.
What is chromatography?
What is chromatography? Chromatogram a plot of analyte signal as a function of elution time
Classification of Column Chromatographic Methods
Elution Chromatography The term elution refers to washing the solvent through a column by the constant addition of fresh solvent or mobile phase. This is generally referred to as elution chromatography. The sample to be separated is dissolved in a suitable solvent and added to the top of a column containing stationary phase. This is carried through the column by mobile phase.
Elution Chromatography As the sample is eluted through the column by the mobile phase, it comes into contact with the stationary phase. Components of the sample that are attracted to the stationary phase tend to be held on the stationary phase and take a relatively long time to elute from the column. Components that are less strongly attracted to the stationary phase tend to be eluted more quickly.
Elution Chromatography Continuous transfer of solute between mobile and stationary phase occurs as the sample is washed through the column by solvent. The average rate at which a given solute migrates in the column depends upon the fraction of time it spends in the solvent. It can proceed through the column no faster than the mobile phase. Ideally the separation of components is sufficiently efficient that distinct bands or zones of each of the components is eluted from the column.
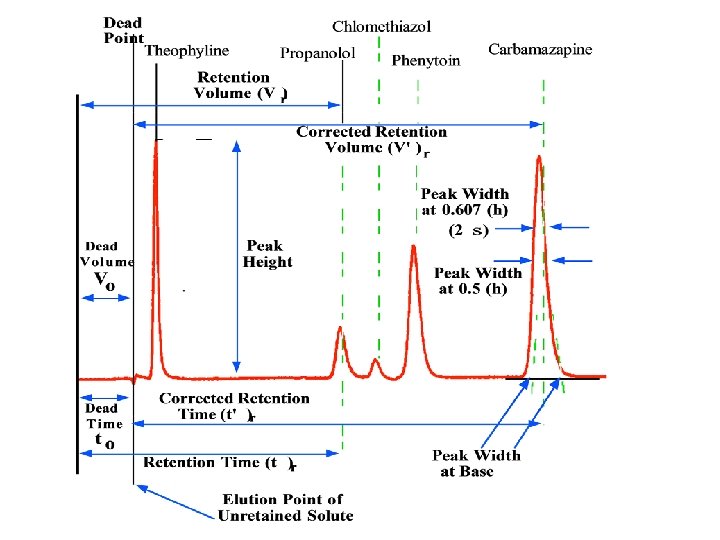
Chromatograms In chromatography a detector is usually placed at the end of the column. This provides an amplified electrical signal which is fed into a readout device. If the readout device is a chart recorder, the resultant display will be a series of peaks, each corresponding to the elution of individual components. It is called a chromatogram. The time at which the maximum in each peak appears (t. R) depends on the component being eluted. This is known as the retention time.
Chromatograms Retention times are used for identification purposes. Each peak area is proportional to the amount of that component present. Thus the technique can be used for quantitative analysis also.
General Aspects of Band Broadening Band broadening occurs because molecules of analyte diffuse longitudinally in the column while they are being eluted. This is particularly important for molecules that are retained on the column for longer time periods. However, the separation between any two peaks increases as the time of elution increases. Longer elution times lead to good peak separation but also to excessively broad peaks if the retention time is too long. The chromatographer must find the right experimental conditions that lead to positive results.
The Effect of Migration Rates and Zone Broadening on Resolution
The Effect of Migration Rates and Zone Broadening on Resolution
Partition Chromatography and Partition Ratios This chromatographic separation technique is the one most widely used and has applications in gas chromatography – gas-liquid chromatography. It depends on the analyte distributing itself between the stationary phase and the mobile phase in the following manner: Amobile ⇌ Astationary. The equilibrium constant for this process is called a partition coefficient or partition ratio and is defined as follows: K = cs/cm. An example would be iodine partitioned between CCl 4 and water
Retention Times The mobile phase takes a certain amount of time to pass through the column (tm). This is known as the dead time. It is the time taken for molecules that are not retained by the stationary phase to pass through the column. Often a peak due to air is used to determine the dead time. Other peaks in the chromatogram are caused by components of a sample passing through the column.
Retention Times The time required for the component to reach the detector after sample injection is known as the retention time. It is given the symbol t. R. It is a parameter used in sample identification. The average linear rate of solute migration, ū, is given by ū = L/t. R, where L is the length of column packing. The average linear velocity of the molecules in the mobile phase, u, is given by: u = L/tm.
Migration Rate and Partition Ratio As the mobile phase moves through the column it takes the solute with it. The rate at which a given component elutes is directly proportional to the fraction of time it spends in the mobile phase. This translates into another equation: ū = u x fraction of time solute spends in mobile phase
Migration Rate and Partition Ratio The fraction of time that a solute molecule spends in the mobile phase is directly proportional to the ratio of the number of moles of solute in the mobile phase at any instant to the total number of moles of solute on the column. ū = u x moles of solute in mobile phase total moles of solute
Migration Rate and Partition Ratio The total number of moles of solute in the mobile phase is equal to the molar concentration, cm, of the solute in that phase multiplied by its volume, Vm. Similarly, the number of moles of solute in the stationary phase is equal to the molar concentration, cs, of the solute in the stationary phase multiplied by its volume, Vs. ū = u x {cm. Vm/(cm. Vm + cs. Vs)} ū = u x {1/(1 + cs. Vs / cm. Vm)}
Migration Rate and Partition Ratio But K = cs/cm Therefore, ū = u x {1/(1 + KVs/Vm)} The two volumes can be measured as the column is being prepared. This expression gives the relationship between the rate of solute migration and its partition ratio.
Migration Rate and Capacity Factor The capacity factor, k', of a solute is a parameter widely used in chromatography to describe the migration rates of solutes on columns. For solute, A, the capacity factor is: k'A = KAVs/Vm. Thus, ū = u x {1/(1 + k'A)} Further manipulation of the equations shows that : k' = (t. R – tm)/tm Since t. R and tm can be determined from the chromatogram, the capacity factor of a given solute is easily determined.
Migration Rate and Capacity Factor Chromatographers attempt to make separations where capacity factors lie between 1 and 5 for the various solutes in a mixture. If the capacity factor is below 1, accurate determination of the retention time is too difficult. If it is too high, the solute will take too long to elute for practical purposes. In gas chromatography the capacity factor can be varied by changing the temperature of the column and/or the column packing.
Capacity factor Retention factor or capacity factor k. A is defined as k. A = K (VS/VM) VS = L /ts k. A = ( t. R –t. M) /t. M
Selectivity Factor The selectivity factor ( ) of a column for the two species A and B is defined as: = KB/KA, where KB is the partition ratio for the more strongly retained species, B, and KA is the partition ratio for the less strongly held or more rapidly eluted solute, A. According to this definition is always greater than one. Another useful expression is: = k'B/k'A, where k' refers to the appropriate capacity factor.
Selectivity Factor Yet another expression that is useful because it relates the selectivity factor to experimentally determined retention times is: = {((t. R)B – tm)/((t. R)A – tm)}. This expression is useful for identifying components of mixtures from their relative retention times.
Rate Theory of Chromatography Chromatographic peaks should be symmetrical because solute molecules do not all spend an equal amount of time in the stationary phase for a given elution. While most of the solute molecules elute at the peak maximum, others lag behind and others push ahead because solute molecules do not all have the same energy.
Column Efficiency The ability of a chromatographic column to separate components of mixtures is known as its efficiency. Two related terms are used as a quantitative measure of column efficiency. These are: (1) plate height, H, and (2) the number of theoretical plates, N. The two are related by the equation: N = L/H where L is the length of the column packing (usually measured in centimetres)
Column Efficiency The idea of a theoretical plate is that partition of the solute between stationary phase and mobile phase takes place at specific sites on the column. These sites are known as theoretical plates. The greater the number of theoretical plates, the greater the efficiency of the column. Also, since columns are of a finite length, it is beneficial to pack as many theoretical plates in a column of a given size. Thus the height equivalent per theoretical plate becomes an important parameter.
Column Efficiency Column efficiency increases as the height equivalent per theoretical plate decreases. Column efficiencies depend on a number of variables such as the type of stationary and mobile phase, the type of column, etc. Efficiencies in terms of plate numbers can vary from a few hundred to several hundred thousand. Plate heights can vary from a few tenths to a thousandth of a centimetre.
Variables that Affect Column Efficiency Several factors combine to cause a band to broaden in a column. When this happens the efficiency of the column decreases because sharpness of peak is lost and the possibility of peak overlap increases.
Effect of Mobile Phase Flow Rate Column efficiency depends on the length of time the mobile phase is in contact with the stationary phase at any given point in the column. This means that column efficiency is dependent on mobile phase flow rate. Graphs of H vs linear flow rate are plotted for a given column. The graph shows a minimum at the flow rate for maximum efficiency (lowest value of H). The object is to establish conditions so that the experimental flow rate is as close to that for maximum column efficiency as possible.
Zone Broadening and Column Efficiency Kinetic Variables Affecting Zone Broadening Mobile-Phase Flow Rate
The van Deemter Equation The theory used to explain how the efficiency of a column varies with the linear velocity of the mobile phase is known as rate theory. van Deemter proposed an equation to show the value of H depends the various parameters; This equation has the form: H = A + B/u + Cu A, B, and C are constants for a particular column and u is the mobile phase velocity.
Band Broadening This is caused by the following factors: Sample is introduced into the column as a band of finite width Diffusion within the column occurs from regions of high solute concentration to regions of low solute concentration Molecules of mobile phase flow along different paths within the column Solute may not establish equilibrium between stationary and mobile phases.
Zone Broadening and Column Efficiency van Deemter Equation - The Multipath Term (A) H = A + B/u + Cu Also known as eddy diffusion
Zone Broadening and Column Efficiency van Deemter Equation - Longitudinal Diffusion (B) H = A + B/u + Cu B/u = Longitudinal diffusion Inversely related to mobile phase flow rate Negative slope due to this term less for LC
Zone Broadening and Column Efficiency van Deemter Equation - Mass Transfer (C) H = A + B/u + Cu C is mass transfer Directly related to mobile phase flow rate
Zone Broadening and Column Efficiency van Deemter Equation - Summary H = A + B/u + (C)u
Zone Broadening and Column Efficiency Effect of Particle Size on Plate Height
Optimization of Column Performance • A chromatographic separation is optimized varying experimental conditions until the components of the mixture are separated cleanly with a minimum expenditure of time. • Optimization experiments are aimed at – reducing zone broadening – altering relative migration rates of components
Optimization of Column Performance Column Resolution • Resolution (RS) of a column provides a quantitative measure of its ability to separate two analytes
Effect of Retention and Selectivity Factors on Resolution Column Resolution • Resolution in terms of retention times and efficiency • Resolution in terms of capacity factors and efficiency
Effect of Retention and Selectivity Factors on Resolution Column Resolution • Resolution in terms of capacity factors, efficiency, and selectivity factors • Efficiency in terms of capacity factors, resolution, and selectivity factors
Variables That Affect Column Performance • Resolution in terms of capacity factors, efficiency, and selectivity factor First term related to the kinetics that lead to band broadening Second term is a selectivity Third term depends on properties of term that is only related to both the solute and the column the properties of the two solutes
Variation In Retention Factor
General Elution Problem
Methods of Reducing Band Broadening For Packed Column: Diameter of the particles making up the column For Capillary Column: Diameter of the column Increasing the temperature Thickness of the film of stationary phase is minimized in Capillary column
For Good Resolution Variation in Plate Height: Increase in the length of the column Reduce particle size of the packing material Diameter of the column Thickness of the liquid film
Variation in the Retention Factor k. B greater than 10 can be avoided Minimum elution time at k. B = 2 Optimize value between 1 -5 k. B can be improved by temperature change in GC k. B can be improved by changing mobile phase composition in LC
Variation in Selectivity Factor Changing composition of the mobile phase Column Temperature Changing the composition of stationary phase - important
Problem 1 Substance A & B have retention times of 16. 40 & 17. 63 min. , respectively, on a 30 cm column. An unretained species passes through the column in 1. 30 min. The peak width at base for A & B areb 1. 11 & 1. 21 min. respectively. Calculate (a) the column resolution (b) the average number of plates in the column (c) the plate height (d) the length of the column required to achieve a resolution of 1. 5 & (e) the time required to elute substance B on the column that gives an Rs value of 1. 5.
Problem 1 R = 2(17. 63 – 16. 40) / (1. 11 + 1. 21) = 1. 06 N = 16(16. 4/1. 11)2 = 3493, N = 16(17. 63/1. 21)2 = 3397, Navg = 3445 H = L/N = 30. 0/3445 = 8. 7 X 10 -3 cm Since k & a do not change greatly with increasing N & L, thus R 1/R 2 = √N 1/√N 2 = 1. 06/1. 5 = √ 3445/√N 2 = 6. 9 x 10³ L = NH = 6. 9 x 103 x 8. 7 x 10 -3 = 60 cm t. R 1 / t. R 2 = (R 1)2 / (R 2)2 = 17. 63/t. R 2 = (1. 06)2/(1. 5)2 t. R 2 = 35 min