Chapter 26 An Introduction to Chromatographic Separations Mobile

Chapter 26 An Introduction to Chromatographic Separations Mobile phase (移動相: gas liquid, or supercritical fluid): dissolve the analyte (solute). Stationary phase (固定相): immiscible with mobile phase. The components strongly retained by the stationary phase move slowly with the mobile phase, while the components that are weakly held by the stationary phase travel quickly. Sample components separate into discrete bands (or zones). 2021/2/23 1
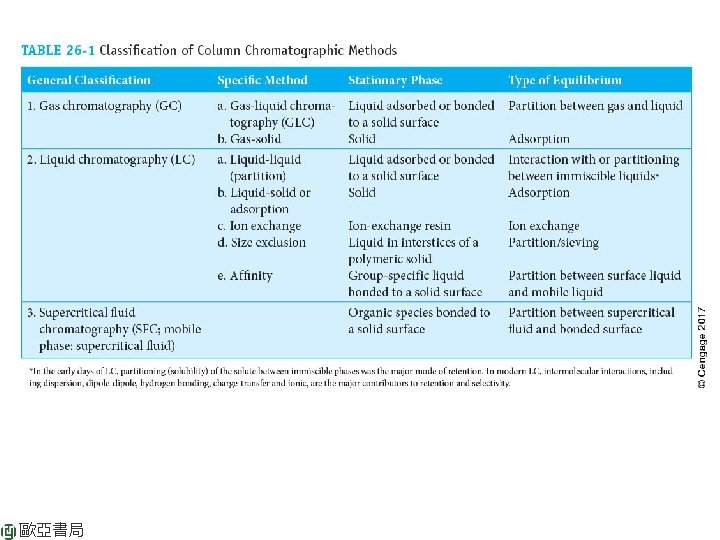
 Diagram showing the separation of a")
Stationary phase band, zone FIGURE 26 -1 (a) Diagram showing the separation of a mixture of components A and B by column elution chromatography. (b) The output of the signal detector at the various stages of elution shown in (a). Chromatogram ( 層析圖) Ch 26 An Introduction to Chromatographic P. 698

FIGURE 26 -2 Concentration profiles of solute bands A and B at two different times in their migration down the column in Figure 26 -1. The times t 1 and t 2 are indicated in Figure 26 -1. Ch 26 An Introduction to Chromatographic P. 699
 increase the rate of band separation and (2) decrease the")
To improve separation: (1) increase the rate of band separation and (2) decrease the rate of band spreading (broadening). Several chemical and physical variables influence the rates of band separation and broadening. FIGURE 26 -3 Two-component chromatogram illustrating two methods for improving separation: (a) original chromatogram with overlapping peaks; (b) improvement brought about by an increase in band separation; (c) improvement brought about by a decrease in the widths. Ch 26 An Introduction to Chromatographic P. 699

26 B Migration Rates of Solutes relative elution rates depend on distribution constants (partition ratio, partition coefficient): Kc = c. S/c. M = (n. S/VS)/(n. M/VM Retention factor (滯留因子) k. A = KAVS/VM = (t. R – t. M)/t. M = t. R’/t. M ≧ 0 Selectivity factor (選擇因子) a = KB/KA = k. B/k. A = [(t. R)B – t. M] / [(t. R)A - t. M] ≧ 1 FIGURE 26 -4 A typical chromatogram for a two-component mixture. The small peak on the left represents a solute that is not retained on the column and so reaches the detector almost immediately after elution is begun. Thus, its retention time t. M is approximately equal to the time required for a molecule of the mobile phase to pass through the column. Ch 26 An Introduction to Chromatographic P. 700

26 C Band Broadening and Column Efficiency The efficiency of a chromatographic column is affected by the amount of band broadening. Rate theory: random-walk mechanism for the migration of molecules through a column → Gaussian or normal error curves. Distribution constant varies with concentration. FIGURE 26 -5 Illustration of fronting and tailing in chromatographic peaks. Ch 26 An Introduction to Chromatographic P. 701
 H: plate height; N: plate count")
Column efficiency: N = L/H (the same compound) H: plate height; N: plate count or number of theoretical plates FIGURE 26 -6 Definition of plate height H = σ2/L. In (a) the column length is shown as the distance from the sample entrance point to the detector. In (b) the Gaussian distribution of sample molecules is shown. Ch 26 An Introduction to Chromatographic P. 702
 s = Lt/t. R s = LW/4")
H =s 2/L t = s/(L/t. R) s = Lt/t. R s = LW/4 t. R H = LW 2/16 t. R 2 N = L/H = 16(t. R/W)2 = 5. 54 (t. R/W 1/2)2 W 1/2 W = 4 t FIGURE 26 -7 Determination of the number of plates N = 16 (t. R / W)2. Ch 26 An Introduction to Chromatographic P. 704
2 : Band broadening")
26 C-3 Kinetics Variables affecting Column Efficiency N = 16(t. R/W)2 : Band broadening reflects a loss of column efficiency. The slower the rate of mass-transfer processes occurring while a solute migrate through the column, the broader the band at the column exit. TABLE 26 -2 Variables That Influence Column Efficiency Ch 26 An Introduction to Chromatographic P. 704

Effect of mobile-phase flow rate: N = L/H van Deemter plot < 25 cm * faster separation * higher efficiency > 50 m FIGURE 26 -8 Effect of mobile-phase flow rate on plate height for (a) LC and (b) GC. Note very different flow rate and plate height scales. 1) The minimum for LC usually occurs at flow rates well below those for GC. 2) Higher flow rates of GC result in shorter separation times. 3) Plates heights (H) for LC columns are an order of magnitude or more smaller than those encountered with GC columns. Ch 26 An Introduction to Chromatographic P. 705
 + CSu")
Theory of Band Broadening: van Deemter equation: H = A + (B/u) + CSu + Cmu……. (26 -23) A: multiple path effects (eddy diffusion) B: longitudinal diffusion coefficient CS: mass-transfer coefficient for stationary phase CM: mass-transfer coefficient for mobile phase TABLE 26 -3 Processes That Contribute to Band Broadening
 + CSu + Cmu……. (26 -23)")
van Deemter equation: H = A + (B/u) + CSu + Cmu……. (26 -23) A = 2 ldp Multiple path effect: eddy diffusion FIGURE 26 -9 Typical pathways of two molecules during elution. Note that the distance traveled by molecule 2 is greater than that traveled by molecule 1. Thus, molecule 2 will arrive at B later than molecule 1. Ch 26 An Introduction to Chromatographic P. 706
 + CSu + Cmu FIGURE 26")
van Deemter equation: H = A + (B/u) + CSu + Cmu FIGURE 26 -10 Contribution of various mass-transfer terms to plate height. Csu arises from the rate of mass transfer to and from the stationary phase, CMu comes from a limitation in the rate of mass transfer in the mobile phase, and B/u is associated with longitudinal diffusion. Ch 26 An Introduction to Chromatographic P. 707

FIGURE 26 -11 Effect of particle size on plate height for a packed GC column. The numbers to the right of each curve are particle diameters. Ch 26 An Introduction to Chromatographic P. 707

FIGURE 28 -2 Effect of particle size of packing and flow rate on plate height H in LC. Column dimensions: 30 cm × 2. 4 mm. Solute: N, N’-diethyl-p-aminoazobenzene. Mobile phase: mixture of hexane, methylene chloride, isopropyl alcohol. van Deemter equation: H = A + B/u +CMu + CSu 歐亞書局 Ch 28 Liquid Chromatography P. 707
![Retention factor: k. A = [(t. R)A – t. M]/t. M k. B =](http://slidetodoc.com/presentation_image_h/0c40c23edd2f36e7c7844ff702162415/image-17.jpg "Retention factor: k. A = [(t. R)A – t. M]/t. M k. B =")
Retention factor: k. A = [(t. R)A – t. M]/t. M k. B = [(t. R)B – t. M]/t. M Selectivity factor: a = k. B/k. A = [(t. R)B – t. M]/[(t. R)A – t. M] Plate count: N = 16(t. R/W)2, N = L/H van Deemter eq. : H = A + B/u + Csu + CMu

26 D Optimization of Column Performance: A chromatographic separation is optimized by varying experimental conditions until the components of a mixture are separated cleanly in a minimum amount of time. (1) Reduce zone broadening (H). (2) Alter relative migration rates of the components (k, a). Resolution (Rs): how far apart two bands are relative to their widths. It provides a quantitative measure of the ability of the column to separate two analytes. Rs = 2 DZ/(WA + WB) = Rs(N, k, a) (1) = 2 [(t. R)B – (t. R)A]/(WA + WB) (2) = (√N/4)(a-1/a)(k. B/1+k. B) -------------(26 -25) (3) (t. R)B = (16 Rs 2 H/u)(a/a-1)2(1+k. B)3/(k. B)2 -------(26 -29) Goal: select conditions to achieve clean separation in a minimum amount of time.
. The")
FIGURE 26 -12 Separation at three resolution values: Rs = 2ΔZ/(WA + WB). The peak heights have been adjusted to be approximately the same in each case. Ch 26 An Introduction to Chromatographic P. 708
(a-1/a)(k. B/1+k. B)-----------(26 -25) (t. R)B = (16 Rs 2 H/u)(a/a-1)2(1+k. B)3/(k.")
Rs = (√N/4)(a-1/a)(k. B/1+k. B)-----------(26 -25) (t. R)B = (16 Rs 2 H/u)(a/a-1)2(1+k. B)3/(k. B)2 ------(26 -29) Kinetic effects lead to band broadening: √N or H/u (1 st term). Thermodynamics: 2 nd and 3 rd terms a: depends solely on the properties of the two solutes for given mobilephase and stationary-phase combination. k: depends on the properties of both the solute and the column. The N (or H), a, and k can be adjusted more or less independently to seek optimal conditions. Variation in N: change L, change H = f(u, dp, viscosity, df) Variation in H: H = f(u, dp, viscosity, df) Variation in k: vary temperature (GC) or composition of mobile phase (LC) or column packing. (Fig. 26 -13) Variation in a: maintain k = 1 -10 → (1) change composition of MP, (2) temperature, (3) change composition of SP, (4) use special chemical effects. Ch 26 An Introduction to Chromatographic P. 778
 + CSu")
Theory of Band Broadening: van Deemter equation: H = A + (B/u) + CSu + Cmu……. (26 -23) A: multiple path effects (eddy diffusion) B: longitudinal diffusion coefficient CS: mass-transfer coefficient for stationary phase CM: mass-transfer coefficient for mobile phase TABLE 26 -3 Processes That Contribute to Band Broadening
(a-1/a)(k. B/1+k. B) = Q(k. B/1+k. B)-----------(26 -25) (t. R)B = (16")
Rs = (√N/4)(a-1/a)(k. B/1+k. B) = Q(k. B/1+k. B)-----------(26 -25) (t. R)B = (16 Rs 2 H/u)(a/a-1)2(1+k. B)3/(k. B)2 = Q’(1+k. B)3/(k. B)2 ------(26 -29) FIGURE 26 -13 Effect of retention factor k. B on resolution Rs and elution time (t. R)B. It is assumed that Q and Q’ remain constant with variations in k. B. 歐亞書局
 to optimize k. FIGURE 26 -14 Effect of solvent variation")
Change solvent composition (polarity) to optimize k. FIGURE 26 -14 Effect of solvent variation on chromatograms analytes: (1) 9, 10 -anthraquinone; (2) 2 -methyl-9, 10 -anthraquinone; (3) 2 -ethyl-9, 10 -anthraquinone; (4) 1, 4 -dimethyl-9, 10 -anthraquinone; (5) 2 -t-butyl-9, 10 -anthraquinone. Ch 26 An Introduction to Chromatographic P. 711

k =1~5 FIGURE 26 -15 The general elution problem in chromatography. Solution: change the conditions that determine the values of k as the separation proceeds (stepwise or continuously). For LC: vary the composition of the mobile phase (gradient elution or solvent programming). Isocratic elution For GC: change the temperature (temperature programming). Ch 26 An Introduction to Chromatographic P. 712

26 E Summary of Chromatographic Relationships TABLE 26 -4 Important Chromatographic Quantities and Relationships Ch 26 An Introduction to Chromatographic P. 713

TABLE 26 -5 Important Derived Quantities and Relationships Ch 26 An Introduction to Chromatographic P. 714

26 F Applications of Chromatography 26 F-1 Qualitative Analysis: retention time Chromatographic separation is an essential step in qualitative spectroscopic analyses. 26 F-2 Quantitative Analysis * Analysis Based on Peak height: 5 -10% error. * Analysis Based on Peak area: 2 -5% error. * Calibration and Standards External-standard calibration: error arises from uncertainty in the volume of sample, or the rate of injection. The Internal-Standard Method: The highest precision for quantitative chromatography (A a/AIS versus conc. ). The Area-Normalization Method: avoids the uncertainties associated with sample injection.
- Slides: 27