A Survey on Software Architecture Analysis Methods Liliana

- Slides: 98
A Survey on Software Architecture Analysis Methods Liliana Bobrica and Eila Niemela IEEE TOSE July 02 740 f 02 presentations 23 1
S/W Architecture Reengineering Zhigang Xie Ryan Young Jinhua Wang Vishal Solipuram Feng Chen 740 f 02 presentations 23 Ravi Athipatla Shufeng Li Krishan Narasimhan 2
What is SBAR? u Abbreviation for Scenario-based Architecture Re- engineering u “SBAR estimates the potential of the designed architecture to reach the software quality requirements. ” • L. Dobrica: A Survey on Software Architecture Analysis Methods 740 f 02 presentations 23 3
Importance of SBAR u A system is never a pure real-time system, or a fault-tolerant system, or a re-usable system. u Single non-functional requirement (NFR) is not a satisfactory measurement, since NFRs often conflict. u In a realistic system a balance of NFRs is needed for an accurate assessment of a software architecture. 740 f 02 presentations 23 4
Assessing Quality Attributes 1. Scenarios 2. Simulation 3. Mathematical Modeling 4. Experience-based Reasoning 740 f 02 presentations 23 5
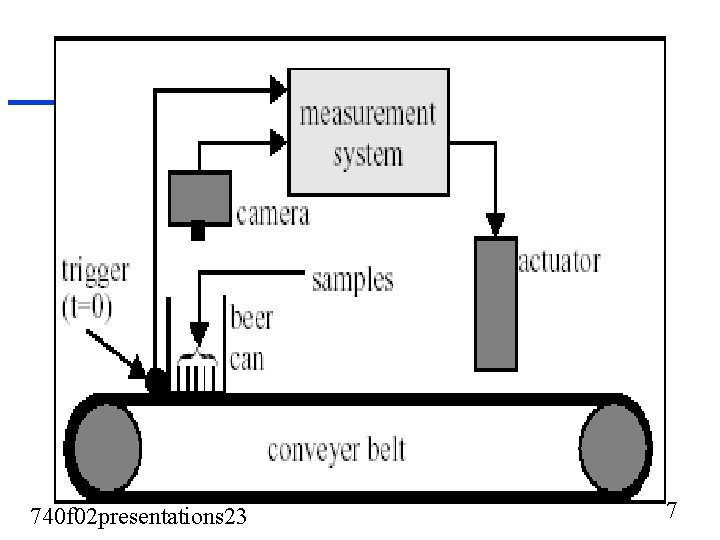
An Example…. . u Beer Can Inspection System: • To illustrate the architecture reengineering method, a beer can inspection system is used. • The inspection system is placed at the beginning of beer can filling process and its goal is to remove dirty beer cans from the input stream. Clean cans should pass the system without any further action. • The system consists of a triggering sensor, a camera and an actuator that can remove cans from conveyer belt. 740 f 02 presentations 23 6
740 f 02 presentations 23 7
Functions u When a can is detected, the system receives a trigger from a hardware trigger. u After a predefined amount of time, the camera samples an image of the can. This sampling is repeated a few times and subsequently the measured images are compared to ideal images and a decision about removing or not removing the can is made. u If the can should be removed, actuator is invoked at a point in time relative to the point in time when the trigger event took place. 740 f 02 presentations 23 8
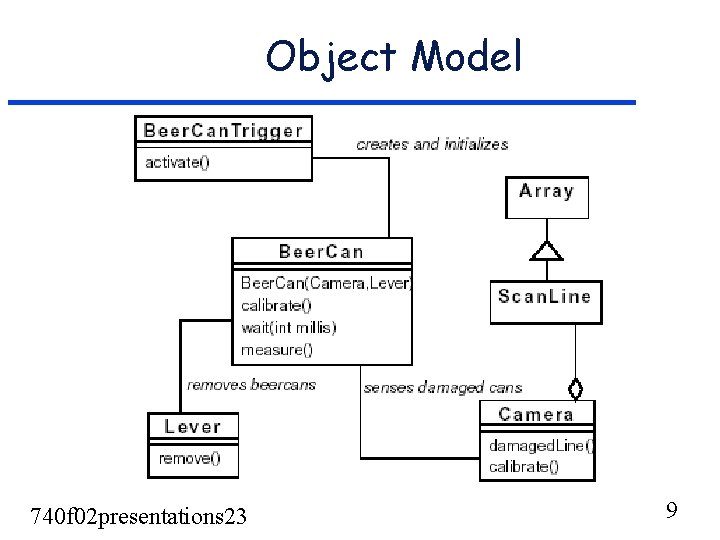
Object Model 740 f 02 presentations 23 9
Author’s Experience u u u Generally we handle S/W quality requirements by an informal process. If found short-comings, then re-design iteratively over system development, but this proves very costly. S/W quality requirements often conflict • Real-time Vs Reusability • Flexibility Vs Efficiency • Reliability Vs Flexibility u Conventional design methods focus on a single quality attribute and treat all others as having secondary importance. 740 f 02 presentations 23 10
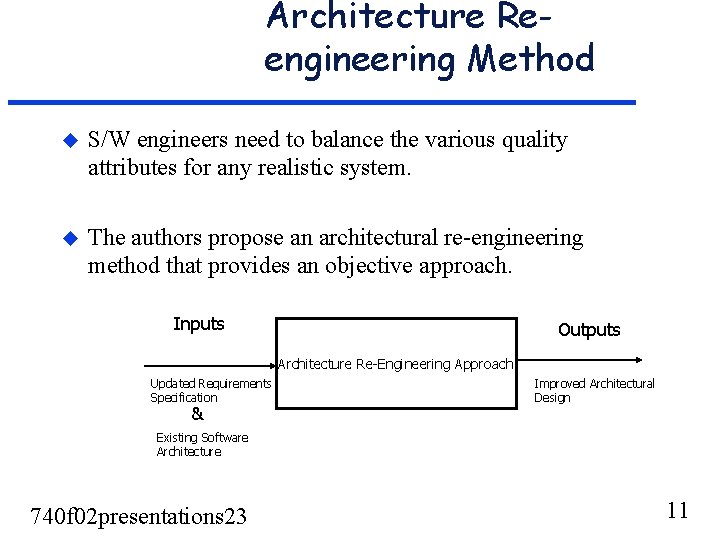
Architecture Reengineering Method u S/W engineers need to balance the various quality attributes for any realistic system. u The authors propose an architectural re-engineering method that provides an objective approach. Inputs Outputs Architecture Re-Engineering Approach Updated Requirements Specification & Improved Architectural Design Existing Software Architecture 740 f 02 presentations 23 11
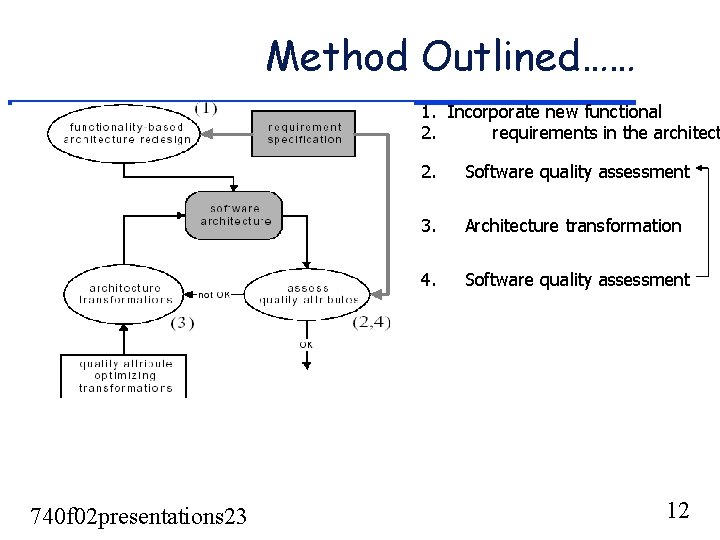
Method Outlined…… 1. Incorporate new functional 2. requirements in the architect 740 f 02 presentations 23 2. Software quality assessment 3. Architecture transformation 4. Software quality assessment 12
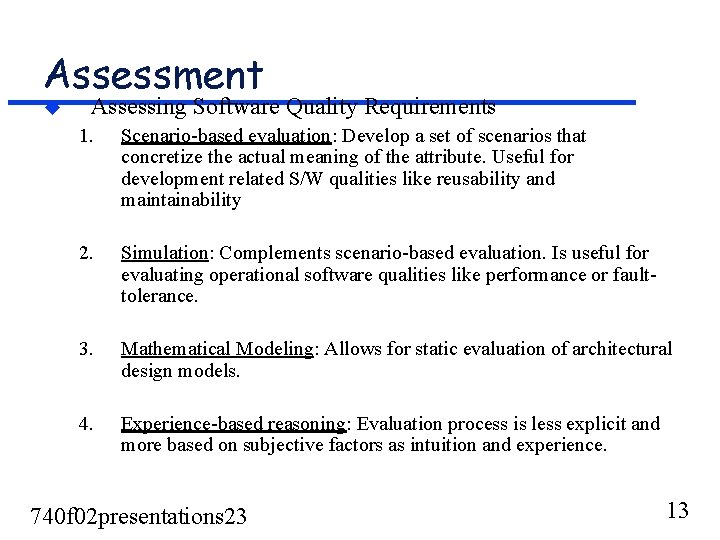
Assessment u Assessing Software Quality Requirements 1. Scenario-based evaluation: Develop a set of scenarios that concretize the actual meaning of the attribute. Useful for development related S/W qualities like reusability and maintainability 2. Simulation: Complements scenario-based evaluation. Is useful for evaluating operational software qualities like performance or faulttolerance. 3. Mathematical Modeling: Allows for static evaluation of architectural design models. 4. Experience-based reasoning: Evaluation process is less explicit and more based on subjective factors as intuition and experience. 740 f 02 presentations 23 13
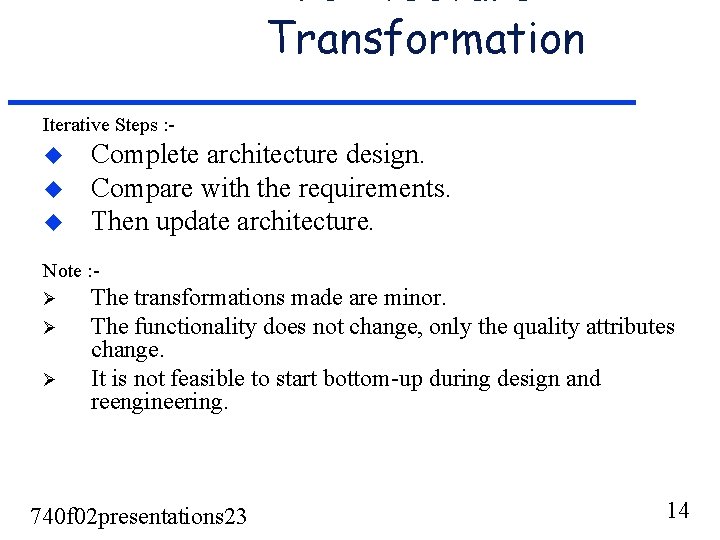
Architecture Transformation Iterative Steps : - u u u Complete architecture design. Compare with the requirements. Then update architecture. Note : - Ø Ø Ø The transformations made are minor. The functionality does not change, only the quality attributes change. It is not feasible to start bottom-up during design and reengineering. 740 f 02 presentations 23 14
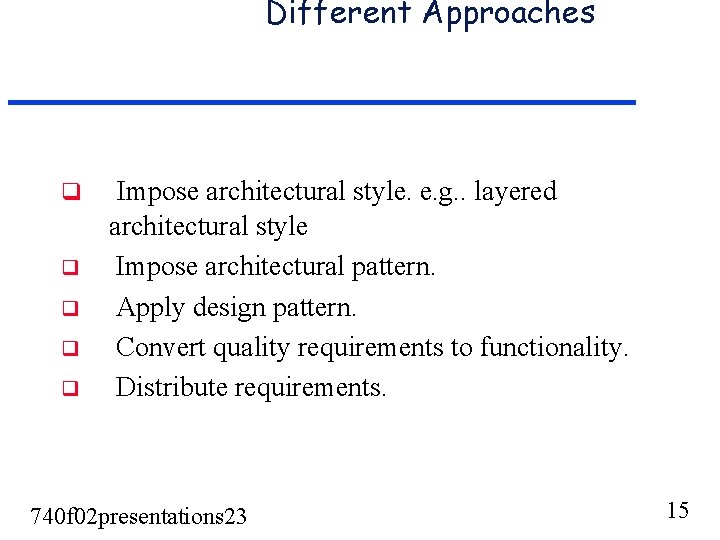
Different Approaches q q q Impose architectural style. e. g. . layered architectural style Impose architectural pattern. Apply design pattern. Convert quality requirements to functionality. Distribute requirements. 740 f 02 presentations 23 15
S/W Quality Requirements u u u Functional requirements generally can be evaluated relatively easy by tracing the requirements in the design. On the other hand, S/W quality requirements are much harder to assess. Few such quality requirements are: • • u Reusability Maintainability Real-time Robustness As mentioned previously, development related S/W qualities are easiest assessed using scenarios. 740 f 02 presentations 23 16
Reusability u u This quality attribute should provide a balance between generality and specifics. The architecture and its components should be general since they should be applied in other similar situations. The architecture should provide concrete functionality that provides considerable benefit when it is reused. Five scenarios that are tested in this article: • • • R 1: Product packaging quality control R 2: Surface finish quality control R 3: Quality testing of micro-processors R 4: Product sorting and labeling R 5: Intelligent quality assurance system 740 f 02 presentations 23 17
Maintainability u u The goal here is that the most likely changes in requirements are incorporated in the software system against minimal effort. Five scenarios that are tested in this article are: • M 1: The types of input or output devices used in the system is excluded from the suppliers assortment and need to be changed, by the S/W. • M 2: The S/W needs to be modified to implement new calculation algorithms. • M 3: The method of calibration is modified. • M 4: The external systems interface for data exchange. • M 5: The hardware platform is updated, with new processor and I/O interface. 740 f 02 presentations 23 18
Applying SBAR Iterative process until quality requirements are met: • Evaluate software quality attributes of the application architecture • Identify the most prominent deficiency • Transform the architecture to remove the deficiency 740 f 02 presentations 23 19
Evaluation How much re-use is possible? u How much will I be able to reuse the software u Ratio of Re-used components ‘as-is’ number of components to the total u As close to 1 as possible u Presence of high coupling limits the possibility of re-use 740 f 02 presentations 23 20
Evaluation Effort needed to maintain u How easy is it to fix u Ratio of Affected components to Total components u As close to 0 as possible u Changes usually require many components to be modified 740 f 02 presentations 23 21
Transformations Component-level Problem: New item type requires the source code of most components to be changed Transformation: specific type generic type Result: Improves reusability and maintainability 740 f 02 presentations 23 22
Transformations Abstraction Problem: Type dependence at component creation Transformation: Use Abstract Factory pattern Results: Improves maintainability 740 f 02 presentations 23 23
Transformations Choose Strategy Problem: Changes have to be made in every component performing similar task Transformation: Apply the Strategy pattern Results: Gained maintainability outweighs loss in reusability 740 f 02 presentations 23 24
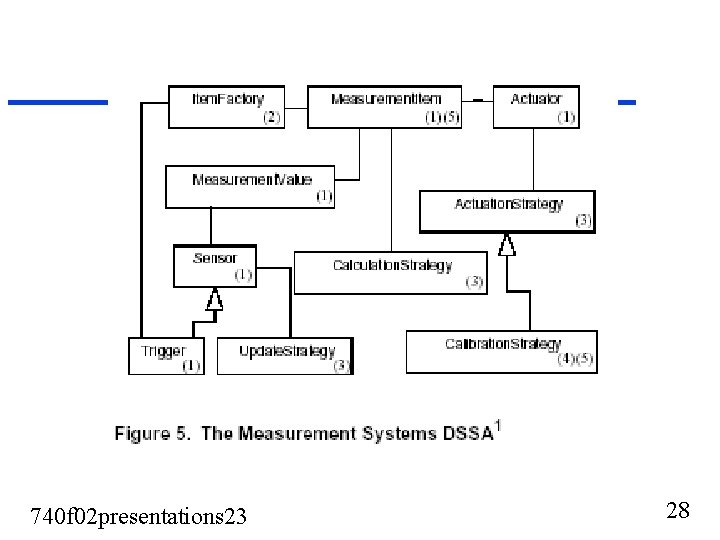
Transformations Decrease Dependence on Global State Problem: Calibration of the measurement system Transformation: Introduce calibration strategy Results: Improves maintainability 740 f 02 presentations 23 25
Reduce Coupling between calibration & measurement Problem: Coupling between calibration strategy and the measurement item. Transformation: Apply Prototype design pattern. Results: Improves maintainability and reusability. 740 f 02 presentations 23 26
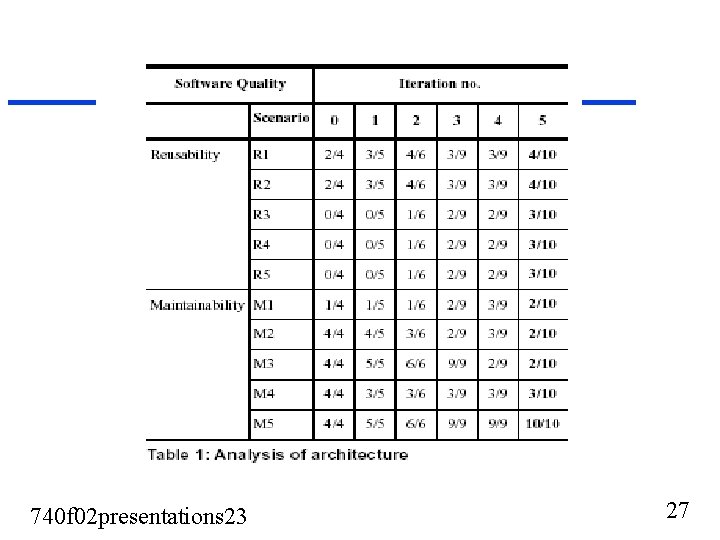
740 f 02 presentations 23 27
740 f 02 presentations 23 28
Evaluation u Overall, the result from the transformations is satisfying and the analysis of the scenarios shows substantial improvement (author’s conclusion). u Each iteration seems to solve a problem concerning some attribute. The drawback may be that, we do not have a prior idea of how many iterations it is going to take. u Identifying all possible problems that may lead to difficulties in re-use and maintainability is a challenging task in itself. 740 f 02 presentations 23 29
References • A Survey on Software Architecture Analysis Methods, L. Dobrica • Scenario-based Software Architecture Reengineering, Per. Olof Bengtsson & Jan Bosch 740 f 02 presentations 23 30
Architecture Level Prediction of Software Maintenance Per. Olof Bengtsson & Jan Bosch University of Karlskrona/Ronneby Sweden 740 f 02 presentations 23 31
Architecture Level Prediction of Software Maintenance Presented by group 4 & 9 1. 2. CIS 740 Instructor: Dr. David A. Gustafson 3. 4. 5. 6. 7. 740 f 02 presentations 23 Manish Sharma Walamitien Oyenan John Hoestje Nur Shahabudin Lakshmikanth Ganti Daniel Clemons Lori Frank 32
Introduction u Software Architecture • Sets the boundaries for the software quality • Balance between performance, reliability and maintainability • Improve adaptability to changes 740 f 02 presentations 23 33
Introduction u Traditional Object Oriented Design • Prime Focus – Functionality • No support for software quality 740 f 02 presentations 23 34
Goal u A method for the prediction of software maintainability during software architecture design considering: • • Requirement Specification Architecture Design Software Expertise Historical Data 740 f 02 presentations 23 35
Software Maintainability as per IEEE “The ease with which a software system or component can be modified to correct faults, improve performance or other attributes, or adapt to a changed environment” 740 f 02 presentations 23 36
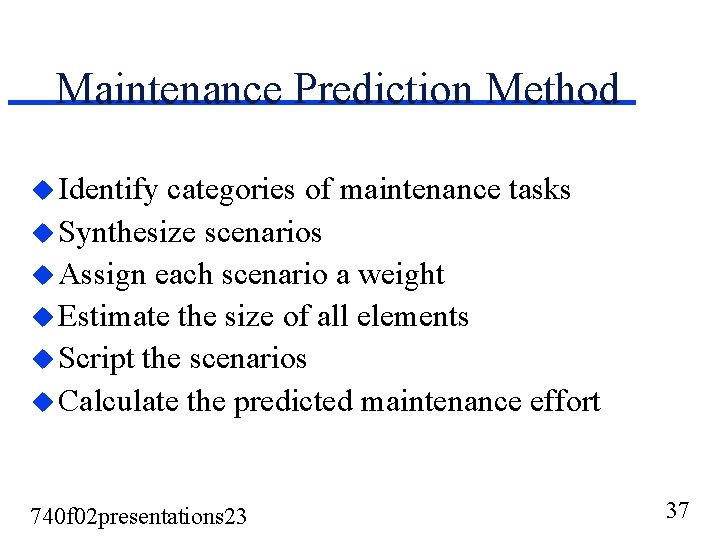
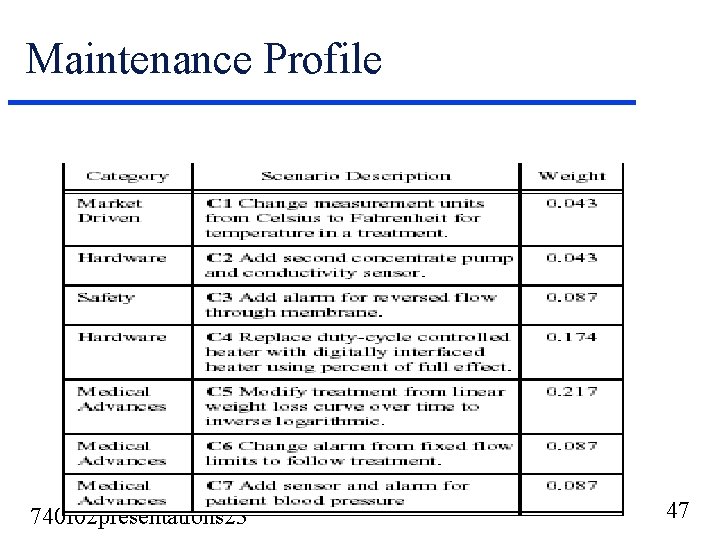
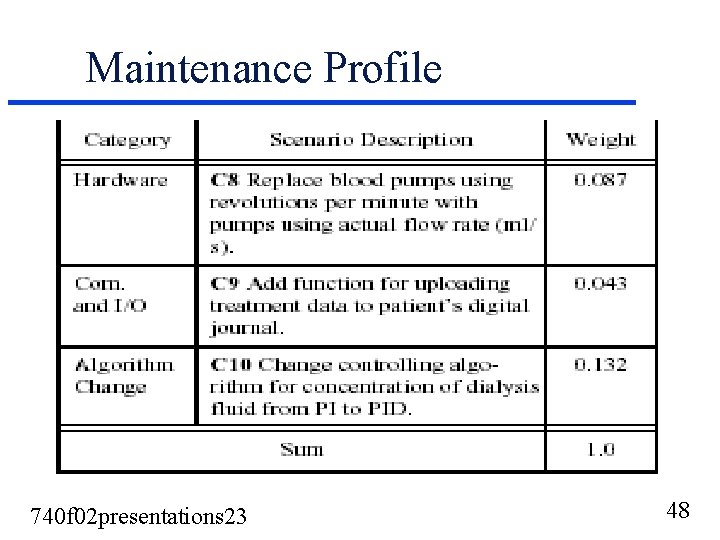
Maintenance Prediction Method u Identify categories of maintenance tasks u Synthesize scenarios u Assign each scenario a weight u Estimate the size of all elements u Script the scenarios u Calculate the predicted maintenance effort 740 f 02 presentations 23 37
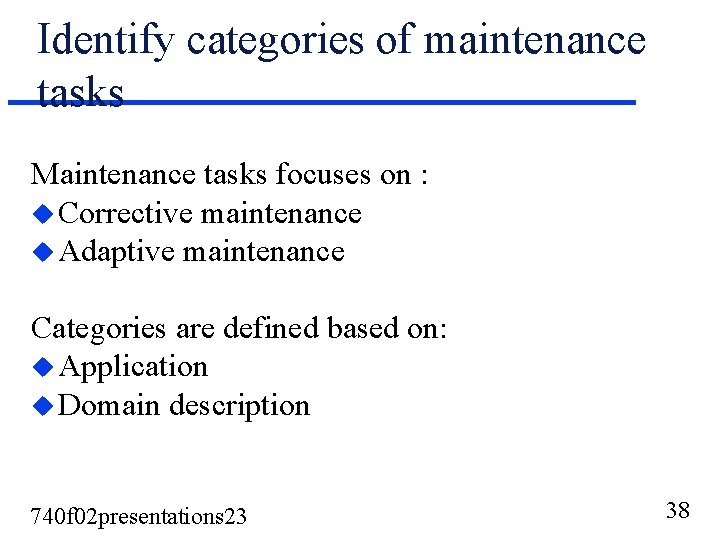
Identify categories of maintenance tasks Maintenance tasks focuses on : u Corrective maintenance u Adaptive maintenance Categories are defined based on: u Application u Domain description 740 f 02 presentations 23 38
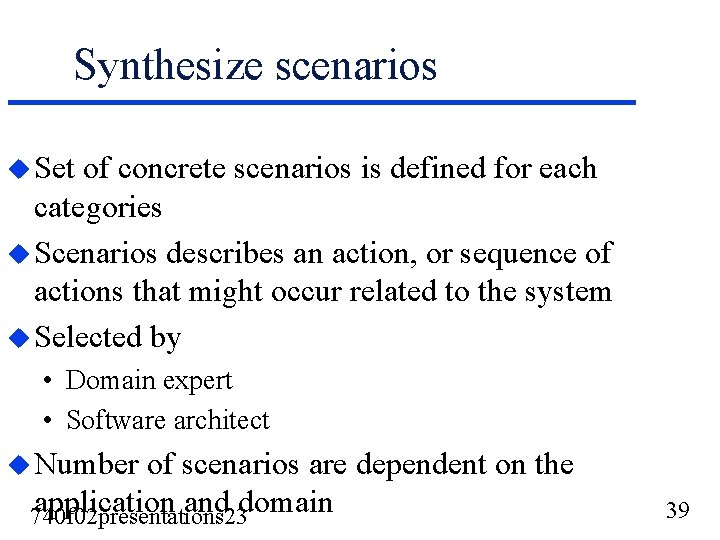
Synthesize scenarios u Set of concrete scenarios is defined for each categories u Scenarios describes an action, or sequence of actions that might occur related to the system u Selected by • Domain expert • Software architect u Number of scenarios are dependent on the application and domain 740 f 02 presentations 23 39
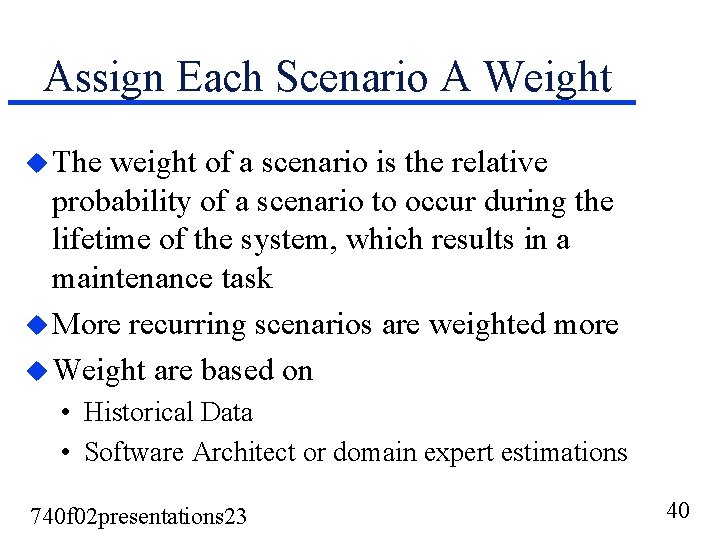
Assign Each Scenario A Weight u The weight of a scenario is the relative probability of a scenario to occur during the lifetime of the system, which results in a maintenance task u More recurring scenarios are weighted more u Weight are based on • Historical Data • Software Architect or domain expert estimations 740 f 02 presentations 23 40
Estimate the size of all elements u Maintenance Efforts are based on; • Estimation techniques of choice (LOC) • Metric • Historical data from similar applications 740 f 02 presentations 23 41
Script the scenarios u Scenarios are scripted to evaluate • Affected components • Extent of change 740 f 02 presentations 23 42
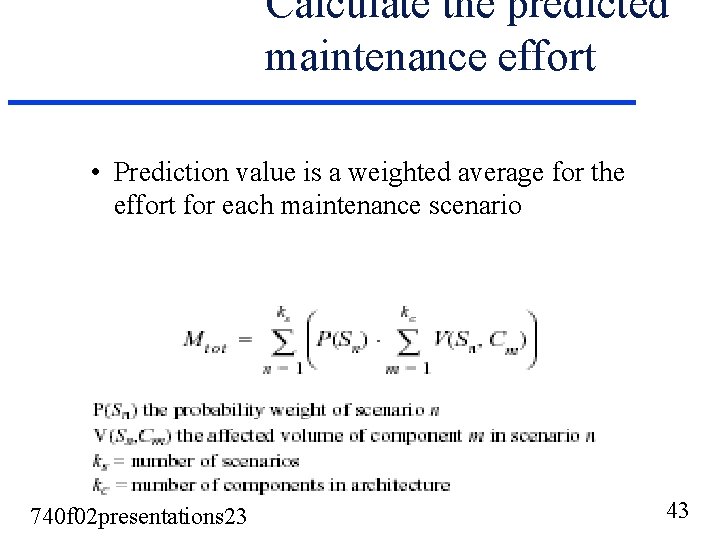
Calculate the predicted maintenance effort • Prediction value is a weighted average for the effort for each maintenance scenario 740 f 02 presentations 23 43
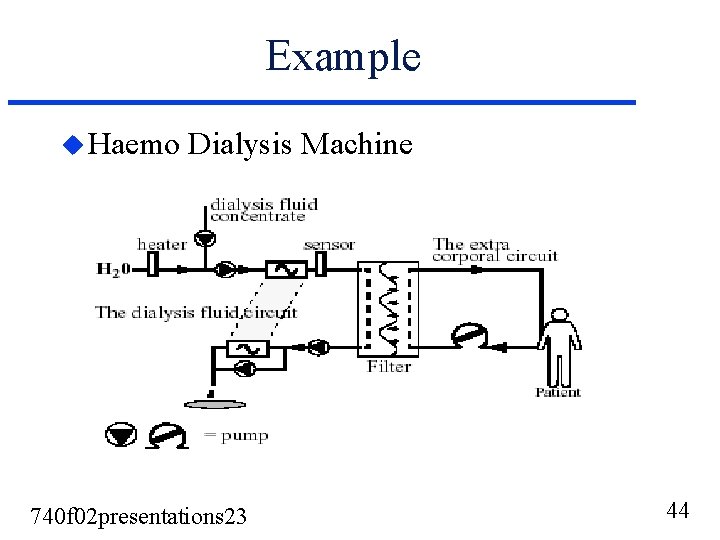
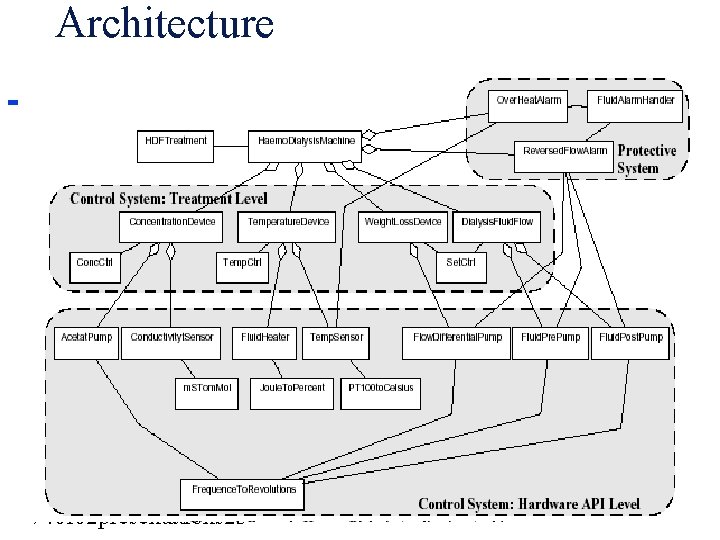
Example u Haemo Dialysis Machine 740 f 02 presentations 23 44
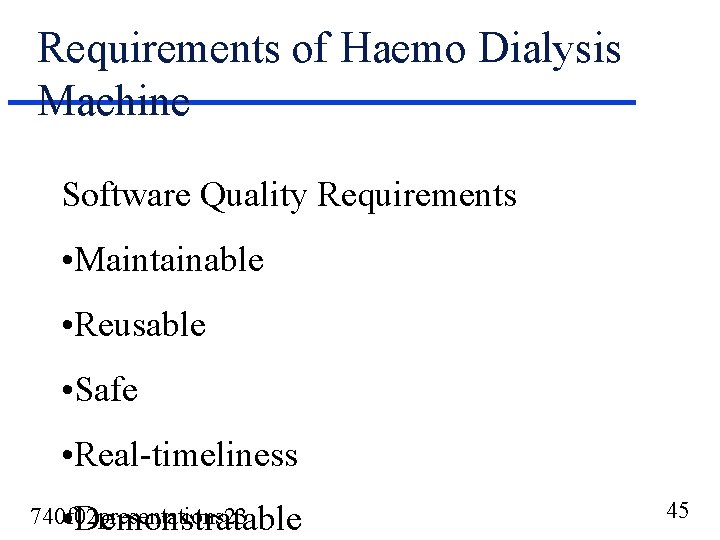
Requirements of Haemo Dialysis Machine Software Quality Requirements • Maintainable • Reusable • Safe • Real-timeliness 740 f 02 presentations 23 • Demonstratable 45
Architecture 740 f 02 presentations 23 46
Maintenance Profile 740 f 02 presentations 23 47
Maintenance Profile 740 f 02 presentations 23 48
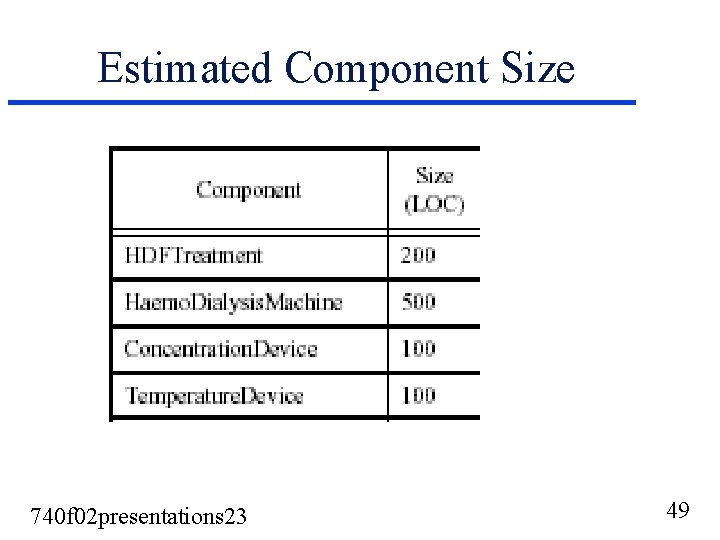
Estimated Component Size 740 f 02 presentations 23 49
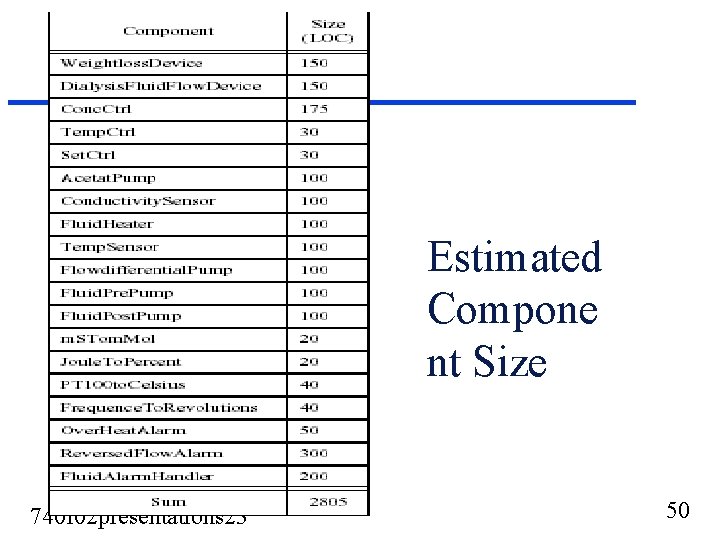
Estimated Compone nt Size 740 f 02 presentations 23 50
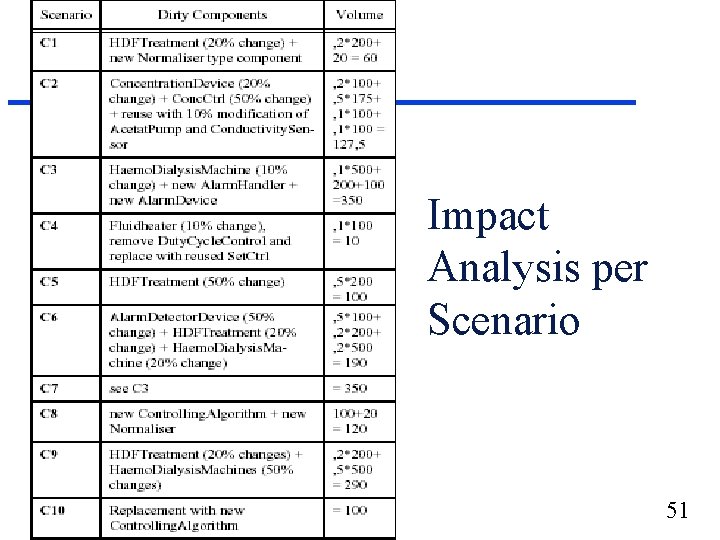
Impact Analysis per Scenario 740 f 02 presentations 23 51
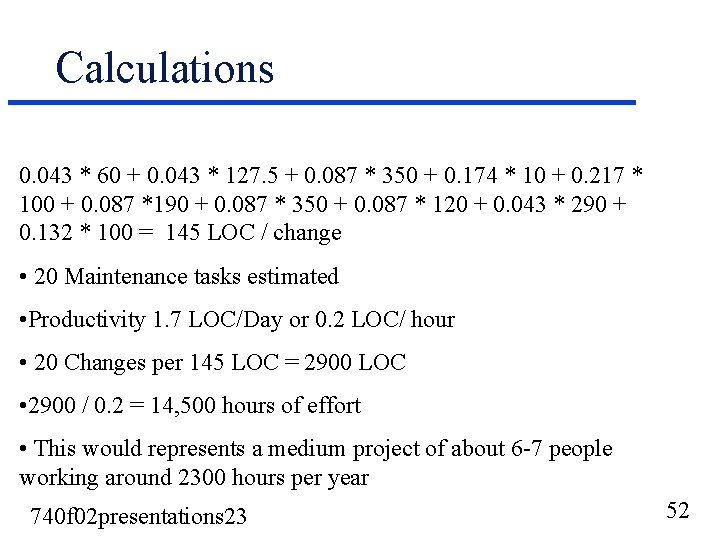
Calculations 0. 043 * 60 + 0. 043 * 127. 5 + 0. 087 * 350 + 0. 174 * 10 + 0. 217 * 100 + 0. 087 *190 + 0. 087 * 350 + 0. 087 * 120 + 0. 043 * 290 + 0. 132 * 100 = 145 LOC / change • 20 Maintenance tasks estimated • Productivity 1. 7 LOC/Day or 0. 2 LOC/ hour • 20 Changes per 145 LOC = 2900 LOC • 2900 / 0. 2 = 14, 500 hours of effort • This would represents a medium project of about 6 -7 people working around 2300 hours per year 740 f 02 presentations 23 52
Conclusion Advantages: • Practical • Improved project understanding • Accurate prediction of scenarios using combination of historical data and design expertise • Efficiently produce artifact with respect to time • Suitable for iterative design processes 740 f 02 presentations 23 53
Conclusion Our opinion: • Being able to predict early in the software lifecycle helps to produce more quality software • So architecture level prediction of software maintenance is a very useful method • However the some estimation will be hard to predict without prior experience and empirical data 740 f 02 presentations 23 54
A Software Architecture Evaluation Model SAEM Presented by: Jeff Hank, Ping Li, Zhihong Zeng Gregory Matthews, Yong Peng 740 f 02 presentations 23 55
Summary u SAEM is based on ISO/IEC 14598 -1 quality evaluation model u SAEM implements this standard as a means of predicting quality of a product based on it’s SA. u SAEM Identifies quality attributes • External quality expresses the user’s view • Internal quality expresses the developer’s view 740 f 02 presentations 23 56
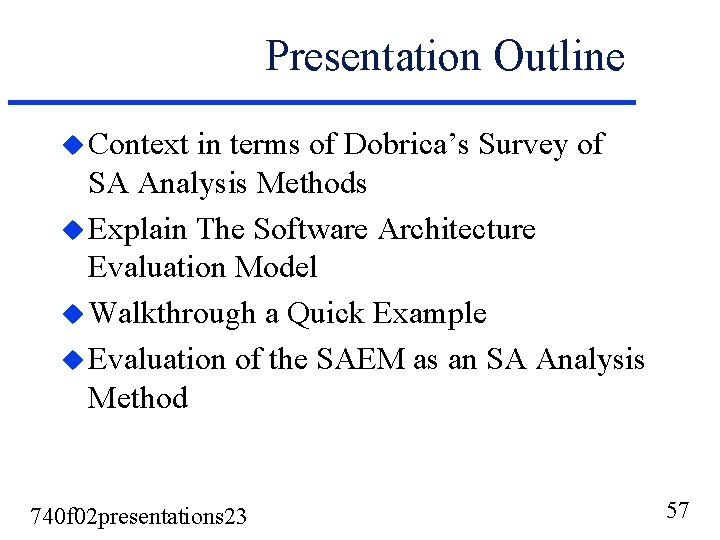
Presentation Outline u Context in terms of Dobrica’s Survey of SA Analysis Methods u Explain The Software Architecture Evaluation Model u Walkthrough a Quick Example u Evaluation of the SAEM as an SA Analysis Method 740 f 02 presentations 23 57
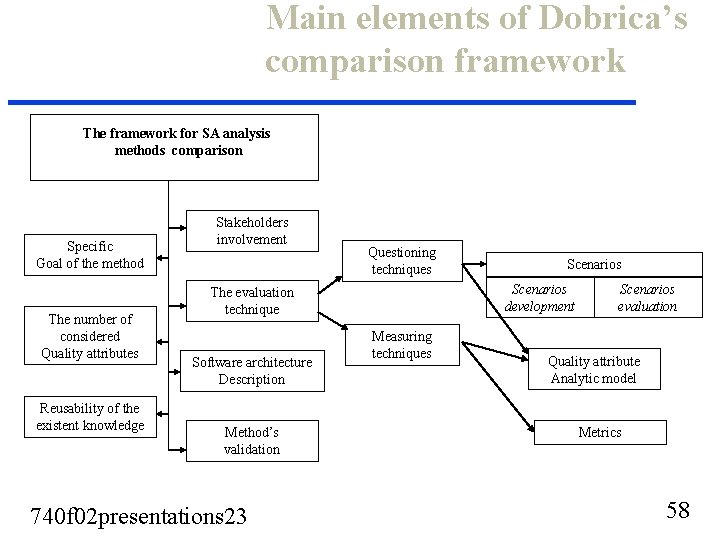
Main elements of Dobrica’s comparison framework The framework for SA analysis methods comparison Specific Goal of the method The number of considered Quality attributes Reusability of the existent knowledge Stakeholders involvement Questioning techniques Scenarios development The evaluation technique Software architecture Description Method’s validation 740 f 02 presentations 23 Scenarios Measuring techniques Scenarios evaluation Quality attribute Analytic model Metrics 58
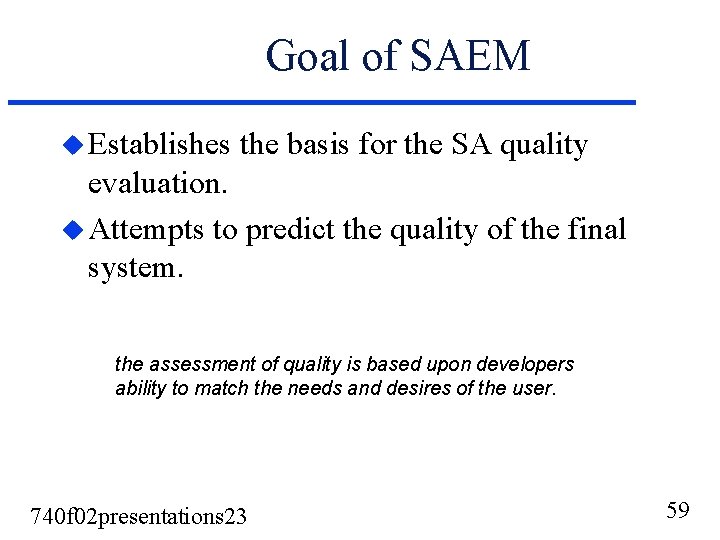
Goal of SAEM u Establishes the basis for the SA quality evaluation. u Attempts to predict the quality of the final system. the assessment of quality is based upon developers ability to match the needs and desires of the user. 740 f 02 presentations 23 59
Quality Model (SAEM) u The number of attributes can vary with the quality model selected and the attributes deemed important within that model 740 f 02 presentations 23 60
Existent Knowledge (SAEM) u Not Applied but assumed to exist in order to define the expected internal attributes and their target values. 740 f 02 presentations 23 61
Stakeholders Involvement (SAEM) u Experts’ knowledge and a company’s accumulated data are used in the mapping of quality requirements to internal attributes (user specified qualities mapped to the internal attributes that must satisfy the user quality requirements) u The development team specifies all the quality requirements 740 f 02 presentations 23 62
The Evaluation Technique (SAEM) u Measuring technique using intrinsic or defined metrics 740 f 02 presentations 23 63
SA Description (SAEM) u Considered from two viewpoints, the developer and the user u The SA is considered either an intermediate or final product in the software system process u The intrinsic properties can only be detected by measuring techniques applied to the SA representation formalized through an ADL (Architecture Description Language) 740 f 02 presentations 23 64
ADL( Architectural Description Language) • What is ADL Is a kind of language used to describe a software architecture ( An ADL may be a formal or semi-formal descriptive language, a graphics language, or include both) • Why use ADL * Lies in the ability to rigorously specify an architecture so that it can be analyzed * to improve software quality and correctness • How many different ADLs? * A lot * The link of different ADLs 740 f 02 presentations 23 65
SAEM’s Validation u SAEM has not been validated on any software system u Duenas’ paper on SAEM suggests the method was to be validated on a telecommunication package, but no results have ever been published. Nor have any other examples of the application of SAEM been published. 740 f 02 presentations 23 66
The Software Architecture Evaluation Model 740 f 02 presentations 23 67
Elements Required for SA Quality Evaluation • From ISO/IEC 14598 -1 –The quality model –The method for evaluation –The metrics –The supporting tools • SAEM implements this standard as a means of predicting quality of a product based on it’s SA. 740 f 02 presentations 23 68
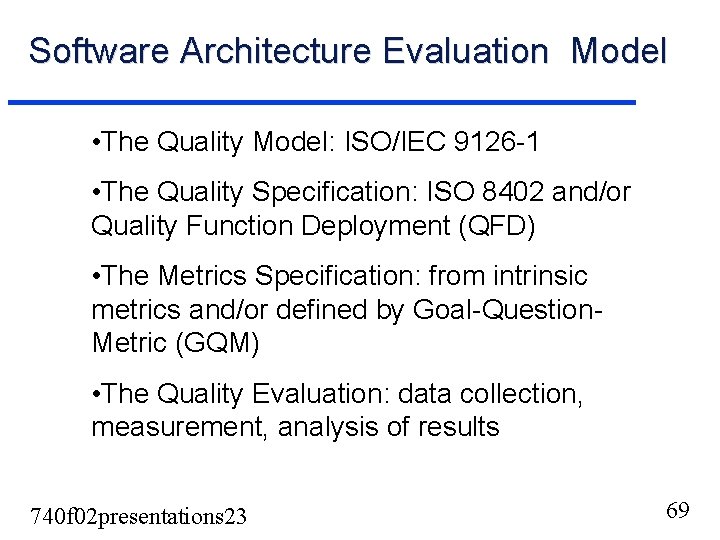
Software Architecture Evaluation Model • The Quality Model: ISO/IEC 9126 -1 • The Quality Specification: ISO 8402 and/or Quality Function Deployment (QFD) • The Metrics Specification: from intrinsic metrics and/or defined by Goal-Question. Metric (GQM) • The Quality Evaluation: data collection, measurement, analysis of results 740 f 02 presentations 23 69
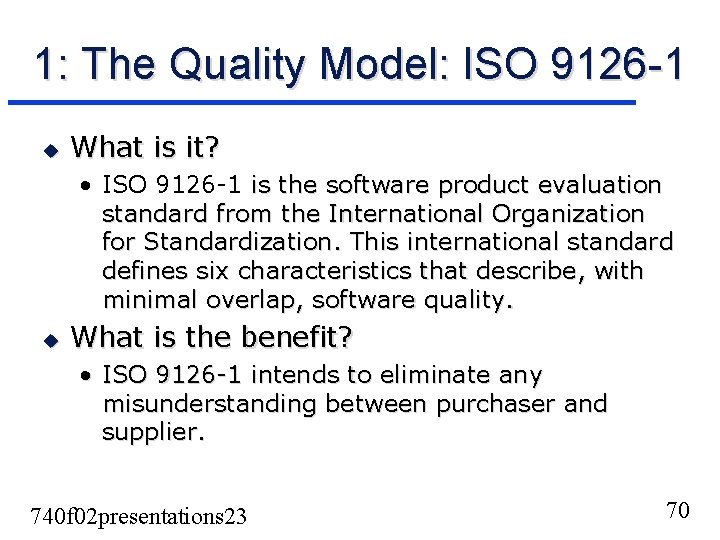
1: The Quality Model: ISO 9126 -1 u What is it? • ISO 9126 -1 is the software product evaluation standard from the International Organization for Standardization. This international standard defines six characteristics that describe, with minimal overlap, software quality. u What is the benefit? • ISO 9126 -1 intends to eliminate any misunderstanding between purchaser and supplier. 740 f 02 presentations 23 70
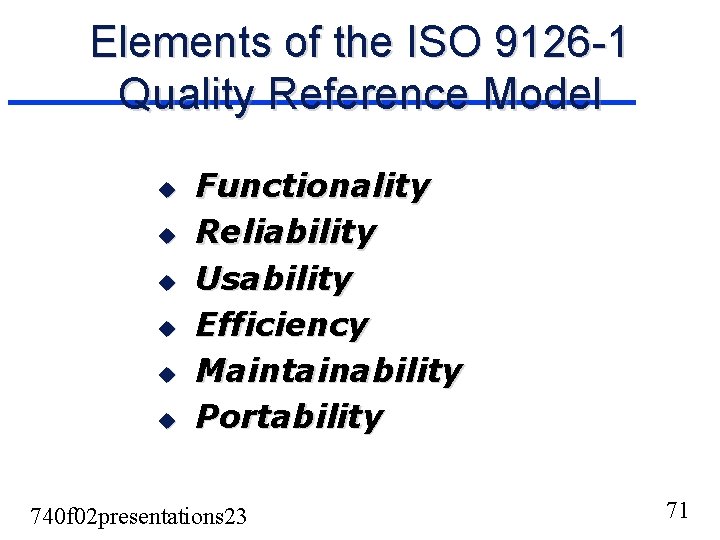
Elements of the ISO 9126 -1 Quality Reference Model u u u Functionality Reliability Usability Efficiency Maintainability Portability 740 f 02 presentations 23 71
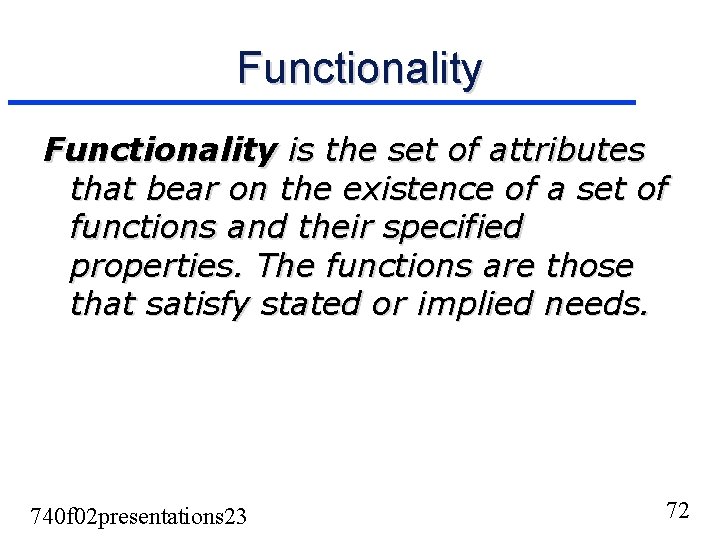
Functionality is the set of attributes that bear on the existence of a set of functions and their specified properties. The functions are those that satisfy stated or implied needs. 740 f 02 presentations 23 72
Reliablility Reliability is the set of attributes that bear on the capability of software to maintain its level of performance under stated conditions for a stated period of time. 740 f 02 presentations 23 73
Usability is the set of attributes that bear on the effort needed for use, and on the individual assessment of such use, by a stated or implied set of users. 740 f 02 presentations 23 74
Efficiency is the set of attributes that bear on the relationship between the level of performance of the software and the amount of resources used, under stated conditions. 740 f 02 presentations 23 75
Maintainability is the set of attributes that bear on the effort needed to make specified modifications. 740 f 02 presentations 23 76
Portability is the set of attributes that bear on the ability of software to be transferred from one environment. 740 f 02 presentations 23 77
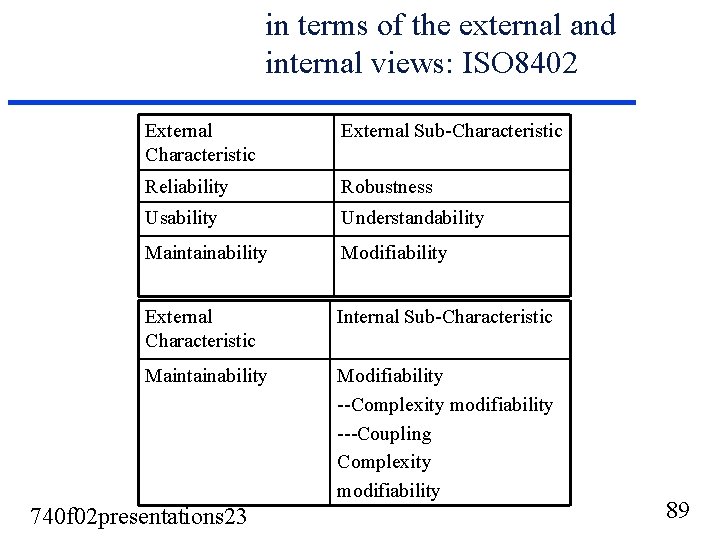
2: Quality Specification: ISO 8402 u The quality specification contains the totality of the characteristics bearing on the product’s ability to satisfy the stated and implied needs. u The user view is expressed in the external quality specification. u The developer is express in the internal quality specification. 740 f 02 presentations 23 78
Quality Specification: QFD Quality Function Deployment (QFD) is a structured approach to defining customer needs or requirements and translating them into specific plans to produce products to meet those needs. The "voice of the customer" is the term to describe these stated and unstated customer needs or requirements. The voice of the customer is captured in a variety of ways: direct discussion or interviews, surveys, focus groups, customer specifications, observation, warranty data, field reports, etc. This understanding of the customer needs is then summarized in a product planning matrix or "house of quality". These matrices are used to translate higher level "what's" or needs into lower level "how's" - product requirements or technical characteristics to satisfy these needs. 740 f 02 presentations 23 79
QFD ( Quality Function Deployment) What is QFD Is a systematic process for motivation a business to focus on its customers Why use QFD * to improve the communication of customer wants throughout the organization * to improve the completeness of specifications and to make them traceable directly to customer wants and needs What are the basic tools of QFD * Project Roadmaps, Documents, Lists and Matrices What are the approaches to QFD * Four-Phase approach: uses a QFD matrix to translate Customer wants into Product Characteristics * Matrix of Matrices: used to a address a wide variety of development issues * etc. 740 f 02 presentations 23 80
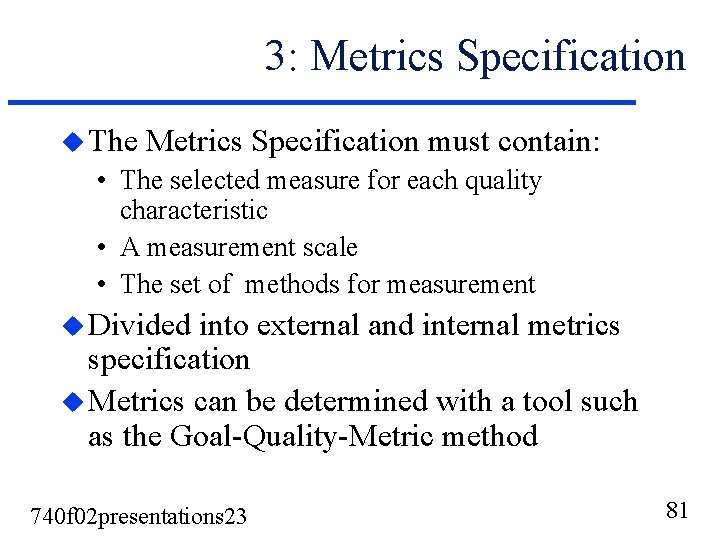
3: Metrics Specification u The Metrics Specification must contain: • The selected measure for each quality characteristic • A measurement scale • The set of methods for measurement u Divided into external and internal metrics specification u Metrics can be determined with a tool such as the Goal-Quality-Metric method 740 f 02 presentations 23 81
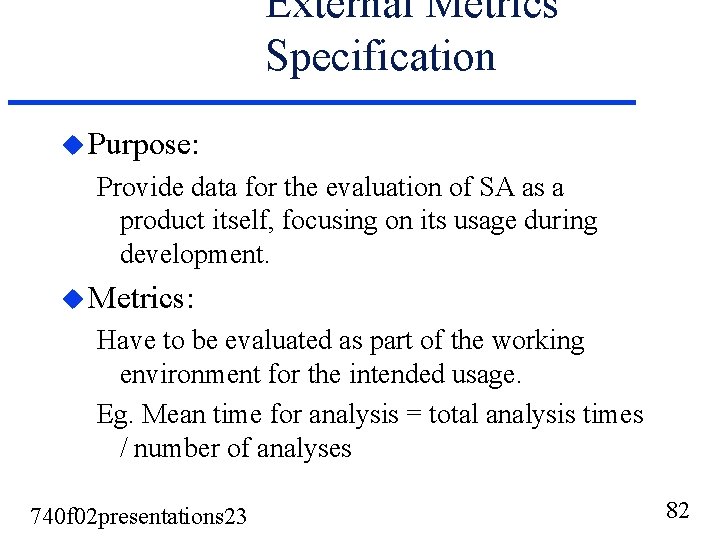
External Metrics Specification u Purpose: Provide data for the evaluation of SA as a product itself, focusing on its usage during development. u Metrics: Have to be evaluated as part of the working environment for the intended usage. Eg. Mean time for analysis = total analysis times / number of analyses 740 f 02 presentations 23 82
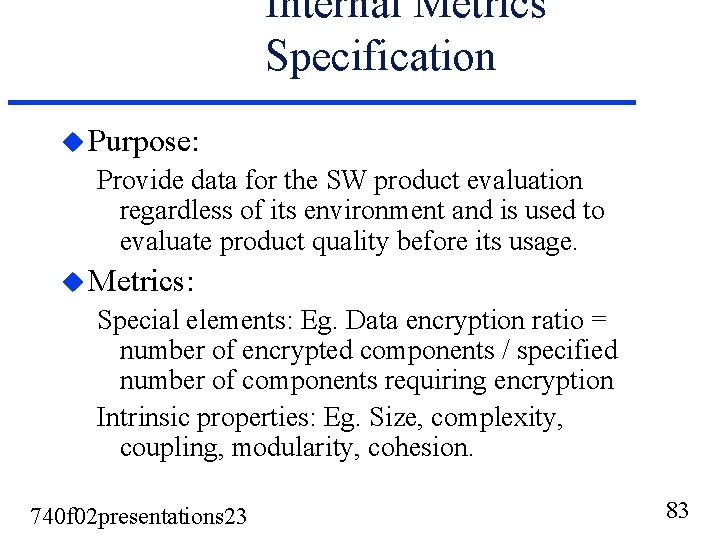
Internal Metrics Specification u Purpose: Provide data for the SW product evaluation regardless of its environment and is used to evaluate product quality before its usage. u Metrics: Special elements: Eg. Data encryption ratio = number of encrypted components / specified number of components requiring encryption Intrinsic properties: Eg. Size, complexity, coupling, modularity, cohesion. 740 f 02 presentations 23 83
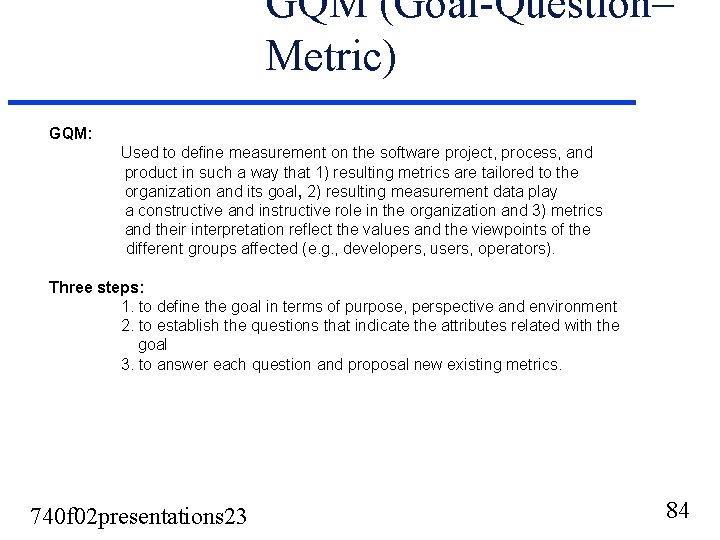
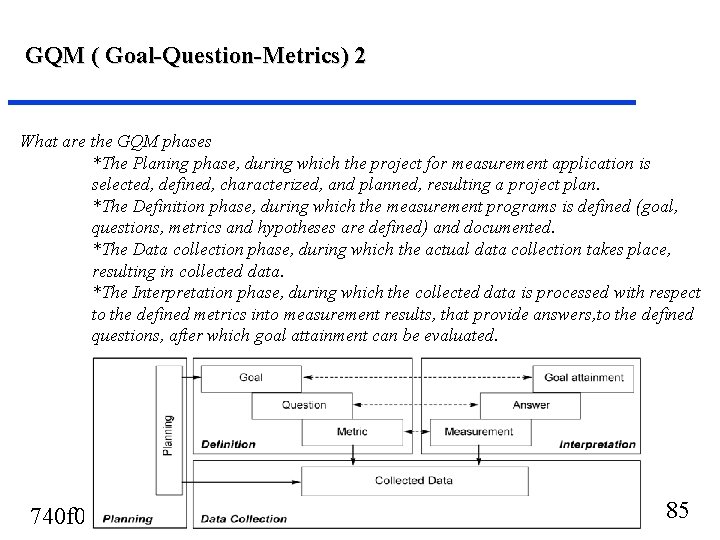
GQM (Goal-Question– Metric) GQM: Used to define measurement on the software project, process, and product in such a way that 1) resulting metrics are tailored to the organization and its goal, 2) resulting measurement data play a constructive and instructive role in the organization and 3) metrics and their interpretation reflect the values and the viewpoints of the different groups affected (e. g. , developers, users, operators). Three steps: 1. to define the goal in terms of purpose, perspective and environment 2. to establish the questions that indicate the attributes related with the goal 3. to answer each question and proposal new existing metrics. 740 f 02 presentations 23 84
GQM ( Goal-Question-Metrics) 2 What are the GQM phases *The Planing phase, during which the project for measurement application is selected, defined, characterized, and planned, resulting a project plan. *The Definition phase, during which the measurement programs is defined (goal, questions, metrics and hypotheses are defined) and documented. *The Data collection phase, during which the actual data collection takes place, resulting in collected data. *The Interpretation phase, during which the collected data is processed with respect to the defined metrics into measurement results, that provide answers, to the defined questions, after which goal attainment can be evaluated. 740 f 02 presentations 23 85
4: Quality Evaluation u Data collection, measurement, analysis of results u End result: the measurement result can be used as feedback for the improvement of the SA development process. 740 f 02 presentations 23 86
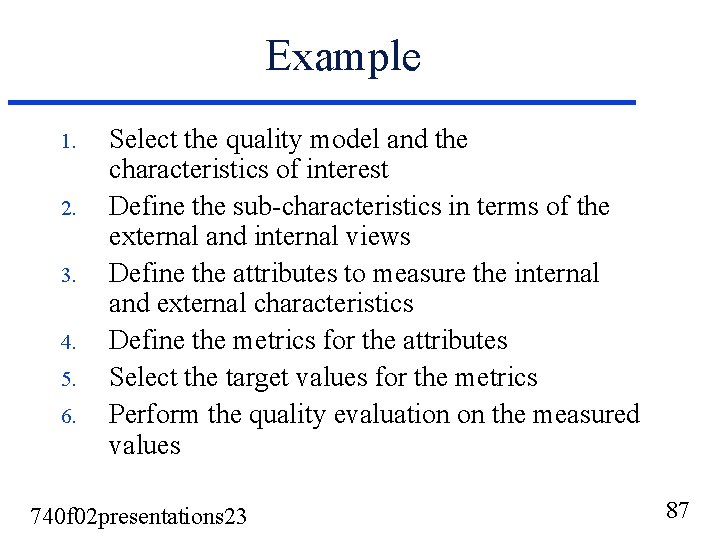
Example 1. 2. 3. 4. 5. 6. Select the quality model and the characteristics of interest Define the sub-characteristics in terms of the external and internal views Define the attributes to measure the internal and external characteristics Define the metrics for the attributes Select the target values for the metrics Perform the quality evaluation on the measured values 740 f 02 presentations 23 87
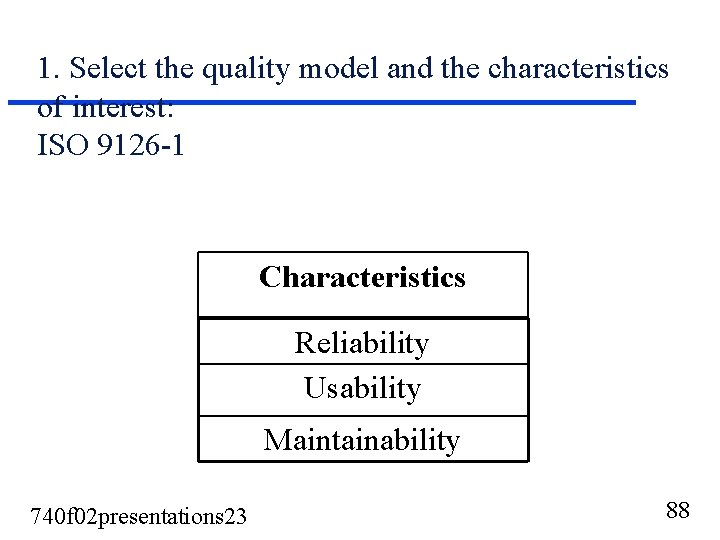
1. Select the quality model and the characteristics of interest: ISO 9126 -1 Characteristics Reliability Usability Maintainability 740 f 02 presentations 23 88
in terms of the external and internal views: ISO 8402 External Characteristic External Sub-Characteristic Reliability Robustness Usability Understandability Maintainability Modifiability External Characteristic Internal Sub-Characteristic Maintainability Modifiability --Complexity modifiability ---Coupling Complexity modifiability 740 f 02 presentations 23 89
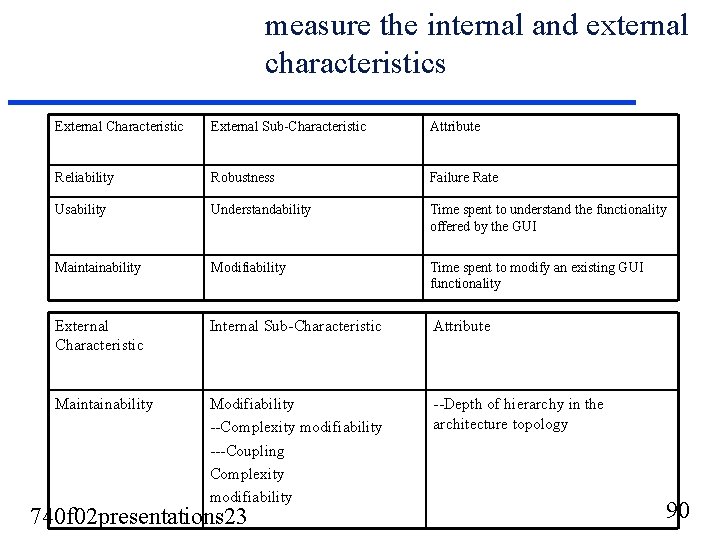
measure the internal and external characteristics External Characteristic External Sub-Characteristic Attribute Reliability Robustness Failure Rate Usability Understandability Time spent to understand the functionality offered by the GUI Maintainability Modifiability Time spent to modify an existing GUI functionality External Characteristic Internal Sub-Characteristic Attribute Maintainability Modifiability --Complexity modifiability ---Coupling Complexity modifiability --Depth of hierarchy in the architecture topology 740 f 02 presentations 23 90
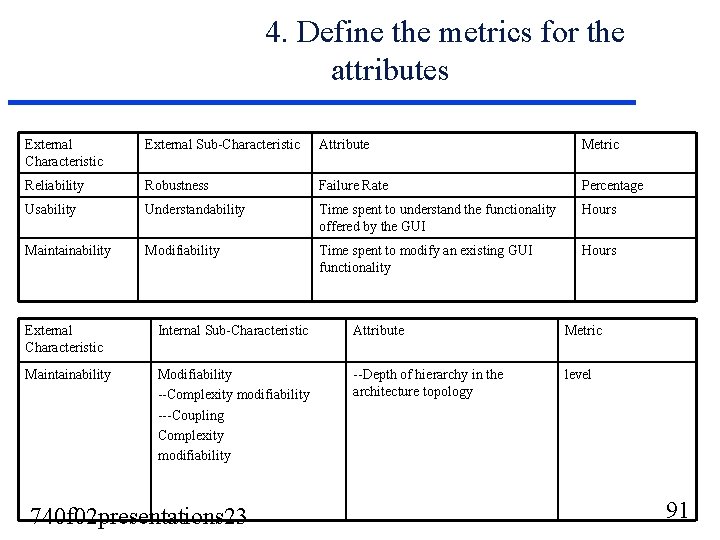
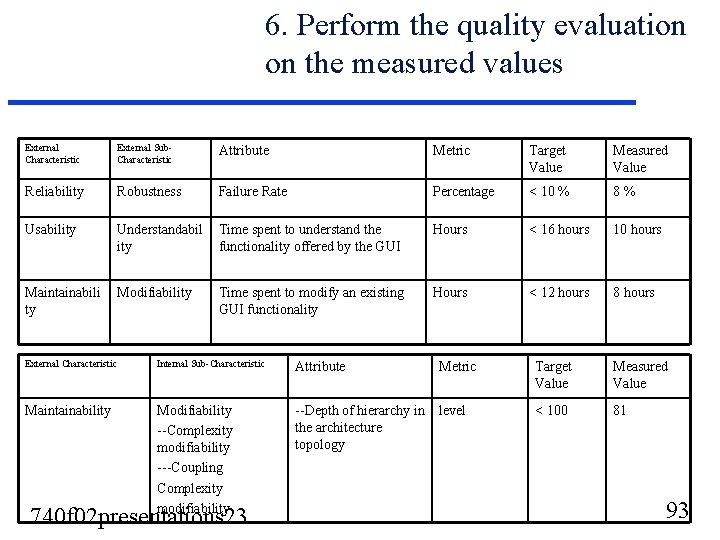
4. Define the metrics for the attributes External Characteristic External Sub-Characteristic Attribute Metric Reliability Robustness Failure Rate Percentage Usability Understandability Time spent to understand the functionality offered by the GUI Hours Maintainability Modifiability Time spent to modify an existing GUI functionality Hours External Characteristic Internal Sub-Characteristic Attribute Metric Maintainability Modifiability --Complexity modifiability ---Coupling Complexity modifiability --Depth of hierarchy in the architecture topology level 740 f 02 presentations 23 91
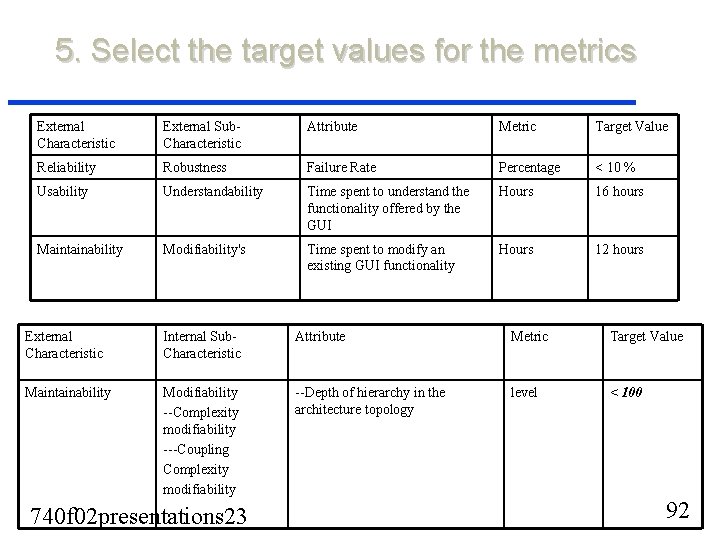
5. Select the target values for the metrics External Characteristic External Sub. Characteristic Attribute Metric Target Value Reliability Robustness Failure Rate Percentage < 10 % Usability Understandability Time spent to understand the functionality offered by the GUI Hours 16 hours Maintainability Modifiability's Time spent to modify an existing GUI functionality Hours 12 hours External Characteristic Internal Sub. Characteristic Attribute Metric Target Value Maintainability Modifiability --Complexity modifiability ---Coupling Complexity modifiability --Depth of hierarchy in the architecture topology level < 100 740 f 02 presentations 23 92
6. Perform the quality evaluation on the measured values External Characteristic External Sub. Characteristic Attribute Metric Target Value Measured Value Reliability Robustness Failure Rate Percentage < 10 % 8 % Usability Understandabil ity Time spent to understand the functionality offered by the GUI Hours < 16 hours 10 hours Maintainabili ty Modifiability Time spent to modify an existing GUI functionality Hours < 12 hours 8 hours External Characteristic Internal Sub-Characteristic Attribute Maintainability Modifiability --Complexity modifiability ---Coupling Complexity modifiability --Depth of hierarchy in level the architecture topology 740 f 02 presentations 23 Metric Target Value Measured Value < 100 81 93
Analysis of SAEM u Is SAEM useful? On paper, SAEM would appear useful in demonstrating a quantifiable level of SA quality. However, in practice, it’s never been used. 740 f 02 presentations 23 94
Analysis of SAEM u What’s good about SAEM? • It’s adaptable • Uses established standards and proven analysis tools such as ISO documents, QFD, GQM 740 f 02 presentations 23 95
Analysis of SAEM u What’s bad about SAEM? • SAEM has never been validated and therefore not used 740 f 02 presentations 23 96
In Conclusion SAEM does not establish optimal values for the measured quality attributes, but just formalizes a framework providing the means to measure these values and predict the quality of the final product from the SA evaluation. 740 f 02 presentations 23 97
REFERENCES • J. C. Duenas, W. L. de Oliceira, and J. A. de la Puente, “A Software Architecture Evaluation Model ”, Proc. Second Int’l ESPRIT ARES Workshop. Pp. 148 -157, Feb. 1998 • http: //www. isaca. org. za/Iso 9126. htm • http: //www 3. sqi. gu. edu. au/~dannyp/SQM/lectures/lw 2 a. pdf • http: //www. qfdi. org/ • http: //ivs. cs. uni-magdeburg. de/sw-eng/us/java/GQM/link 4. shtmlvv • http: //www. npd-solutions. com/qfdsteps. html 740 f 02 presentations 23 98