2017 Star Ratings and a Review of the


")


 Quality Based Network")
 - Launched in October 2013 based")
 EQu. IPP § § Performance Strategy Patient-level opportunities (outliers) Important")


 Details and Differences • Most performance scores are")


- Slides: 36
2017 Star Ratings and a Review of the EQu. IPP Dashboard PBA Health/Tri. Net Update Zac Renfro, Pharm. D Pharmacy Quality Consultant October 25, 2016 _____________________ Managing Performance Information In A Quality-Driven World
Topics § § Updates to the CMS Star Ratings EQu. IPP Review Enhancements to EQu. IPP over the past several months Q&A / Discussion www. pharmacyquality. com
The Shift to Value-Driven Healthcare Fee-For-Service Value. Based Healthcare Quantity Driven Quality Driven “Value” is the balance of quality and costs. Value can be optimized by improving quality while reducing costs www. pharmacyquality. com
The Shift to Value-Driven Healthcare http: //www. forbes. com/sites/brucejapsen/2015/01/26/medicares-bolt-from-fee-for-service-means-50 -percent-value-based-pay-by-2018/#30 c 323 d 976 eb www. pharmacyquality. com 4
The Shift to Value-Driven Healthcare § In January 2015, the Department of HHS announced ambitious goals for shifting Medicare providers to value-based payment § Goal 1: by 2016, 30% of Medicare payments are tied to quality or value through Alternative Payment Models (APM); by 2018, this increases to 50% § Goal 2: by 2016, 85% of Medicare FFS payments are tied to quality or value via a Merit-based Incentive Payment System (MIPS); by 2018, this increases to 90% § APMs include Accountable Care Organizations (ACOs) and Patient-Centered Medical Homes Source: https: //www. cms. gov/Medicare/Quality-Initiatives-Patient-Assessment-Instruments/Value. Based-Programs/MACRA-MIPS-and-APMs. html www. pharmacyquality. com
Medicare 5 -Star Ratings § Annual ratings of Medicare plans that are made available on Medicare Plan Finder and CMS website § Ratings are displayed as 1 - to 5 -stars § Stars are calculated for each measure, as well as each domain, summary, and overall (applies to MA-PDs) level § Two-year lag between “year of service” and reporting year for Star Ratings (e. g. , 2014 drug claims are used for 2016 Star Ratings) § 2017 Star Ratings were released in late-September 2016 to inform beneficiaries who were enrolling for 2017 (“open enrollment”) www. pharmacyquality. com
Medicare Plan Ratings – Part D § Medicare drug plans receive a summary rating § Five measures are from PQA & are related to medication use: § 1 measure of medication safety § High risk medications in the elderly § 3 measures of medication adherence § Calculated using Proportion of Days Covered or “PDC” § Non-insulin diabetes medications (including biguanides, sulfonylureas, DPP-IV inhibitors, TZDs, incretin mimetics, meglitinides, and SGLT 2 Inhibitors) § Cholesterol medication (statins) § Blood pressure (renin-angiotensin system antagonists including ACE inhibitors, ARBs, and direct renin inhibitors) Due to the triple weighting of these clinically-relevant measures, they account for nearly 43% of Part D summary rating in 2017 www. pharmacyquality. com
Newest Star Ratings Measure Medication Therapy Management Program Completion Rate for Comprehensive Medication Reviews (CMRs) Highlights: § Measures the percentage of beneficiaries who met eligibility criteria for the MTM program and who received a CMR with a written summary in the CMS standardized format. § Included in 2016 Star Ratings § 2017 Star Rating based on the 2015 calendar year § This measure will be assigned a weight of “ 1” § For complete measure details, please see the PQA measure listing on the website http: //pqaalliance. org/measures/default. asp www. pharmacyquality. com
CMR Completion Rate 2017 Star Thresholds 2016 National Averages MAPD: 45. 6% 2. 4 stars PDP: 25. 3% 2. 8 stars www. pharmacyquality. com 9
Medicare Part D: Display Measures § Display measures are not a part of the Star Ratings, but are used to provide benchmarks and feedback to plans § CMS also monitors display measures to assess plan performance; poor performance can lead to compliance actions by CMS § Display measures (from PQA): − Drug-Drug Interactions − Excessive doses of oral diabetes medications − HIV antiretroviral medication adherence (only in safety reports) − Statin Use in Persons with Diabetes (new display measure for 2017) § Display measure (NOT from PQA) − Use of atypical antipsychotics www. pharmacyquality. com
Other Performance Measures for 2017 Health Plan/PBM Dependent § Adherence § § § § Behavioral Health Breast Cancer Coronary Artery Disease Congestive Heart Failure Depression Non-RASA Hypertension Osteoporosis Respiratory www. pharmacyquality. com § Asthma § Absence of controller therapy § Suboptimal control § Dispensing type § 90 day fill rate § Generic Dispensing Rate
2015/2016 Star Thresholds MAPD 2016/2017 4 Star 5 Star HRM 8% / 5% 6% / 3% PDC Cholesterol 73% / 77% 79% / 82% PDC Diabetes 75% / 79% 82% / 83% PDC Hypertension 77% / 79% 81% / 83% PDP 2016/2017 4 Star 5 Star HRM 10% / 8% 6% / 6% PDC Cholesterol 78% / 80% 83% / 84% PDC Diabetes 83% / 82% 95% / 86% PDC Hypertension 82% / 83% 85% / 85% www. pharmacyquality. com
How Does This Affect Health Plans? § Enrollment Implications § Quality Bonus Payments (MA-PD) § High performers identified on CMS website § Poor performers identified on CMS website § Removal from Medicare for continued poor overall performance (< 3 stars for 3 years in a row) www. pharmacyquality. com
How Does This Affect Pharmacies? Preferred network Implications Potential reimbursement implications Pay-for-Performance (P 4 P) bonus payment programs Quality-Based Networks (QBNs) www. pharmacyquality. com
How are Health Plans Responding? Significant investments in “Drive to 5” As the pressure builds on Medicare plans to improve Star Ratings, they are looking to community pharmacy to help improve quality and value for their members. § Overall strategies: § Formulary type & management § New clinical strategies (PA on High Risk Meds) § More telephonic outreach to members and more targeted MTM activities § Network contracts § P 4 P, QBN, VBN § Marketing/promotions § Are all aligning with star measures www. pharmacyquality. com
How are Health Plans Responding? Pay for Performance (P 4 P) Quality Based Network (QBN) • Indicates that reimbursement, compensation, or bonus incentives are tied to reaching defined goals • Many involve an incentive payment for achieving a certain level of performance and/or improvement on medication-related quality measures (e. g. medication adherence scores) during a defined time period (6 or 12 months) • Health plan/PBM may use to denote that performance on medication-related quality measures or other pharmacy-related measures are key aspects to participating network pharmacies www. pharmacyquality. com Value-Based Contracting • Involves alternative payment methodologies where accountability to provide value such as quality performance or cost-efficiency is a key component
Pharmacy Pay-for-Performance Programs Inland Empire Health Plan (IEHP) - Launched in October 2013 based on Star measures plus asthma and GDR Achieved significant improvement in performance and has extended program Pharmacies receive bonus depending on their performance: o o 3 -star attainment = small bonus 5 -star attainment = large bonus Healthfirst of NY - Program launched October 2014 based on PDC-adherence measures Combination of payment for program commitment and for reaching performance goals as measured by EQu. IPP Caremark-Silver. Script - Ongoing program based on PDC-adherence and other quality measures Started with combination of payment for gap closures delivered through Mirixa and bonus on reaching performance goals as measured by EQu. IPP Quality scores may affects DIR adjustment for reimbursement Humana - Pilot program launched in late 2015 in Texas and Florida with limited group of chain and independent pharmacies www. pharmacyquality. com 17
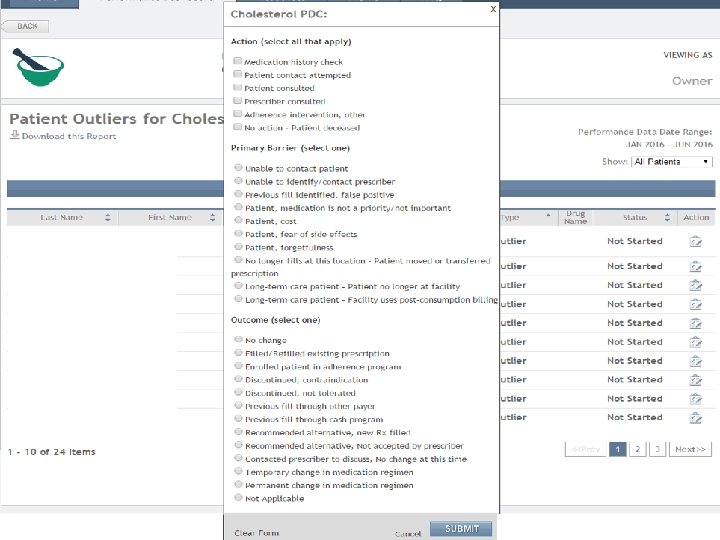
Pharmacy Quality Solutions (PQS) EQu. IPP § § Performance Strategy Patient-level opportunities (outliers) Important information and resources on the quality measures § Acts as the neutral intermediary between Pharmacy Organizations and Health Plans/PBM’s with a goal of strengthening relationships § Access to performance dashboards that display performance and relevant benchmarks on Star Ratings metrics across lines of business and across geographic regions for health plans and pharmacies www. pharmacyquality. com
What is EQu. IPP ? § EQu. IPP is a multi-plan, multi-pharmacy, collaborative to: § Support collaboration of health plans, PBMs and pharmacies for Quality Improvement related to medication use § Allow consistent, standardized assessment of community pharmacy performance on Part D stars and other quality measures § Enable faster, more-refined, benchmarking of Part D stars performance in key market areas § EQu. IPP provides a neutral assessment of quality for trusted performance assessment and benchmarking by all parties. § EQu. IPP lays the foundation for performance-based contracts and payment systems for pharmacy networks www. pharmacyquality. com
Each tab on the home page provides varied information Support link on every page of EQu. IPP Enter Username & Password to access information specific to your pharmacy www. pharmacyquality. com
Individual Pharmacy View
New Feature: Year to Date (YTD) Details and Differences • Most performance scores are further from the stated goals when looking at YTD vs 6 -Month rolling averages • Patients can drop out of the 6 -month rolling data and still be in the YTD data for calculations. • Starting mid year 2016 a YTD view is available that reflects 2016 performance o Track both 6 month trends and YTD standing • Review contracts to understand how a plan or PBM is looking at performance metrics o 6 month vs YTD makes a difference www. pharmacyquality. com 22
Individual Pharmacy View
www. pharmacyquality. com
www. pharmacyquality. com
www. pharmacyquality. com
Individual Pharmacy View
www. pharmacyquality. com
www. pharmacyquality. com
www. pharmacyquality. com
www. pharmacyquality. com
www. pharmacyquality. com
Summary § A growing number of prescription drug plans are implementing performance-based incentives § Pay-for-performance models that include bonus payments to top-performing pharmacies § Preferred networks that include star-performance as a criterion for inclusion as a preferred pharmacy § EQu. IPP continues to expand the number of plans and pharmacies who use this platform as a “neutral intermediary” for calculation of pharmacy quality scores § Pharmacies need to track their quality to compete in a value-based contracting environment and will need clinical decision support tools that prompt efficient, effective action www. pharmacyquality. com
Remember § Pharmacies do not get a STAR rating, Health Plans do § EQu. IPP is normally refreshed with new plan data the 15 th of each month § You will only have “outliers” if your pharmacy has patients that fall under the health plans that have chosen to display this level of detail § Refer to the Resources Tab on EQu. IPP for quality improvement tools and resources available § Know your numbers and where your pharmacy stands in terms of quality measures www. pharmacyquality. com
zrenfro@pharmacyquality. com www. EQu. IPP. org www. pharmacyquality. com 36