2012 Crop Market Outlook Coleman Research Group Presentation
- Slides: 36
2012 Crop Market Outlook Coleman Research Group Presentation Jan. 20, 2012 Chad Hart Assistant Professor/Grain Markets Specialist chart@iastate. edu 515 -294 -9911 Extension and Outreach/Department of Economics
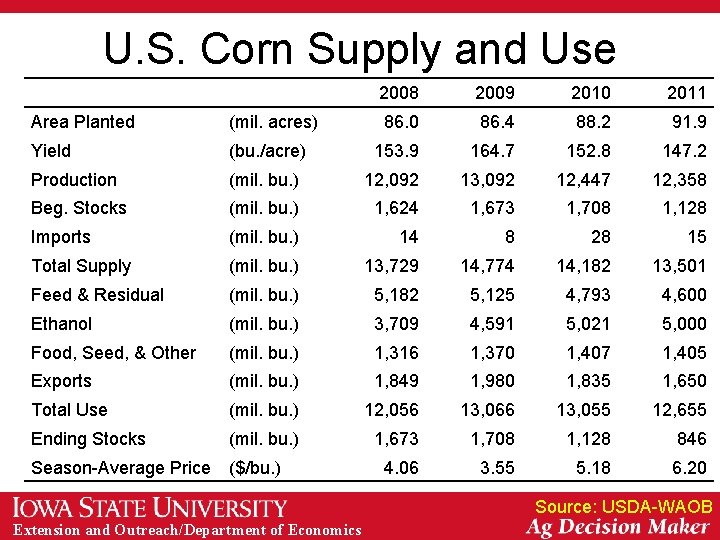
U. S. Corn Supply and Use 2008 2009 2010 2011 86. 0 86. 4 88. 2 91. 9 Area Planted (mil. acres) Yield (bu. /acre) 153. 9 164. 7 152. 8 147. 2 Production (mil. bu. ) 12, 092 13, 092 12, 447 12, 358 Beg. Stocks (mil. bu. ) 1, 624 1, 673 1, 708 1, 128 Imports (mil. bu. ) 14 8 28 15 Total Supply (mil. bu. ) 13, 729 14, 774 14, 182 13, 501 Feed & Residual (mil. bu. ) 5, 182 5, 125 4, 793 4, 600 Ethanol (mil. bu. ) 3, 709 4, 591 5, 021 5, 000 Food, Seed, & Other (mil. bu. ) 1, 316 1, 370 1, 407 1, 405 Exports (mil. bu. ) 1, 849 1, 980 1, 835 1, 650 Total Use (mil. bu. ) 12, 056 13, 066 13, 055 12, 655 Ending Stocks (mil. bu. ) 1, 673 1, 708 1, 128 846 4. 06 3. 55 5. 18 6. 20 Season-Average Price ($/bu. ) Source: USDA-WAOB Extension and Outreach/Department of Economics
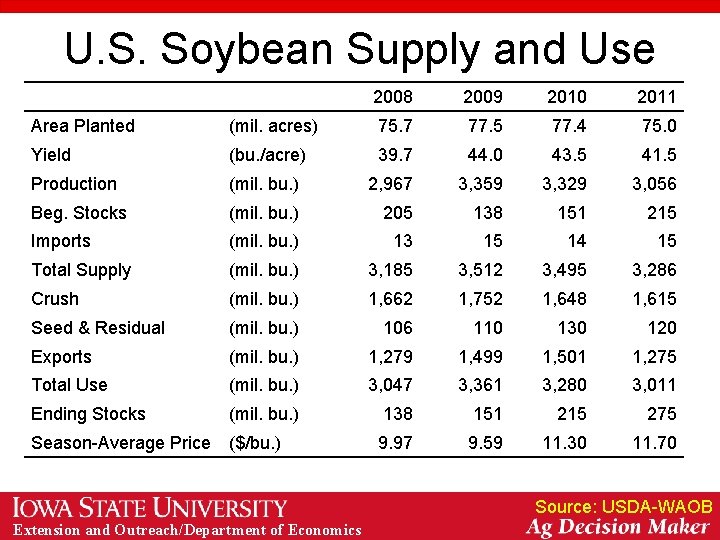
U. S. Soybean Supply and Use 2008 2009 2010 2011 Area Planted (mil. acres) 75. 7 77. 5 77. 4 75. 0 Yield (bu. /acre) 39. 7 44. 0 43. 5 41. 5 Production (mil. bu. ) 2, 967 3, 359 3, 329 3, 056 Beg. Stocks (mil. bu. ) 205 138 151 215 Imports (mil. bu. ) 13 15 14 15 Total Supply (mil. bu. ) 3, 185 3, 512 3, 495 3, 286 Crush (mil. bu. ) 1, 662 1, 752 1, 648 1, 615 Seed & Residual (mil. bu. ) 106 110 130 120 Exports (mil. bu. ) 1, 279 1, 499 1, 501 1, 275 Total Use (mil. bu. ) 3, 047 3, 361 3, 280 3, 011 Ending Stocks (mil. bu. ) 138 151 215 275 9. 97 9. 59 11. 30 11. 70 Season-Average Price ($/bu. ) Source: USDA-WAOB Extension and Outreach/Department of Economics
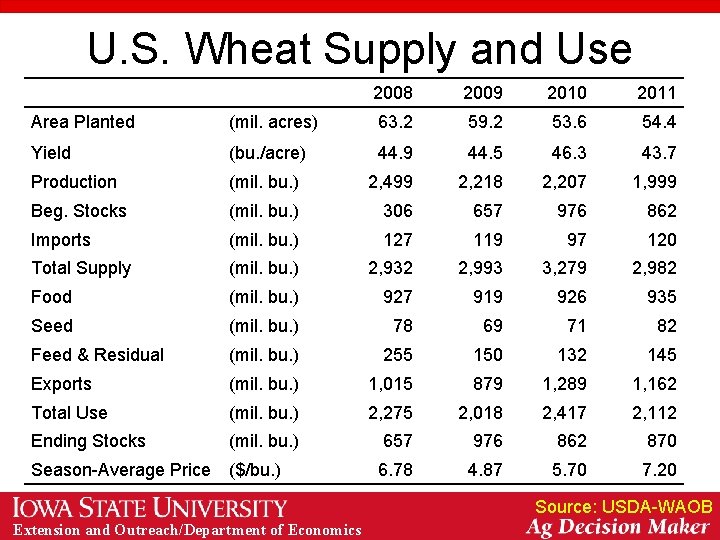
U. S. Wheat Supply and Use 2008 2009 2010 2011 Area Planted (mil. acres) 63. 2 59. 2 53. 6 54. 4 Yield (bu. /acre) 44. 9 44. 5 46. 3 43. 7 Production (mil. bu. ) 2, 499 2, 218 2, 207 1, 999 Beg. Stocks (mil. bu. ) 306 657 976 862 Imports (mil. bu. ) 127 119 97 120 Total Supply (mil. bu. ) 2, 932 2, 993 3, 279 2, 982 Food (mil. bu. ) 927 919 926 935 Seed (mil. bu. ) 78 69 71 82 Feed & Residual (mil. bu. ) 255 150 132 145 Exports (mil. bu. ) 1, 015 879 1, 289 1, 162 Total Use (mil. bu. ) 2, 275 2, 018 2, 417 2, 112 Ending Stocks (mil. bu. ) 657 976 862 870 6. 78 4. 87 5. 70 7. 20 Season-Average Price ($/bu. ) Source: USDA-WAOB Extension and Outreach/Department of Economics
2011 Corn Yields Source: USDA-NASS Extension and Outreach/Department of Economics
2011 Soybean Yields Source: USDA-NASS Extension and Outreach/Department of Economics
Winter Wheat Production Source: USDA-NASS Extension and Outreach/Department of Economics
Durum Wheat Production Source: USDA-NASS Extension and Outreach/Department of Economics
Other Spring Wheat Production Source: USDA-NASS Extension and Outreach/Department of Economics
World Corn Production Source: USDA-WAOB Extension and Outreach/Department of Economics
World Soybean Production Source: USDA-WAOB Extension and Outreach/Department of Economics
World Wheat Production Source: USDA-WAOB Extension and Outreach/Department of Economics
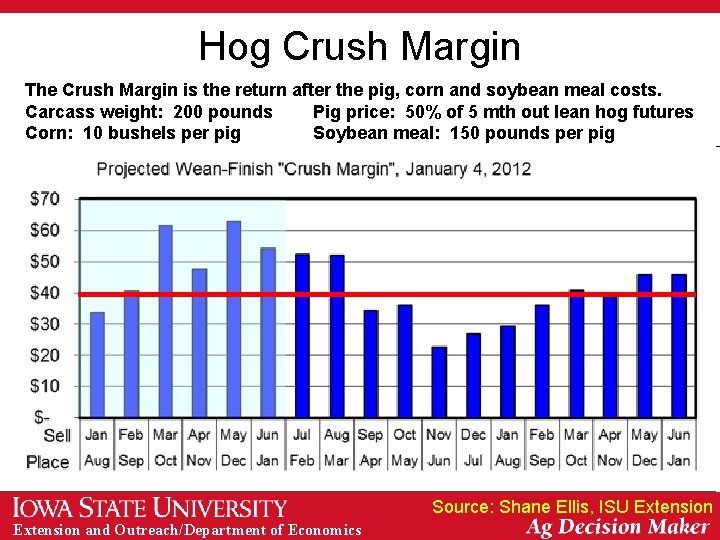
Hog Crush Margin The Crush Margin is the return after the pig, corn and soybean meal costs. Carcass weight: 200 pounds Pig price: 50% of 5 mth out lean hog futures Corn: 10 bushels per pig Soybean meal: 150 pounds per pig Source: Shane Ellis, ISU Extension and Outreach/Department of Economics
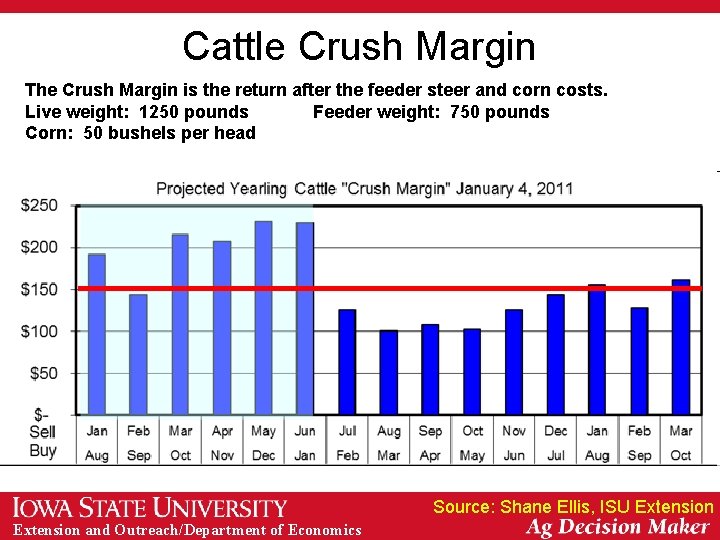
Cattle Crush Margin The Crush Margin is the return after the feeder steer and corn costs. Live weight: 1250 pounds Feeder weight: 750 pounds Corn: 50 bushels per head Source: Shane Ellis, ISU Extension and Outreach/Department of Economics
Corn vs. Wheat Source: CME Group, 1/17/2012 Extension and Outreach/Department of Economics
Corn Export Sales Source: USDA, FAS Extension and Outreach/Department of Economics
Corn Export Shifts Source: USDA, FAS Extension and Outreach/Department of Economics
Soybean Export Sales Source: USDA, FAS Extension and Outreach/Department of Economics
Soybean Export Shifts Source: USDA, FAS Extension and Outreach/Department of Economics
Wheat Export Sales Source: USDA, FAS Extension and Outreach/Department of Economics
Wheat Export Shifts Source: USDA, FAS Extension and Outreach/Department of Economics
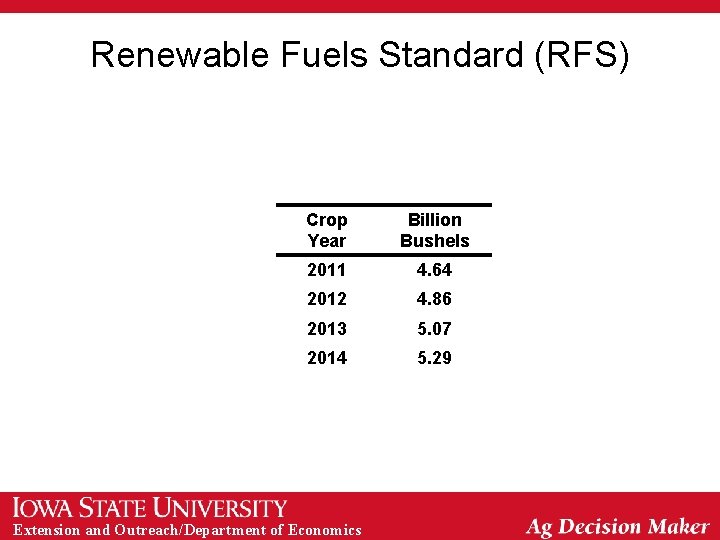
Renewable Fuels Standard (RFS) Crop Year Billion Bushels 2011 4. 64 2012 4. 86 2013 5. 07 2014 5. 29 Extension and Outreach/Department of Economics
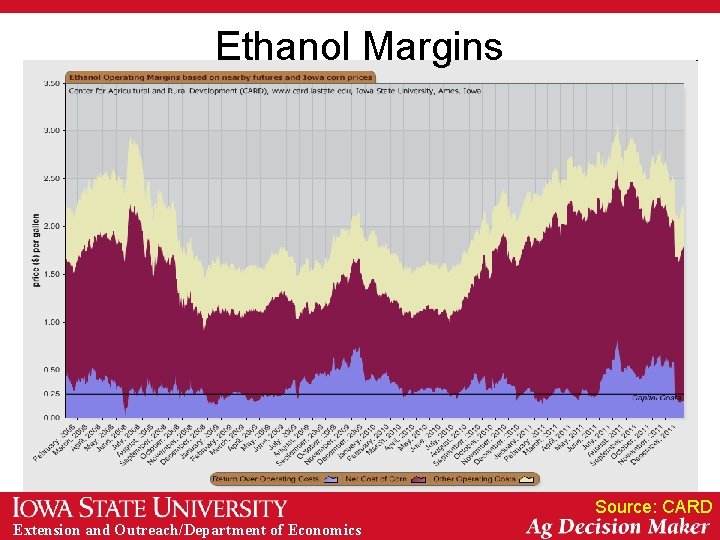
Ethanol Margins Source: CARD Extension and Outreach/Department of Economics
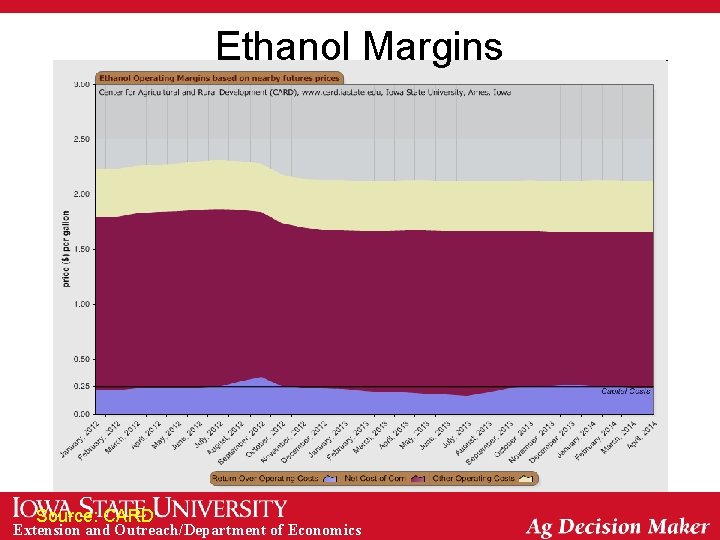
Ethanol Margins Source: CARD Extension and Outreach/Department of Economics
Ethanol Blending Advantage Extension and Outreach/Department of Economics
Corn Grind for Ethanol Source: DOE-EIA Extension and Outreach/Department of Economics
Ethanol Stocks Source: DOE, EIA Extension and Outreach/Department of Economics
Nearby Futures (Jan. 3, 2011 = 1) Extension and Outreach/Department of Economics
Projected 2011 Season-Average Corn Price Extension and Outreach/Department of Economics
Projected 2011 Season-Average Soy Price Extension and Outreach/Department of Economics
Projected ‘ 11 Season-Average Wheat Price Extension and Outreach/Department of Economics
Principal Crop Area Source: USDA-NASS Extension and Outreach/Department of Economics
2012 Winter Wheat Plantings Source: USDA-NASS Extension and Outreach/Department of Economics
Extension and Outreach/Department of Economics
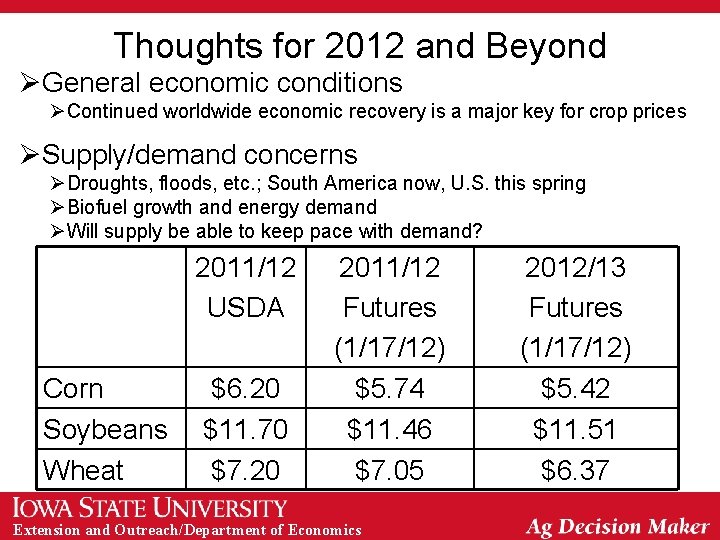
Thoughts for 2012 and Beyond ØGeneral economic conditions ØContinued worldwide economic recovery is a major key for crop prices ØSupply/demand concerns ØDroughts, floods, etc. ; South America now, U. S. this spring ØBiofuel growth and energy demand ØWill supply be able to keep pace with demand? 2011/12 USDA Corn Soybeans Wheat $6. 20 $11. 70 $7. 20 2011/12 Futures (1/17/12) $5. 74 $11. 46 $7. 05 Extension and Outreach/Department of Economics 2012/13 Futures (1/17/12) $5. 42 $11. 51 $6. 37
Thank you for your time! Any questions? My web site: http: //www. econ. iastate. edu/~chart/ Iowa Farm Outlook: http: //www. econ. iastate. edu/ifo/ Ag Decision Maker: http: //www. extension. iastate. edu/agdm/ Extension and Outreach/Department of Economics