1 The law of demand states that A


: A. downward shift")


: A. decrease in the price")


: A. downward shift")


: A. decrease in the price")


- Slides: 27
#1 • The law of demand states that: A. as the price of a good increases, more units are demanded. B. there is a direct relationship between the price of a good and the quantity of the good produced. C. there is a negative relationship between the price of a good and the quantity of the good demanded. D. there is an increase in the need for a good as the price of the good increases.
#2 • A decrease in quantity demanded is given by a(n): A. downward shift of the demand curve. B. upward shift of the demand curve. C. downward movement to the right along the demand curve. D. upward movement to the left along the demand curve. E. downward shift of both demand supply curves
#3 • At a price of $5, Sam buys 10 units of a product; when the price increases to $6, Sam buys 8 units. Martha says Sam’s demand has decreased. Is Martha correct? A. Yes, Martha is correct. Sam’s demand has decreased. B. No, Martha is incorrect. Sam’s demand has increased. C. No, Martha is incorrect. Sam’s quantity demanded has decreased, and his demand has not changed. D. No, Martha is incorrect. Sam’s quantity demanded has increased, and his demand has increased. E. No, Martha is incorrect. Sam’s demand has increased, and his quantity demanded has decreased.
#4 • Which of the following best represents the effects of a decrease in the price of tomato juice, other things being equal? A. An upward movement along the demand curve for tomato juice. B. A downward movement along the demand curve for tomato juice. C. A rightward shift in the demand curve for tomato juice. D. A leftward shift in the demand curve for tomato juice.
#5 • In the graph, the shift in the line from D 1 to D 2 could have been caused by which of the following? – Decrease in price. – Decrease in expected future prices. – Increase in the price of a substitute. – Increase in the price of a complement. – Decrease in income if it is a normal good.
#6 • In Exhibit 2, which of the following could not have caused the shift in the line from D 1 to D 2? – – – Decrease in the number of consumers. Increase in expected future prices. Increase in the price of a substitute. Decrease in the price of a complement. Increase in income.
#7 • A. B. C. D. E. Which of the following pairs of goods would be considered substitutes? Milk and cookies. Tires and automobiles. Ink and pens. Coca-Cola and Pepsi. Computers and computer software.
#8 If two goods are substitutes in consumption, a(n): A. decrease in the price of one product will cause an increase in the demand for the other product. B. decrease in the price of one product will cause a decrease in the demand for the other product. C. increase in the price of one product will cause an increase in the supply of the other product. D. increase in the price of one product will cause a decrease in the supply of the other product. E. increase in the price of one product will cause a decrease in the demand for the other product.
#9 Which of the following must be true if good X is a normal good and income increases? A. The demand for X will increase, and thus the price and quantity sold and bought will decrease. B. The demand for X will decrease, and thus the price and quantity sold and bought will decrease. C. The demand for X will increase, and thus the price and quantity sold and bought will increase. D. The demand for X will decrease, and thus the price and quantity sold and bought will increase. E. The demand for X will increase, and thus the price and quantity sold and bought will remain the same.
#10 • A. B. C. D. E. Tasha decides that when homes in her neighborhood are selling for $150, 000 she will not sell her home. When average prices rise to $175, 000, she decides that she will put her home on the market. This is an example of: market demand. market-day supply. an excess supply of homes. a positively-sloped supply curve. a negatively-sloped supply curve.
#1 • The law of demand states that: A. as the price of a good increases, more units are demanded. B. there is a direct relationship between the price of a good and the quantity of the good produced. C. there is a negative relationship between the price of a good and the quantity of the good demanded. D. there is an increase in the need for a good as the price of the good increases.
#2 • A decrease in quantity demanded is given by a(n): A. downward shift of the demand curve. B. upward shift of the demand curve. C. downward movement to the right along the demand curve. D. upward movement to the left along the demand curve. E. downward shift of both demand supply curves
#3 • At a price of $5, Sam buys 10 units of a product; when the price increases to $6, Sam buys 8 units. Martha says Sam’s demand has decreased. Is Martha correct? A. B. Yes, Martha is correct. Sam’s demand has decreased. No, Martha is incorrect. Sam’s demand has increased. C. No, Martha is incorrect. Sam’s quantity demanded has decreased, and his demand has not changed. D. No, Martha is incorrect. Sam’s quantity demanded has increased, and his demand has increased. E. No, Martha is incorrect. Sam’s demand has increased, and his quantity demanded has decreased.
#4 • Which of the following best represents the effects of a decrease in the price of tomato juice, other things being equal? A. An upward movement along the demand curve for tomato juice. B. A downward movement along the demand curve for tomato juice. C. A rightward shift in the demand curve for tomato juice. D. A leftward shift in the demand curve for tomato juice.
#5 • In the graph, the shift in the line from D 1 to D 2 could have been caused by which of the following? A. B. C. D. E. Decrease in price. Decrease in expected future prices. Increase in the price of a substitute. Increase in the price of a complement. Decrease in income if it is a normal good.
#6 • In Exhibit 2, which of the following could not have caused the shift in the line from D 1 to D 2? A. B. C. D. E. Decrease in the number of consumers. Increase in expected future prices. Increase in the price of a substitute. Decrease in the price of a complement. Increase in income.
#7 • A. B. C. D. E. Which of the following pairs of goods would be considered substitutes? Milk and cookies. Tires and automobiles. Ink and pens. Coca-Cola and Pepsi. Computers and computer software.
#8 If two goods are substitutes in consumption, a(n): A. decrease in the price of one product will cause an increase in the demand for the other product. B. decrease in the price of one product will cause a decrease in the demand for the other product. C. increase in the price of one product will cause an increase in the supply of the other product. D. increase in the price of one product will cause a decrease in the supply of the other product. E. increase in the price of one product will cause a decrease in the demand for the other product.
#9 Which of the following must be true if good X is a normal good and income increases? A. The demand for X will increase, and thus the price and quantity sold and bought will decrease. B. The demand for X will decrease, and thus the price and quantity sold and bought will decrease. C. The demand for X will increase, and thus the price and quantity sold and bought will increase. D. The demand for X will decrease, and thus the price and quantity sold and bought will increase. E. The demand for X will increase, and thus the price and quantity sold and bought will remain the same.
#10 • A. B. C. D. E. Tasha decides that when homes in her neighborhood are selling for $150, 000 she will not sell her home. When average prices rise to $175, 000, she decides that she will put her home on the market. This is an example of: market demand. market-day supply. an excess supply of homes. a positively-sloped supply curve. a negatively-sloped supply curve.
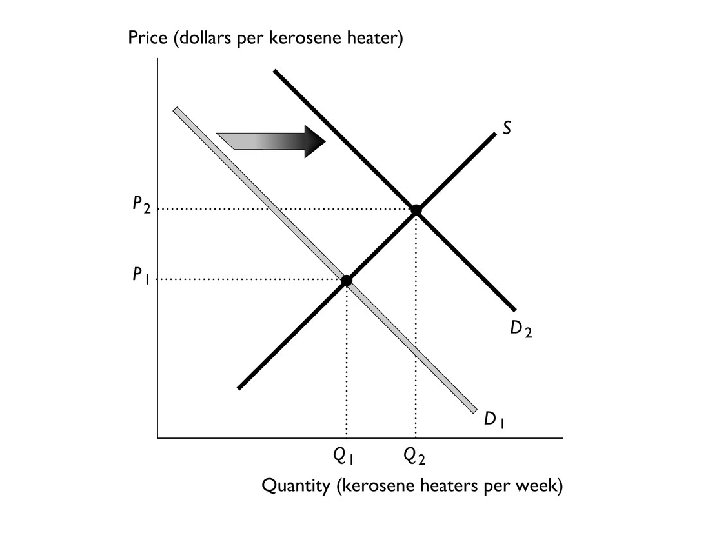
Free Response 1 • Last year a very severe ice storm hit the north counties of New York state, and the states of Vermont and Maine. Electric poles were down and no one had power for days. It was reported that the price of kerosene heaters skyrocketed and the number purchased increased during this time. Using a supply and demand diagram, show the impact of the ice storm on the market for kerosene heaters. •
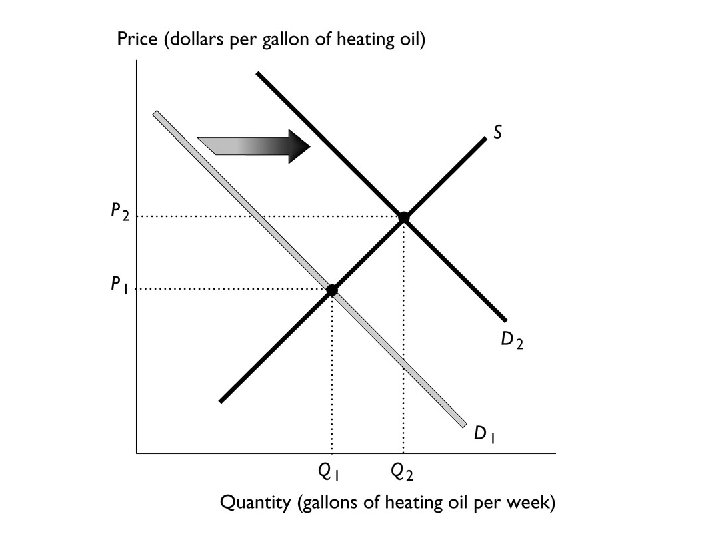
Free Response 2 • Consumers can use either natural gas or heating oil to warm their houses. Suppose the price of natural gas increases. Use a demand supply diagram to show the impact of the higher price of natural gas on the market for home heating oil. •
• The diagram above illustrates the market for apartments in Victoria, British Columbia. • a. If the current is $300 per month, is there a shortage or surplus in the apartment market and how much is the shortage or surplus? • b. What is the equilibrium rent and quantity of apartments?
Answers: a. If the rent is $300 per month, there is a shortage of 30, 000 apartments. b. The equilibrium rent is $400 per month and the equilibrium quantity is 40, 000 apartments.