Widerange Multiphase Equations of State and Radiative Opacity


 and Indirect (b) Laser Driven Shock Wave Setups Alessandra Benuzzi et al.")


 (cm 2/g) calculated for alloy")
")


")


 or P = P(V, E)")
")


, Polystyrene (PS) & Polyimide (PI)")

- Slides: 55
Wide-range Multiphase Equations of State and Radiative Opacity of Substances at High Energy Densities Konstantin V. Khishchenko, Nikolay Yu. Orlov Joint Institute for High Temperatures, Russian Academy of Sciences, Moscow, Russia EMMI Workshop on Plasma Physics with Intense Ion and Laser Beam, November 21 -22, 2008, GSI, Darmstadt, Germany
Pressure–Volume–Temperature Surface for Copper H - principal Hugoniot P, GPa 1. 0 e+05 HP - porous Hugoniots S - release isentropes IEX - isobaric expansion H HP MELTING CRYSTALL S 1. 0 e+02 LIQ. CP PLASMA IEX 1. 0 e-01 LM LIQ. +GAS 1. 0 e-04 1. 0 e+00 V, 1. 0 e+01 cm 3/g 1. 0 e+03 1. 0 e+00 T, k. K
Institute for High Energy Densities RAS, Moscow Povarnitsyn M. E. , Khishchenko K. V. , Levashov P. R. Hypervelocity impact modeling with different equations of state // Int. J. Impact Eng. 2006. V. 33. P. 625– 633. Density distribution 3. 00 2. 25 1. 50 0. 75 10 -5 Impactor - Al, velocity of impactor - 6. 6 km/s, diameter of impactor - 15 mm Target - Al, thickness of target - 6. 35 mm
Modeling of Laser-Matter Interaction by Mikhail E. Povarnitsyn et al. Images of the shockwave in the ambient gas (at normal conditions) and the ejected material after irradiation of the aluminum target with pulse parameters: L = 20 ns, R = 0. 96, opt = 200 nm, IL = 5 x 10⁸ W/cm 2, t 0 = L r. L = 300 mm
Pressure–Volume–Temperature Surface for Copper H - principal Hugoniot P, GPa 1. 0 e+05 HP - porous Hugoniots S - release isentropes IEX - isobaric expansion H HP MELTING CRYSTALL S 1. 0 e+02 LIQ. CP PLASMA IEX 1. 0 e-01 LM LIQ. +GAS 1. 0 e-04 1. 0 e+00 V, 1. 0 e+01 cm 3/g 1. 0 e+03 1. 0 e+00 T, k. K
Shock-Wave Pressure in Experiments with Different Driving Systems
Direct (a) and Indirect (b) Laser Driven Shock Wave Setups Alessandra Benuzzi et al. , Phys. Rev. E 54 (1996) 2162
Multiphase Equations of State
Equation of State Model General form Solid phase. Elastic component (EOS at T = 0 K) at V < V 0 c : at V > V 0 c : at V = V 0 c :
Equation of State Model General form Solid phase. Thermal lattice components
Equation of State Model General form Fluid phase. Elastic component (EOS at T = 0 K) at V < Vm 0 : at Vm 0 < Vcr : at Vcr < V :
Equation of State Model General form Fluid phase. Thermal atomic components
Equation of State Model General form Thermal electron component is from Ref. [A. V. Bushman, V. E. Fortov, G. I. Kanel’, A. L. Ni, Intense Dynamic Loading of Condensed Matter (Taylor & Francis, Washington, 1993). ]
Zinc at T = 0 & 293 K
Aluminum at P = 1 bar Specific heat capacity of the solid phase under normal pressure Thermal expansion of the solid and liquid phases
Aluminum Phase Diagram 1 - Boehler & Ross 1997 2 - Hanstrom & Lazor 2000 Density-Temperature Diagram
Tungsten Phase Diagram
Equation of State for Zinc in Shock and Release Waves
Pressure of Shock Compression of a Sample to Be Achieved for Critical Point Investigation in Isentropic Release Waves
Equation of State for PMMA Comparison with Temperature Data Р = 1 bar Hugoniot
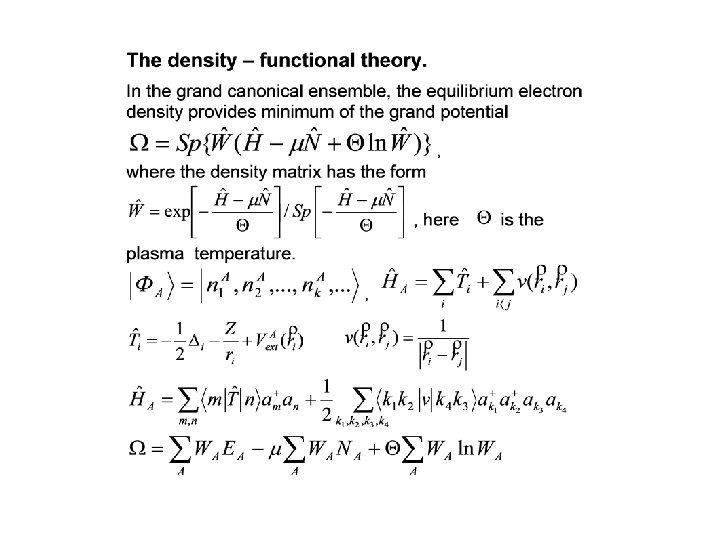
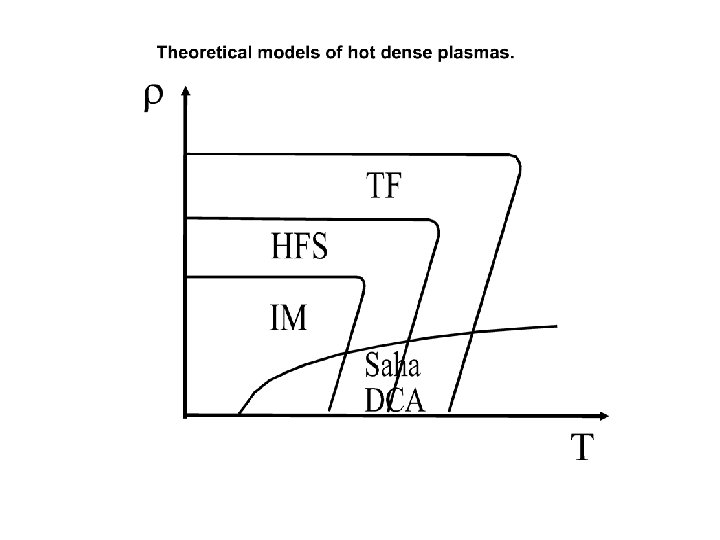
Radiative Opacity of Plasmas
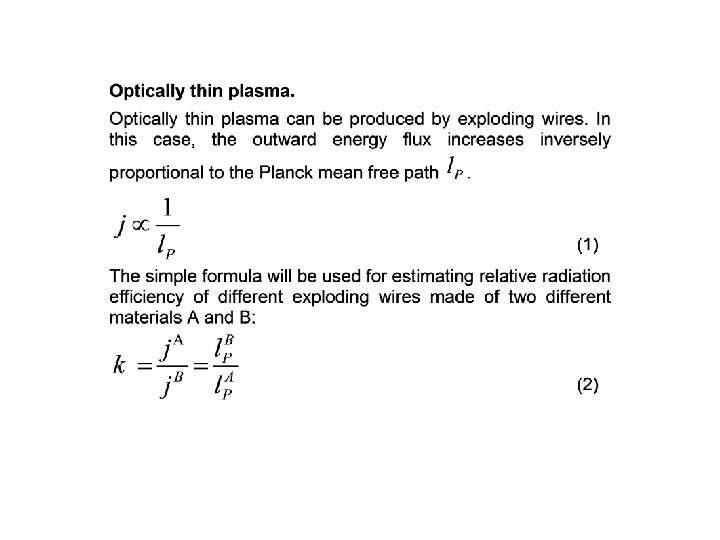
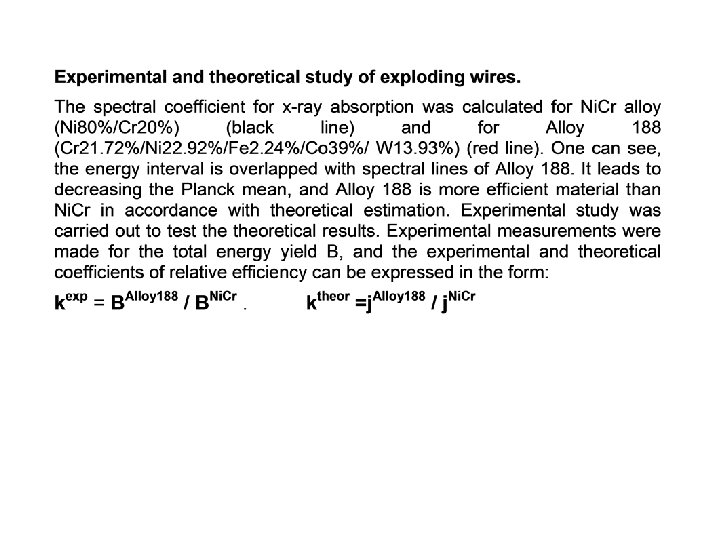
Fig. 1. The spectral coefficient for X-rays absorption K(x) (cm 2/g) calculated for alloy (Ni 80%/Cr 20%) (black line) and for the composition Alloy 188 (Cr 21. 72%/Ni 22. 92%/Fe 2. 24%/Co 39%/W 13. 93%) (red line) at the temperature T=1 ke. V and the density
Orlov N. Yu. , et al. , Laser and Particle Beams 25 (2007)
1. The Ion Model provides reliable quantum mechanical calculations of the radiative opacity over a wide range of plasma temperature and density. 2. The Ion Model can be used to give theoretical explanations of experimental results at high energy density in plasmas.
Thank You
Shock Hugoniots & Release Isentropes
Aluminum Phase Diagram 1 - Sinko & Smirnov 2002 Density-Temperature Diagram Critical point (CP) parameters are from Ref. [V. E. Fortov, A. N. Dremin, A. A. Leont'ev, Teplofiz. Vys. Temp. 13(5), 1072 (1975)]
Hugoniot of Tin
Phase Diagram of Tin
T = 298 K & Hugoniot of Tin
Phase Diagram of Tin
Phase Diagrams of KCl and Cs. I KCL Cs. I
Phase Diagram of Silica V. P. Dmitriev et al // Phys. Rev. B. 1998. V. 58. P. 11911.
Phase Diagram of System Quartz–Coesite–Stishovite
Phase Diagram of System Quartz–Coesite–Stishovite–Liquid
Phase Diagram of System Quartz–Coesite–Stishovite–Liquid
Phase Diagram of System Quartz–Stishovite–Liquid
Phase Diagram of System Quartz–Stishovite–Liquid
Hugoniot of Titanium
Hugoniot of Titanium
Phase Diagram of Titanium
Caloric Equations of State
Pressure–Volume–Internal Energy Surface for Polytetrafluoroethylene C — cold curve at T = 0 K, H & Hp — principal and porous Hugoniots, R — double shock compression curve, S — release isentrope
Caloric Equation of State Model E = E(V, P) or P = P(V, E) General form Thermal component (according to Bushman & Lomonosov 1989)
Equation of State Model General form Elastic component (EOS at T = 0 K) at V < V 0 c : at V > V 0 c : at V = V 0 c :
Equation of State for Copper
Shock Hugoniots & Release Isentropes Polymethylmethacrylate Polytetrafluoroethylene
Shock Hugoniots of Aromatic Polymers Polyimide a — Polyamide, b — Polystyrene
Shock Hugoniots of Polyamide (PA), Polystyrene (PS) & Polyimide (PI)
Al impactor, Al target Caloric EOS Multiphase EOS 6. 6 km/s, impactor 15 mm in diameter, plate thickness - 6. 35 mm