Chapter 2 MultiPhase Systems Multiphase Systems Virtually all


- Slides: 40
Chapter 2 Multi-Phase Systems
Multiphase Systems Virtually all commercial chemical processes involve operations in which material is transferred from one phase (gas, liquid, or solid) into another. These multiphase operations include all phase-change operations on a single species, such as freezing, melting, evaporation, and condensation, and most separation and purification processes, which are designed to separate components of mixtures from one another. Most separations are accomplished by feeding a mixture of species A and B into a two-phase system under conditions such that most of the A remains in its original phase and most of the B transfers into a second phase. The two phases then either separate themselves under the influence of gravity—as when gases and liquids or two immiscible liquids separate—or are separated with the aid of a device such as a filter
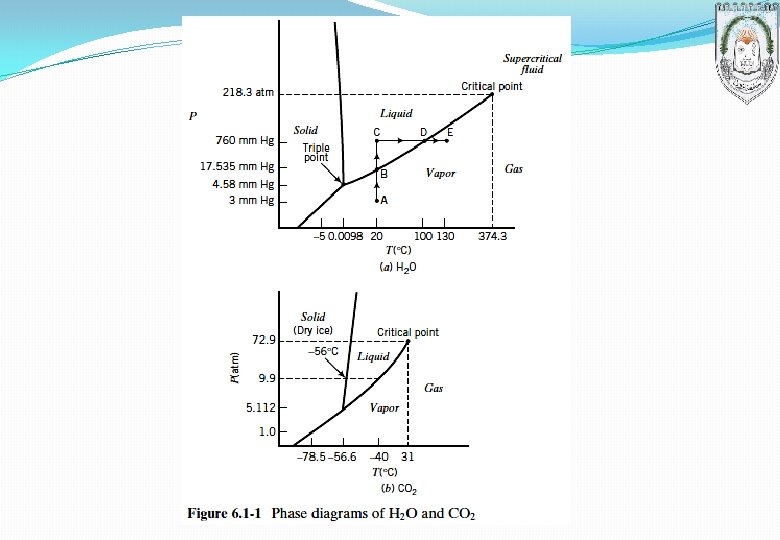
Multiphase Systems SINGLE-COMPONENT PHASE EQUILIBRIUM At most temperatures and pressures, a single pure substance at equilibrium exists entirely as a solid, liquid, or gas; but at certain temperatures and pressures, two and even all three phases may coexist. Pure water is a gas at 130 ºC and 100 mm Hg, for example, and a solid at – 40 ºC and 10 atm, but at 100 ºC and 1 atm it may be a gas, a liquid, or a mixture of both, and at approximately 0. 0098 ºC and 4. 58 mm Hg it may be a solid, a liquid, a gas, or any combination of the three. A phase diagrams of a pure substance is a plot of one system variable against another that shows the conditions at which the substance exists as a solid, a liquid, and a gas. The most common of these diagrams plots pressure on the vertical axis versus temperature on the horizontal axis. The boundaries between the single-phase regions represent the pressures and temperatures at which two phases may coexist. The phase diagrams of water and carbon dioxide are shown in Figure 6. 1 -1.
SINGLE-COMPONENT PHASE EQUILIBRIUM Phase diagrams Suppose the system is initially at 20 ºC, and the force is set at a value such that the system pressure is 3 mm Hg. As the phase diagram shows, water can only exist as a vapor at these conditions, so any liquid that may initially have been in the chamber evaporates, until finally the chamber contains only water vapor at 20 ºC and 3 mm Hg (point A on Figure 6. 1 -1 ). Now suppose the force on the piston is slowly increased with the system temperature held constant at 20 ºC until the pressure in the cylinder reaches 760 mm Hg, and thereafter heat is added to the system with the pressure remaining constant until the temperature reaches 130 ºC. The state of the water throughout this process can be determined by following path
Notice that the phase transitions—condensation at point B and evaporation at point D take place at boundaries on the phase diagram; the system cannot move off these boundaries until the transitions are complete.
Several familiar terms may be defined with reference to the phase diagram. 1. If T and P correspond to a point on the vapor–liquid equilibrium curve for a substance, P is the vapor pressure of the substance at temperature , and is the (more precisely, the boiling point temperature) of the substance at pressure. 2. The boiling point of a substance at P =1 atm is the normal boiling point of that substance. 3. If (T , P ) falls on the solid–liquid equilibrium curve, then T is the melting point or freezing point at pressure P. 4. If (T , P ) falls on the solid–vapor equilibrium curve, then P is the vapor pressure of the solid at temperature T, and T is the sublimation point at pressure P. 5. The point (T , P) at which solid, liquid, and vapor phases can all coexist is called the triple point of the substance. 6. The vapor–liquid equilibrium curve terminates at the critical temperature and critical pressure (Tc and Pc ). Above and to the right of the critical point, two separate phases never coexist.
Estimation of Vapor Pressures The volatility of a species is the degree to which the species tends to transfer from the liquid (or solid) state to the vapor state. At a given temperature and pressure, a highly volatile substance is much more likely to be found as a vapor than is a substance with low volatility, which is more likely to be found in a condensed phase (liquid or solid).
Estimation of Vapor Pressures
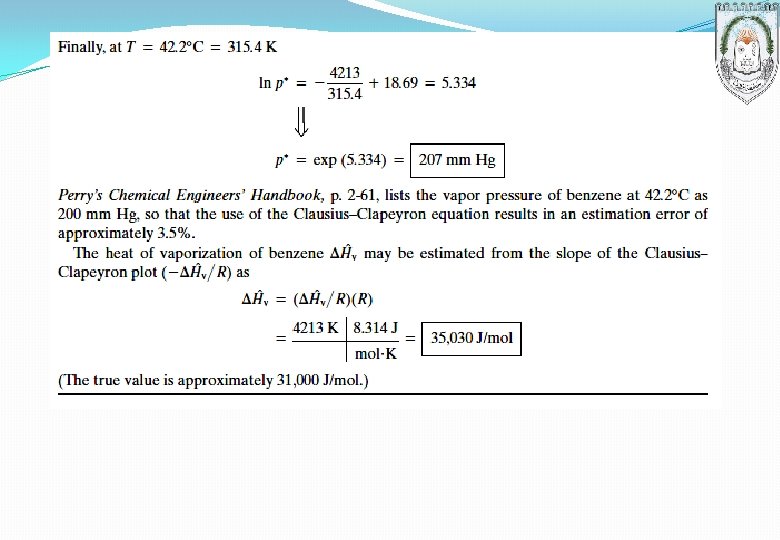
EXAMPLE: Vapor Pressure Estimation Using the Clausius–Clapeyron Equation The vapor pressure of benzene is measured at two temperatures, with the following results: Calculate the latent heat of vaporization and the parameter B in the Clausius–Clapeyron equation and then estimate p* at 42. 2 ºC using this equation. SOLUTION
The intercept B is obtained from Equation 6. 1 -3 as = ln 40 + (4213 280. 8) = 18. 69 The Clausius–Clapeyron equation is therefore:
GAS–LIQUID SYSTEMS: ONE CONDENSABLE COMPONENT A law that describes the behavior of gas–liquid systems over a wide range of conditions provides the desired relationship. If a gas at temperature T and pressure P contains a saturated vapor whose mole fraction is yi (mol apor/mol total as), and if this vapor is the only species that would condense if the temperature were slightly lowered, then the partial pressure of the vapor in the as equals the pure-component vapor pressure pi* (T) at the system temperature.
EXAMPLE: Composition of a Saturated Gas–Vapor System Air and liquid water are contained at equilibrium in a closed chamber at 75 ºC and 760 mm Hg. Calculate the molar composition of the gas phase. SOLUTION Since the gas and liquid are in equilibrium, the air must be saturated with water vapor (if it were not, more water would evaporate), so that Raoult’s law may be applied:
Several important points concerning the behavior of gas–liquid systems and several terms used to describe the state of such systems are summarized here. The difference between the temperature and the dew point of a gas is called the degrees of superheat of the gas.
EXAMPLE A stream of air at 100 ºC and 5260 mm Hg contains 10. 0% water by volume. Calculate the dew point and degrees of superheat of the air. SOLUTION
Humidity If you are given any of the following quantities for a gas at a given temperature and pressure, you can solve the defining equation to calculate the partial pressure or mole fraction of the vapor in the gas; thereafter, you can use the formulas given previously to calculate the dew point and degrees of superheat.
EXAMPLE Humid air at 75 ºC, 1. 1 bar, and 30% relative humidity is fed into a process unit at a rate of 1000 m /h. Determine: (1) the molar flow rates of water, dry air, and oxygen entering the process unit, (2) the molal humidity, absolute humidity, and percentage humidity of the air, and (3) the dew point. SOLUTION
Consequently, The same result could have been obtained from the results of part 1 as (3. 99 kmol H 2 O/h)/ (34. 0 kmol BDA/h).
Raoult’s Law and Henry’s Law Suppose A is a substance contained in a gas–liquid system in equilibrium at temperature and pressure. Two simple expressions—Raoult’s law and Henry’s law —provide relationships between p. A, the partial pressure of A in the gas phase, and x. A, the mole fraction of A in the liquid phase. Raoult’s Law: where is the vapor pressure of pure liquid A at temperature T and y. A is the mole fraction of A in the gas phase. Raoult’s law is an approximation that is generally valid when x. A is close to 1—that is, when the liquid is almost pure A Henry’s Law: where HA (T) is the Henry’s law constant for A in a specific solvent. Henry’s law is generally valid for solutions in which x. A is close to 0.
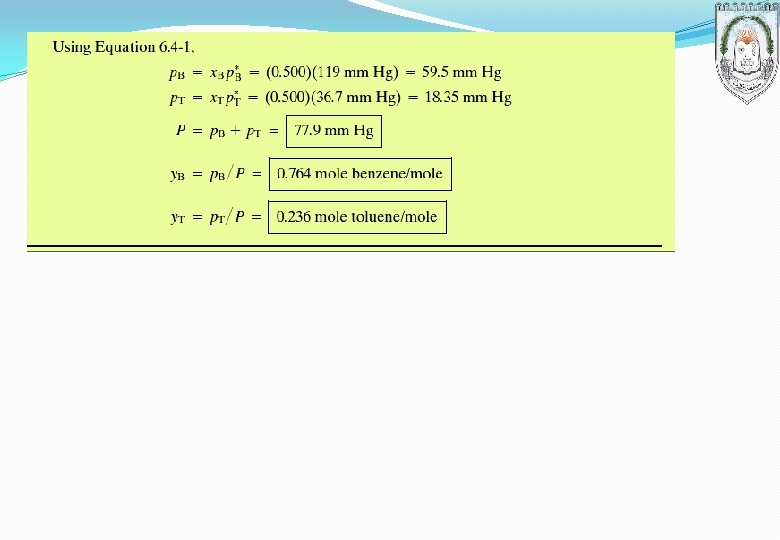
EXAMPLE: Raoult’s Law and Henry’s Law Use either Raoult’s law or Henry’s law to solve the following problems. 1. A gas containing 1. 00 mole% ethane is in contact with water at 20. 0 ºC and 20. 0 atm. Estimate the mole fraction of dissolved ethane. 2. An equimolar liquid mixture of benzene (B) and toluene (T) is in equilibrium with its vapor at 30. 0 ºC. What is the system pressure and the composition of the vapor? SOLUTION
Vapor–Liquid Equilibrium Calculations for Ideal Solutions Suppose an ideal liquid solution follows Raoult’s law and contains species A, B, C, with known mole fractions x. A, x. B, x. C. If the mixture is heated at a constant pressure to its bubblepoint temperature TBP, the further addition of a slight amount of heat will lead to the formation of a vapor phase. Since the vapor is in equilibrium with the liquid, and we now assume that the vapor is ideal (follows the ideal gas equation of state), the partial pressures of the components are given by Raoult’s law, Equation 6. 4 -1. Where is the vapor pressure of component at the bubble-point temperature. Moreover, since we have assumed that only A, B, C, … are present in the system, the sum of the partial pressures must be the total system pressure, P; hence,
The pressure at which the first vapor forms when a liquid is decompressed at a constant temperature is the bubble-point pressure of the liquid at the given temperature. Equation 6. 4 -4 can be used to determine such a pressure for an ideal liquid solution at a specific temperature, and the mole fractions in the vapor in equilibrium with the liquid can then be determined as: Let yi be the mole fraction of component in the gas. If the gas mixture is cooled slowly to its dew point, Tdb, it will be in equilibrium with the first liquid that forms. Assuming that Raoult’s law applies, the liquid-phase mole fractions may be calculated as:
At the dew point of the gas mixture, the mole fractions of the liquid components (those that are condensable) must sum to 1: The dew-point pressure, which relates to condensation brought about by increasing system pressure at constant temperature, can be determined by solving Equation 6. 4 -7 for : Liquid mole fractions may then be calculated from Equation 6. 4 -6 with Tdb replaced by the system temperature, T.
EXAMPLE: Bubble- and Dew-Point Calculations 1. Calculate the temperature and composition of a vapor in equilibrium with a liquid that is 40. 0 mole% benzene– 60. 0 mole% toluene at 1 atm. Is the calculated temperature a bubble-point or dewpoint temperature? 2. Calculate the temperature and composition of a liquid in equilibrium with a gas mixture containing 10. 0 mole% benzene, 10. 0 mole% toluene, and the balance nitrogen (which may be considered noncondensable) at 1 atm. Is the calculated temperature a bubble-point or dew-point temperature? 3. A gas mixture consisting of 15. 0 mole% benzene, 10. 0 mole% toluene, and 75. 0 mole% nitrogen is compressed isothermally at 80 C until condensation occurs. At what pressure will condensation begin? What will be the composition of the initial condensate? SOLUTION Let A = benzene; B = toluene Equation 6. 4 -4 may be written in the form The solution procedure is to choose a temperature, evaluate and for that temperature from the Antoine equation using constants from Table B. 4, evaluate f (Tdb) from the above equation, and repeat the calculations until a temperature is found for which f (Tdb) is sufficiently close to 0.
The solution is taken to be Tdb = 95. 1 ºC. At this temperature, Equation 6. 4 -1 yields Furthermore, from Equation 6. 4 -5, Since the composition of the liquid was given, this was a bubble-point calculation
2. Equation 6. 4 -7 may be written as:
EXAMPLE: Bubble and Dew Point Calculations using Txy Diagrams 1. Using the Txy diagram, estimate the bubble-point temperature and the equilibrium vapor composition associated with a 40 mole% benzene– 60 mole% toluene liquid mixture at 1 atm. If the mixture is steadily vaporized until the remaining liquid contains 25% benzene, what is the final temperature? . 2. Using the Txy diagram, estimate the dew-point temperature and the equilibrium liquid composition associated with a vapor mixture of benzene and toluene containing 40 mole% benzene at 1 atm. If condensation proceeds until the remaining vapor contains 60% benzene, what is the final temperature? SOLUTION
Graphical Representations of Vapor–Liquid Equilibrium
EXAMPLE: Boiling Point of a Mixture A mixture that is 70 mole% benzene and 30 mole% toluene is to be distilled in a batch distillation column. The column startup procedure calls for charging the reboiler at the base of the column and slowly adding heat until boiling begins. Estimate the temperature at which boiling begins and the initial composition of the vapor generated, assuming the system pressure is 760 mm Hg. SOLUTION From the Txy diagram, the mixture will boil at approximately 87 ºC. The initial vapor composition is approximately 88 mole% benzene and 12 mole% toluene.
Colligative Solution Properties Physical properties of a solution generally differ from the same properties of the pure solvent. Under certain conditions, the changes in the values of several properties—such as vapor pressure, boiling point, and freezing point—depend only on the concentration of solute in the solution, and not on what the solute and solvent are. Consider a solution in which the solute mole fraction is and the vapor pressure of the pure solvent at the solution temperature is. Applying Raoult’s law (Equation 6. 4 -1) to the solution, we obtain for the partial pressure of the solvent: