Lecture 3 Multiphase EAS 7970 Multiphase Subsurface Fluid

Lecture 3: Multiphase EAS 7970: Multiphase Subsurface Fluid Flow L. M. Cathles Tammo Steenhuis Larry Brown Spring 2017 3160 Snee Hall

Generalize to non-aqueous Hydrology/water Momentum Equation Continuity Equation Constitutive Relations Diffusion Equation Fluid phase a
=1.")
Relationship to Darcy’s Law Note: Hydrologists specialize to water, planet earth and 20°C. mw(0°C)=1. 78 x 10 -3 Pa s K’[m 2] = K[m s-1] / 107

Horner plot analysis Famous well analysis texts From lecture 2 slide 11 Oil patch Packed off interval Measure pressure Slope gives transmissivity
 oil water • • • * or interfacial")
Multiphase- capillary pressure (the simple view) oil water • • • * or interfacial tension Oil likes oil more than water Interface behaves like a stretched rubber sheet oil-water surface* tension, g , molds oil into sphere like a balloon Pressure inside oil is greater than in water by capillary pressure, pc Force balance gives the pressure pc greater for smaller oil bubbles bubble size determined by pore size entry pressure Oil must be pushed into a finer strata Water gets “sucked in” or imbibed Note: water is assumed to “wet” the solid surface

Multiphase Force driving petroleum same as that driving water + buoyancy term causing lighter petroleum to rise + capillary term pushing petroleum out of finer pores Oil is buoyant pc pushes oil out of fine pores up positive points down - points up grad 1/r increases into pore - grad 1/r pushes oil out
")
But water is also sucked into fine pores if surface is hydrophilic (water wet) Capillary tube illustration Tree rootlets do the (can “suck” at -40 bars) Note: cos ϴ is wetting angle Often assumed: cos ϴ ~ 1

Contact angle indicates surface preference Contact angle between liquid drop and surface (measured from the liquid-solid surface) water * hydrophobic Hydrophilic or water wet Material can be both oil and water wet * The force balance argument is tricky and probably requires a thermodynamic perspective which we will sidestep here
")
Liquid oil and water on Haynesville gas shale Engelder et al. (2014)

Imbibition of water into Marcellus Shale Notice gas is expelled as water is imbibed How can a sediment be both water and oil wet? Engelder et al. (2014)
 Packed column porous plate pc=pnw-pw vacuum Imbibition")
Imbibition and drainage (always relative to water) Packed column porous plate pc=pnw-pw vacuum Imbibition not same as drainage curves (because gas left behind) Drainage (of water) , e. g. inject gas Entry pressure of gas, pc=pg-pw, pw=0 at entry surface Cannot push gas into 100% of pores Siw Sinw When imbibe water, not all gas can exit …end effect in column tests

Example: Steel plug L meters long with three holes

Thus, as we force oil into the steel plug by increasing po, we obtain a crude drainage curve If we then lower the pressure on the oil the water will imbibe first in the small pore, then in the middle, and then in the large, producing an identical imbibition curve

If the oil introduced into the large pore causes it to become fully oil wet (e. g. , ϴ=180°), po must be negative to pull the oil out of this last pore. Sometimes introducing oil will cause part of a core to become oil wet.

Hysteresis can occur even in one pore model. When pressure is sufficient for oil to enter the narrow pore, oil will also fill all the wider parts of that pore. But when po is reduced, water will not imbibe into wider parts until oil pressure is reduced below the oil entry pressure there.

Relative permeability For permeability of A, turn other phase into rock Why not fall steeply? Consolidated sand Why fall steeply? Unconsolidated sand Siw Sinw

Fluid Properties To calculate, we need fluid properties

Viscosity of water At 20°C the dynamic viscosity is 1. 0 x 10 -3 Pa s. At 100°C it is 0. 28 x 10 -3 Pa s, less than 1/3 rd the 20°C viscosity. To good approximation between 0 and 150°C:
 Empirical relationships have been discovered that describe")
Viscosity of oil = f(T, GOR, API) Empirical relationships have been discovered that describe oil viscosity. For example, Beggs and Robinson (1974) showed that dead (mdo) and live (mo) viscosity in centipoise (1 cp=10 -3 Pa s) can be described as a function of temperature (TF[°F]), GOR (gas oil ratio in scf /bbl ), and oil density in API: API gravity (oil density) is a function of oil maturity (how thoroughly the oil has been cooked). Ultimately oil cooks to methane plus a residual, but on the way the oil progresses from heavy (e. g. , high density) viscous oil, to light oil. API gravity was an early way to conveniently compare the density of oil and water.

GOR of Oil Typically oil contains sufficient gas that as it migrates upward (it is less dense than water) it expels gas. When it reaches a reservoir it is therefore commonly gas saturated. The oil contains just the amount of gas such that it is at its bubble point—gas is just on the verge of “bubbling” out of the oil. In other words the reservoir pressure equal the bubble point of the oil. The bubble point of oil depends on TF, GOR, and API: Glasø(1980) For pb=preservoir, we can invert to obtain GOR

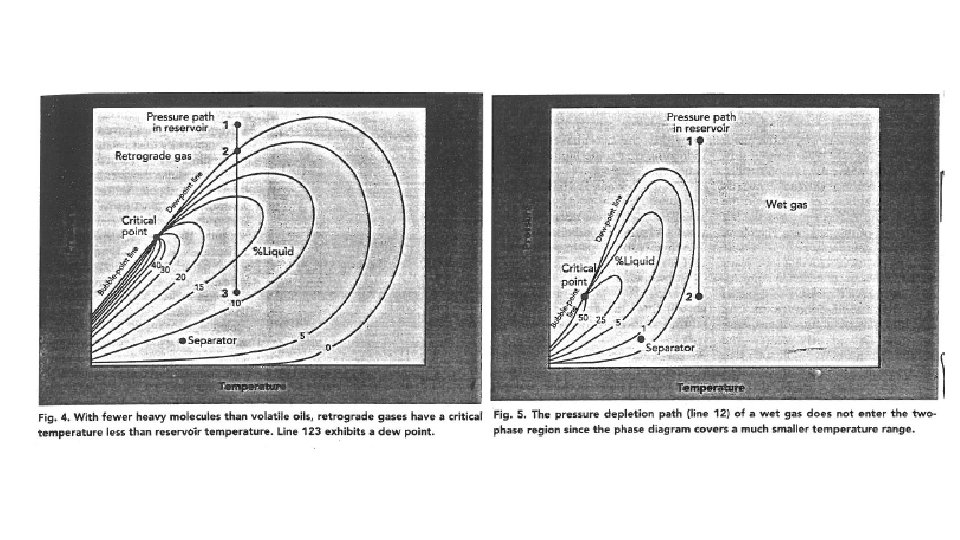
Phase Diagrams On Blackboard to read

A calculator is on eas-cathles Oil is at 2 km depth Pressure is hydrostatic T=60 C, p=200 bars Bubble point is 200 bars GOR=766 scf/bbl Live viscosity = 0. 00042 Pa s Note: some of these are for startup initial values. Numbers are slightly different when spin. For example after spin up and back, GOR=856. 7 but live viscosity is still 4. 2=10 -4 Pa s. Now let’s see how a carrier bed might operate for a reasonable oil generation rate.

Carrier bed calculation Need: 2° GK=0. 02 h=100 m 1500 m fo fs rsed rpet maturable pet/kg sed source thickness maturation interval 0. 55 0. 1 2400 kg m-3 h 800 kg m-3 Very thin layer of oil migrates along top of carrier sand! Darcy sand, k’= 10 -12 m 2 m=4. 2 x 10 -4 Pa s Source rock of thickness h

In 1987 Dave Powley of Amoco raised issue of pressure compartmentation with GRI Powley 1987 presentation to Gri

TOOP in Go. M Powley’s Buried Beer Bottle Model Al Saieb, Anadarko Basin Powley 1987 presentation to Gri
 Bradley and Powley (1990)")
10 years of evidence Powley (1990) Bradley and Powley (1990)
")
Bradley and Powley (1990)
 North Sea")
GRI Verification Sacramento Valley, Ca Hunt (1990) North Sea

Pockmarks and seepages Pockmarks produced by gas-driven water venting

Gas plumes are fairly common Echo Sounder Records of Gas Plumes in the Water Column of the Hydrate Ridge Region Trehu A M et al , 2003
 Worms grazing on bacteria growing on surface of methane ice")
Ian Mac. Donald (TAMU) Worms grazing on bacteria growing on surface of methane ice Salt dome Ian Mac. Donald (TAMU) http: //oceanlink. island. net/ONews 7/images/ mud%20 vol%20 -%20 FBGNMS. jpg gas Brine pool Methanotrophic mussels Mud Volcano
 Mineral chimney and microbe mats http: //i. livescience. com/images/090407 -deep-vent-02.")
Ian Mac. Donald (TAMU) Mineral chimney and microbe mats http: //i. livescience. com/images/090407 -deep-vent-02. jpg Ian Mac. Donald (TAMU) Oceanexplorer. noaa. gov Small oil droplets adhering to hydrate Callogoria coral; cup coral Madrepora coral Mississippi Canyon
 seals How would they work?")
Reservoir (capillary) seals How would they work?
 on blackboard 2.")
Assignment 1. Read p 14 -20 of Cathles and Adams (2005) on blackboard 2. Experiment with calculator 3. Seek to understand how Petrel handles fluid and material properties
- Slides: 35