Earths Life Support 4 Main Components page 53


 above the")


")


")


 Global Warming Web Site. http: //www. epa.")
- Slides: 60
Earth’s Life Support: 4 Main Components page 53, 475 - 476 v 3. 8
Earth’s 4 Major Components 1. 2. 3. 4. Atmosphere Hydrosphere Geosphere Biosphere
Atmosphere • Troposphere • Stratosphere
Atmosphere • A thin blanket of gases surrounding the earth • Divided into several spherical layers (thermosphere, mesophere, stratosphere, troposphere) • Main focus: – Troposphere – Stratosphere
Density • Number of gas molecules per unit of air volume • Varies throughout the atmosphere because gravity pulls its gas molecules toward the earth’s surface • Lower layers have more gases (more weight) than the upper layers • Air at sea level has a higher density than the air we would inhale on top of a high mountain
Atmospheric Pressure • The force, or mass, per unit area of a column of air • This force is caused by molecules in the air bombarding a surface (such as your skin) • Decreased with altitude because there are fewer gas molecules at higher altitudes
Troposphere • 75 -80% of the earth’s air mass • Atmospheric layer closest to the earth’s surface • Extends only 17 km (11 miles) above sea level at the equator and 6 km (4 miles) above sea level over the poles
The Air You Breathe • Nitrogen – 78% • Oxygen – 21% • Water Vapor – 0. 01 – 4% – Humid tropics: 1% • Argon: 0. 93% • Carbon Dioxide: 0. 040% • Trace amounts of dust and soot particles, CH 4, ozone (O 3), nitrous oxide (N 2 O)
Stratosphere • Extends 17 to about 48 km (11 to 30 miles) above the earth’s surface • Composed of less matter than troposphere • But similar in composition – Exceptions: • Volume of water is 1/1, 000 th that of the troposphere • Concentration of ozone is much higher
Ozone Layer • Most of ozone is in stratosphere • 17 -26 km (11 -16 miles) above sea level • Stratospheric ozone is produced when some of the oxygen molecules in this layer interact with ultraviolet (UV) radiation emitted by the sun
Stratospheric Sunscreen • Ozone keeps about 95% of the sun’s harmful UV radiation from reaching the earth’s surface • Ozone protects us from: – Sunburns – Skin and eye cancers – Cataracts – Damage to our immune systems
Atmospheric Composition • Reported on a dry basis, water vapor • • excluded since it’s so variable. Only 2 gases comprise 99% Water vapor normally <1 - 4% Gross & Gross, 1996 Minor gases exert influence far greater than their abundance would suggest, e. g. greenhouse effect, UV protection, photosynthesis, etc.
Dynamic Equilibrium of Atmospheric Water Vapor • • Atmospheric water vapor varies immensely with place and time. For Earth as a whole, evaporation equals precipitation. For ocean as a whole, evaporation exceeds precipitation. Latent heat of vaporization supplies much of heat to drive convection. Gross & Gross, 1996
Garrison, 2005 Air parcels change size & temperature as they rise & fall. • Rising & • cooling triggers condensation which forms clouds & rain. Latent heat released at condensation further warms air and forces more rising.
• • • The exosphere tails off into space and meets the solar wind. The ionosphere straddles several layers. The ionosphere reflects radio waves & hosts the aurora borealis & aurora australis. Ionosphere Layers of the Atmosphere (p 475)
Structure & Temperature Profile of Lower Atmosphere • • Virtually all weather occurs in troposphere. Earth’s surface heats troposphere from bottom; favors vertical mixing. Stratosphere heated most at middle & top because of UV ray absorption by ozone; limits vertical convective mixing there. Additional layers found above: mesosphere, thermosphere, exosphere. strongest heating by UV -absorbing ozone heating from below Gross & Gross, 1996
Sun Angle Controls Sunlight Intensity • At low angles, sunlight spreads over • much larger areas & thus heats less effectively. At low angles, sunlight reflects from water & ice more efficiently. Garrison, 2005
• • Variation of Solar Radiation with Latitude (also with Seasons and with Time of Day) 2 cal/cm 2/min. at top of atmosphere perpendicular to sun’s rays 0. 5 cal/cm 2/min. on the average at top of atmosphere due to inclination of sun’s rays Even less reaches surface on the average Intensity = 2 x sine (sun’s <) At winter solstice (N. H. ) the most (cal/cm 2/min. ) intense radiation is at Tropic of Capricorn @ noon. Gross & Gross, 1996 noon radiation intensity (cal/cm 2/min. ) at given latitude on equinox days: @40 o = 1. 53 @66. 5 o = 0. 80 @89. 5 o = 0. 02
Earth-Sun Relations To Polaris (North Star)
Emission Spectrum of Sun & Earth • Sun’s “surface” at 6000 o. C radiates strongly in UV, visible, & • • near IR. Earth’s surface & atmosphere at 18 o. C radiate strongly in far IR. Consider area under curve when comparing relative intensities of UV, visible & IR. UV solar radiation visible solar radiation Gross & Gross, 1996 near IR solar radiation Wavelength (micrometers)
• These numbers indicate global averages. Global Heat Budget • Locally the energy fluxes vary with season, time of day, cloud cover, snow cover, vegetation patterns, etc. Greenhouse Effect = + X 5% X 39% X 16% Absorbed Visible Light Converted to Garrison, 2005 IR, Sensible & Latent Heat
Latitudinal Variations in Radiation Budget • Surplus must equal deficits to maintain heat budget. Garrison, 2005 Excess heat lost near poles must be carried from tropics to poles by ocean currents & winds.
Poleward Heat Transport to Balance Unequal Heating • Equator • would be hotter & poles would be much colder without this transport. Transport by winds & ocean currents. Garrison, 2005
• • • The Greenhouse Effect Certain atmospheric gases absorb outbound infrared (IR) radiation and then reradiate it in all directions including downward. Some of the reradiated IR reaches the ground and lower atmosphere to make the Earth warmer than it would be without the greenhouse gases. Much like the glass of a greenhouse allows in light but traps heat. Without any greenhouse gases, Earth would chill to – 18 o. C. Water is the main greenouse gas, but it’s self limiting due to precipitation. CH 4 Garrison, 2005 CH 4
Greenhouse • Is it the main cause of global warming? • Or is the climate cycling due to ice age causes? Effect CO 2 CFC CH 4 Tarbuck & Lutgens, 2005
Greenhouse Gases Greenhouse Gas on BBC Percentage indicates relative • Other gases help CO 2. importance, not relative abundance. • All have significant natural • • sources except CFC’s. Methane = natural gas from swamps & rice paddies, oil & gas wells, coal mines, land fills, cow & termite flatulence, & decomposition. CFC’s being phased out, used in AC and as propellants (hair spray). Low altitude ozone partly from man’s pollution. N 2 O from burning, lightning, moist soils. Cow s CH 4 CO 2 e. g. CCl 2 F 2 O 3 N 2 O Gross & Gross, 1996
Relative Global Temperature Variation 1950 -2000 • • • Mean annual temperatures are indicated as a deviation from the 1951 -1980 global mean. 5 o. C total temperature rise since last ice age (18, 000 years BP) or 0. 03 o. C per century, about half of rise is due to increasing solar output. The 0. 5 o. C rise in the last 25 years looks very significant, = 2 o. C per century. 0. 6 Garrison, 2005
• 1860 begins the period where thermometer Global are available worldwide. Warming • readings Annual averages for entire world compared Since 1860 to averages for 1961 -1990. • Larger rise projected during 21 st century. Tarbuck & Lutgens, 2008
CO 2 Concentration Vs. Time • Has risen rapidly since industrial revolution due to fossil fuel burning. • Many natural sources: volcanoes, burning, respiration, decomposition. • Rise is less than expected. Key cause of greenhouse effect. Fossil Fuels = coal, oil, natural gas, peat Garrison, 2005
CO 2 may be approaching 3 X the preindustrial level in 2100.
• What causes Graph by Dagenhart from data in EPA, 2002. the zig zag detail in the curve?
Tarbuck & Lutgens, 2005 • Rapid rise from coal, gas, • • • and oil burning since 1800. Causes greenhouse effect, i. e. global warming. Missing CO 2 puzzle: concentration is lower than predicted by emissions. Storage in ocean or plants? Rising Carbon Dioxide (CO 2) Levels
Sea Level Change in Last 20, 000 Years • • Water supplied by rapid glacial retreat. Little change in last 6, 000 years. 100 m rise in 11, 000 years = 9. 1 mm/yr average 18. 2 m/yr horizontal shoreline shift on VA Coastal Plain Tarbuck & Lutgens, 2005
Projected Sea Level Rise in This Century • • • Three different estimates. Note the accelerating rate of rise! Worldwide changes are termed eustatic sea level changes. Tarbuck & Lutgens, 2005
Causes of Sea Level Rise This Century • Note the Antarctic Ice Sheet may actually grow in spite of global warming & limit sea level rise. 57% of the sea level rise will result from simple expansion of seawater as it warms. Tarbuck & Lutgens, 2005
Effects of Rising Sea Level Tarbuck & Lutgens, 2005 I-95 Like the East coast in early Tertiary time. Coastal Plain Virginia Beach X Like the West coast. Uplift along an active continental margin may offset sea level rise in CA
Coastline Variation Due To Glacially. Induced Sea Level Changes • Tarbuck & Lutgens, 2005 • • Not “Waterworld” ~ 100 m drop ~ 80 m rise
What does rising sea level mean to islanders? • Land is inundated & barrier reef provides less wave protection. • Great tsunami of December 2004 washed over this island. • Many died. Island in Maldives Garrison, 2005
Do Jet Contrails, Dust, & Smoke Increase Reflection of Sunlight and Reduce Global Warming? • Contrail = condensation trail • Sublimation trail really? • After 911 terrorist attack planes were grounded & contrails were absent, a small percentage increase in solar radiation was detected. Satellite Photograph of Contrails & Ship Smoke Trails over Pacific Ocean; Garrison, 2005
The Ultimate Proof of Global Warming • Let me be brief.
Stratospheric Ozone Layer Depletion • Stratospheric • • ozone shields us from UV rays; prevents skin cancer. Ozone depletion due to chlorofluorocarbons (CFC’s) from man’s pollution. Depletion partly due to natural processes? Observation only carried out for a limited time. Ozone at ground level comes from pollution & irritates lungs. Ozone “Hole” in Stratosphere Over Antarctica Garrison, 2005
Variation of CFC-11 Levels from 1977 -1996 • A leveling off & slight dip in CFC levels appears to be happening as a result of CFC phase out after 1990 treaty. Garrison, 2005
Risks from Increased UV Radiation • • • Higher incidence of skin cancers and mutations. Loss of phytoplankton & zooplankton from upper 2 m of ocean. Damage to land plants & reduced crop yields. Eye cataracts. Immune system suppression • A 1% decrease in ozone is expected to produce a 57% increase in skin cancer. Malignant Melanoma, Garrison, 2005
Decreased Phytoplankton Productivity • As southern • • hemisphere summer begins. Due to increased influx of UV rays through ozone hole over Antarctica. Phytoplankton around Antarctica form the base of a food chain critical to whales and remove much CO 2 from atmosphere. Garrison, 2005
Monthly Variation in Ozone Concentrations Ozone Video 1978 -2001 • • Note ozone hole over Antarctica (dark blue). Note ozone depleted belt near equator (light blue) moves N & S with seasons. NASA, 2005
Hydrosphere • Water: 75% of Earth • Most is salt water
Freshwater • Water that contains only minimal quantities of dissolved salts, especially sodium chloride • All freshwater comes from precipitation of atmospheric water vapor • Watershed: the land area that drains into a particular stream
Carrying Sediments • Water does not travel over land in a straight line • Water, in the form of streams, rivers, etc. , flows according to the lowest topographical path • At the bends, more sediment is dropped off than at the straights of bodies of water
Carrying Sediments • At slower spots, more sediments are dropped off (i. e. bends and deltas) • Deltas: areas at the juncture between rivers and oceans that are formed due to the dropping off of sediments • Estuaries: sites where the “arm” of the sea extends inland to meet the mouth of a river – Often rich in plant and animal species – High concentration of nutrients and sediments
Wetlands • Allow for ecologically diverse ecosystems • Types – Marshes – Swamps – Bogs – Prairie potholes (exist seasonally) – Flood plains
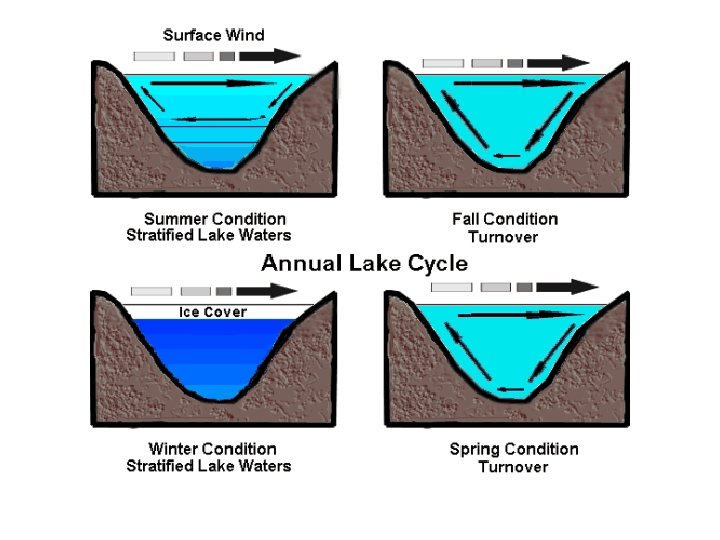
Vertical Stratification in Freshwater Biomes • Vary in temperature, oxygen content, and nutrient levels • Epilimnion: uppermost – most oxygenated • Hypolimnion: lower, colder, and more dense • Thermocline: demarcation line between these two layers
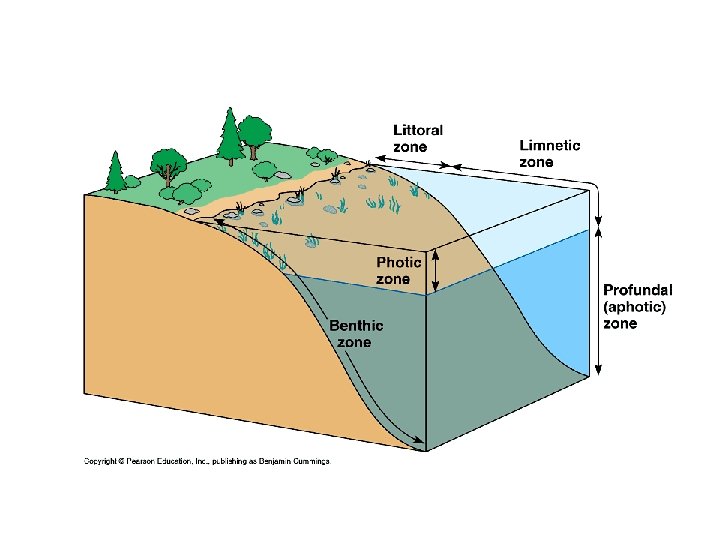
Freshwater Lake Zones • Littoral zone: most shallow at shoreline; plants and animals receive abundant sunlight; end is where rooted plants stop growing • Limnetic zone: surface of open water; extends to the depth that sunlight can penetrate; organisms have short lives and rely on sunlight for photosynthesis • Profundal zone: water that is too deep for sunlight to penetrate; aphotic – light cannot reach • Benthic zone: deepest layer; low temperatures and low oxygen levels
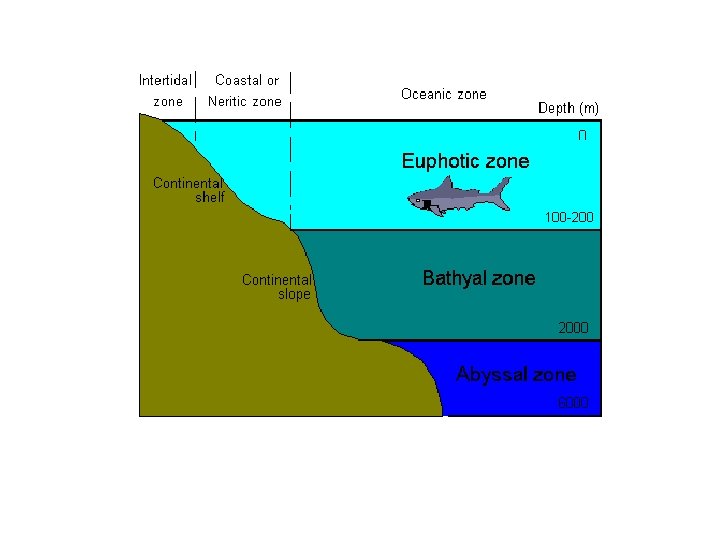
Ocean Zones • Coastal zone: consists of the ocean water closest to land; between the shore and the continental shelf • Euphotic zone: photic, upper layers of water; warmest region of ocean water; highest levels of dissolved oxygen • Bathyal zone: middle region; receive insufficient light for photosynthesis and is colder than the euphotic zone • Abyssal zone: deepest region of the ocean; marked by extremely cold temperatures and very low level of dissolved oxygen; very high levels of nutrients because of decaying plant and animal matter that sinks down from the zones above
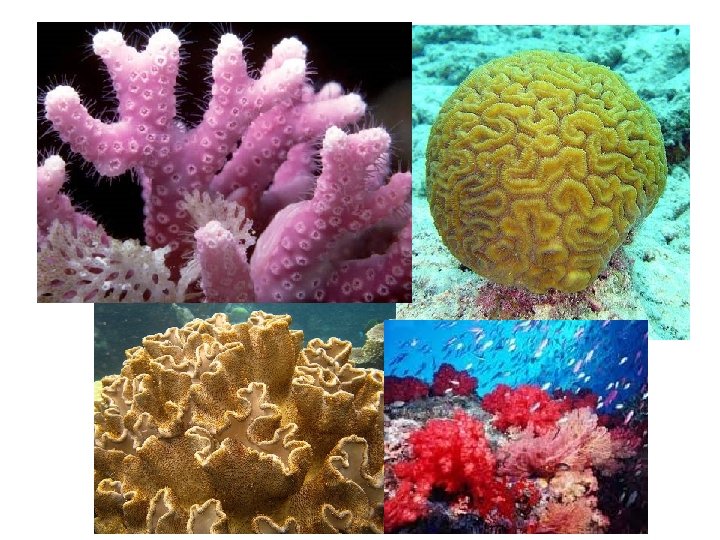
Saltwater Ecosystems • Barrier islands: landforms that lie off coastal shores; created due to build up of deposited sediments – boundaries are constantly shifting as water moves around them; often first hit by storms – buffers for the shoreline • Coral Reef: a type of barrier island; formed from a community of living things – cnidarians (due to their calciferous shells)
References • • Environmental Protection Agency (2002) Global Warming Web Site. http: //www. epa. gov/globalwarming/publications/impacts/ Garrison, T. (2005) Oceanography: An Invitation to Marine Science, 5 th ed. Brooks/Cole Thomson Learning, Stamford, CT, 522 p. Gross, M. G. and E. Gross (1996) Oceanography: A View of the Earth, 7 th ed. Prentice Hall, Upper Saddle River, NJ, 472 pp. Tarbuck, E. J. and F. K. Lutgens (2005) Earth: An Introduction to Physical Geology, 8 th ed. Pearson-Prentice Hall, Upper Saddle River, NJ, 711 p. Sunrise at OHS, Manassas, VA; Dagenhart, 2003