Week 2 Administrative Scribes and Presentations assigned Linked

Week 2

Administrative • Scribes and Presentations assigned • Linked from course website later today • Looking for 3 additional scribes – please sign up if willing • Looking for scribes for today • Scribes • • Latex PDF or Markdown document Note down points made during reading and discussion Clean up notes after class, send to yiru on slack by Friday evening Posted by the following class

Administrative Prefer slack over email Created channels for assignments and reviews Thanks to the students that used nb. mit

Administrative • No class next week • Assignment 2 out later tonight.

Research and Courses Intro courses: teaches correct/incorrect “facts” Research: often times no “correct answer” No paper (outside of theory) completely solves a problem They only provide ideas and some evidence We decide what we believe This class: get comfortable asking and answering own questions

Visualization Grammars

Polaris • Context • Contributions • Comments

Context. 2000 s!
 2003: Tableau")
Context 2002: Polaris paper published (Chris Stolte, Diane Tang, and Pat Hanrahan) 2003: Tableau Founded (Chris Stolte, Pat Hanrahan, and Christian Chabot) 2013: IPO launched ($250 M) 2016: Full year revenue is $826. 9 M 2018: Worldwide company 80+ offices, 3000+ employees 2019: bought by Salesforce for $16 B

Pivot Tables

Visual Insights

Prior Work • Focused on specific types of visualizations, • how to write SQL-esque statements • Prescriptive about presentation and interactions • Menu-based vs direct manipulation • Have to implement data processing and presentation together

Contributions Allow analysts to rapidly specify and change visualizations to explore large multidimensional databases

Contributions • Key observation: layout of plots is based on data • Provide a language for specifying layout • Doesn’t prescribe presentation - visual grammar for plotting • Specification: Layout + visual encodings • Intuitive interface based on spec + useful features Amplifies user interactions for visually comparing aggregate trends

Layout via Table Algebra • Model of the world: • Grid of charts. Same visualization, different data • Hard part: specifying the grid’s x and y (and z) axes • What is an algebra? • Set + operations closed over the set • e. g. , (integers, +) • Why an algebra? • Easier to map interactions to algebra operations • Understand completeness of interface interactions
 • Quantitative: continuous")
Data Model • Data Types • Ordinal: discrete attributes (countries, animals) • Quantitative: continuous attributes (costs, time) • Attribute Types • Dimensions: used to group • Measures: used to compute

Operators Operands: ordered list of values/attributes Region + Gender = {East, West, . . , Boy, Girl} Region + Units = {East, West, North, South, Units} Units + Price = {Units, Price}
, (West, Boy),")
Operators Operands: ordered list of tuples Region * Gender = {(East, Boy), (West, Boy), …} Region * Units = {(East, Units), (West, Units)}
, (East, Girl),")
Operators Operands: ordered list of tuples Region / Gender = {(East, Boy), (East, Girl), (West, Boy) …} Only keep combinations that exist in the database

Visualizations Each layer specifies • Mark type • Mappings from data attributes to mark visual attributes Defaults based on data types • Ordinal-Ordinal • Ordinal-Quantitative • Quant-Quant Follow up on Auto Presentation: Mackinlay, J. D. , et al. Show me: Automatic presentation for visual analysis.

Based on Perceptual Properties

Based on Perceptual Properties
")
Example 1 Cols: Product * Months Rows: State Layer 1 Mark: circle Color: Sum(sales) Size: Sum(margin)
+Avg(Profit) Layer 1: mark: circle group by:")
Example 2 Cols: State * Months Row: Avg(Sales)+Avg(Profit) Layer 1: mark: circle group by: product y pos: metric x pos: month Layer 2: mark: line ypos: metric xpos: month

Menu-based operations • Create new fields • • Aggregation function Discretize a continuous field Custom groups ”Other” for quantitative fields • Sort/Filter
![Running Queries Apply per-record filters Select * where [filters] Figure out list of plots,](http://slidetodoc.com/presentation_image_h/0559230446e4cc88400ffb4c3785b1ef/image-28.jpg "Running Queries Apply per-record filters Select * where [filters] Figure out list of plots,")
Running Queries Apply per-record filters Select * where [filters] Figure out list of plots, find rows for each plot [rows/cols/layers] = select distinct … Select * where [rowi] and [colj] and [layerk] Run group, sort, aggregation for each plot SELECT aggs() GROUP BY {groups} HAVING [filters] ORDER BY … Render

Discussion

The paper itself • What did you think? • • • Writing Technical Depth Experiments Evaluation Value of Contribution

What could the paper have improved? • Some experiments or evaluation of approach • Some notion of completeness or coverage • Still – none of that stopped them from publishing or even better, starting a publicly traded company! • https: //www. youtube. com/watch? v=x 85 Kc. P 5 y 9 HE

Improvements/Future Work • What ways can we improve the system from a data processing standpoint? • Redesign the backend database to optimize for queries of the form described • Use user traces to speculate, optimize, prefetch

Vega Lite

Vega Lite • Paper is not great at clarifying details/what’s going on • Had to read documentation: • https: //vega. github. io/vega-lite/docs/

Prior Work • High level languages have limited interaction support • Predefined interactions • https: //chart-studio. plot. ly/create/? fid=chelsea_lyn: 8648#/ • R’s Shiny has parameterized widgets

Prior Work • High level languages have limited interaction support • Predefined interactions • https: //chart-studio. plot. ly/create/? fid=chelsea_lyn: 8648#/ • R’s Shiny has parameterized widgets • Otherwise, drop to low level • Deal with raw events and callbacks – error prone • Vega is too low level

Stated Goals • High level, suitable for visual exploration • Extend Vega-lite to support multi-views and interactions • Interaction grammar centered around selections • Selections specify what data elements • Transforms specify how to manipulate selections • Compiler from vega-lite to Vega spec • Illustrated through examples to show expressivity
 Unit(data | xforms, mark, encodings) Encoding")
Multi-view: View Algebra Operands: Unit specification (single plot) Unit(data | xforms, mark, encodings) Encoding Channel Field & data-type Value Functions Scale guide
![Multi-view: View Algebra Operators for: layers, horizontal/vertical concat, facets, repetition. layer([units…], resolve) h/vconcat([views…], resolve)](http://slidetodoc.com/presentation_image_h/0559230446e4cc88400ffb4c3785b1ef/image-39.jpg "Multi-view: View Algebra Operators for: layers, horizontal/vertical concat, facets, repetition. layer([units…], resolve) h/vconcat([views…], resolve)")
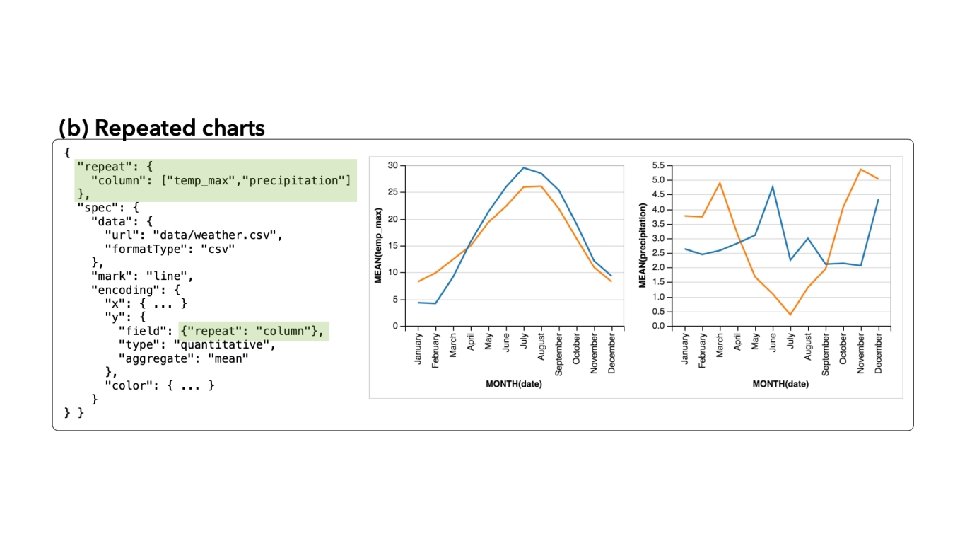
Multi-view: View Algebra Operators for: layers, horizontal/vertical concat, facets, repetition. layer([units…], resolve) h/vconcat([views…], resolve) facet(row/col, data, field , view, scale, axis, resolve) repeat(row/col, values, scale, axis, resolve) Resolve: scales, axes, legend are independent or shared

Interaction Grammar Defines a new data source or variable selection = (name, type, predicate, domain|range, event, init, transforms, resolve) Data space table Pixel/visual space

Selection Types point list interval copy selected record. Same schema as record id IN (…list…). Schema same as records (? ) range predicate. (x: [min, max], y: [min, max], …)

Selection Types

Transforms Project fields from a selection’s schema Toggle updates list selections based on event Translate the selection in the visual space Zoom to scale the selection in visual space Claims commutativity. But translate and zoom not commutative

What can selections be used for? Part of if-else conditions in encoding channels Used as a dataset – input to a view Used as predicate to apply to different dataset Used in any schema-compatible way Range or domain of a scale selection
 Selections in multiple views Single, independent, union, intersect")
Multi-view selections (facets/repeat) Selections in multiple views Single, independent, union, intersect

Tricky parts: conflicting event streams

Discussion

The paper itself • What did you think? • • • Writing Technical Depth Experiments Evaluation Value of Contribution

What could the paper have improved? Clear definition of the algebra and its properties Some notion of completeness or coverage Are example-based evaluations the only method for papers about a new language/grammar?

More abstract • What makes a grammar good? • What is an interaction?
- Slides: 51