Water Treatment Fundamentals Agenda MEP Fundamentals 1 st

: • • Ion exchange chemistry Softener designs")


 What information do I need? 1. Total hardness (including iron)")

(70 gallons/day)")


(0.")


 Example: 60 psi – (1.")

 = 10 gpm •")


")


- Slides: 33
Water Treatment Fundamentals
Agenda • MEP Fundamentals (1 st badge): • • Ion exchange chemistry Softener designs and options Ion exchange capacity calculations RO system and performance RO system capacity Calculate % rejection for RO Filtration mechanics and systems Choosing a filter treatment
LOGIN INFO 1. 2. 3. 4. Use Chrome or Safari as browser Go to wqa. treklem. com FWQAuser. X@none. com P@ssword 1
Order of Operations • Please Excuse My Dear Aunt Sally • Parenthesis, Exponents, Multiply, Divide, Add, Subtract (PEMDAS)
Converting Units •
Softener Sizing Calculations MEP Fundamentals Module B 4 -F-Water Treatment System Operations Badge Learning Activity #5
My Learning Path > C 2 > B 4 > LA-F 5 • 2 Knowledge Base articles • 3 customer examples
Softener sizing calculations (MEP) What information do I need? 1. Total hardness (including iron) 2. Number of people in the household or water usage 3. Exchange capacities
Calculate total hardness • 17 gpg hardness • 1 ppm Iron ? ? Total hardness = 17 gpg + 3 gpg = 20 gpg
Grains removed per day Total Hardness x Daily Water Usage = (3 people)(70 gallons/day) ? ?
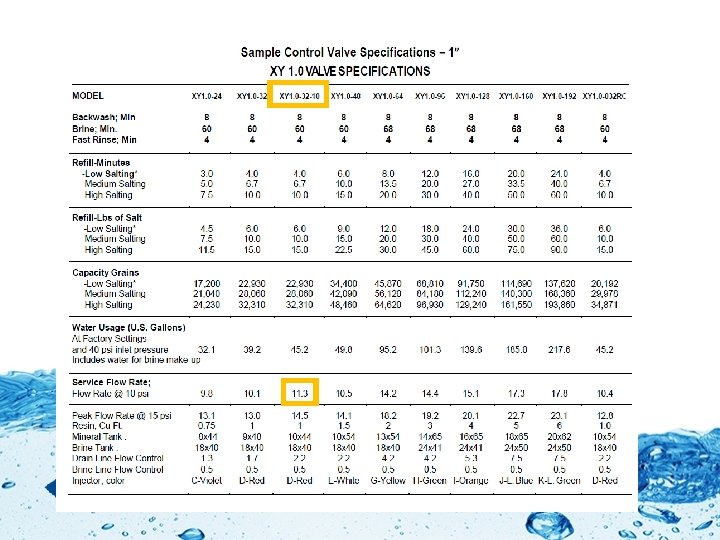
Exchange capacities Choose the amount of resin that can handle the calculated grains of hardness for the desired level of salt.
Processed water volume • 1, 000 gallons
Processed water volume w/ reserve • 30% reserve capacity • (20, 000 grains capacity)(0. 30) = 6, 000 grains 700 gallons
Service run length with reserve 3. 33 days Note: to prevent hardness breakthrough, round down to regenerate every 3 days.
Cycles per month: Salt per month:
% Rejection Calculations MEP Fundamentals Module B 4 -F-Water Treatment System Operations Badge Learning Activity #8
% Rejection What information do I need? 1. Influent concentration of specific contaminant 2. Influent TDS 3. RO % rejection rating of specified contaminant
Concentration in Permeate Example: • Feed-water Arsenic concentration: 10. 0 ppm • RO rejection rating for As: 96% • How much As is in the permeate as a %? 4% 10 ppm x 0. 04 = 0. 4 ppm As in permeate
Pretreatment needs? • Chlorine is a problem because it can degrade the polyamide thin film composite RO membrane, which is the most common membrane used in residential applications. A carbon pre-filter is typically used to remove chlorine. • Iron can clog the membrane by precipitating on it. If dissolved iron exceeds 0. 3 mg/L, reduction of the iron concentration is required. • Organic contaminants such as VOCs may be too small to be removed by the RO membrane. Such contaminants can be removed by a carbon pre-filter, but their presence can require more frequent filter changes. • Hard water can cause scale on the membrane. Hardness ions must be removed or reduced in concentration prior to the RO.
Differential pressure • Influent pressure • Most households are typically 60 psi • Osmotic pressure • Depends on the total dissolved solids in the feed water • Back pressure • The back pressure from the pre-charge on the tank. • Typically, pressure is set between 5 and 10 psi.
Osmotic pressure The reverse osmosis process has to overcome osmotic pressure to operate. • Every 100 ppm TDS is 1 psi of osmotic pressure* • Example: 150 ppm TDS *This estimate is not an exact value for all possible combinations of water constituents, it is sufficient for calculations of performance.
Differential pressure Feed-water pressure – (osmotic + back pressure) Example: 60 psi – (1. 5 psi + 8 psi) = ? 50. 5 psi Mfr. min. operating pressure is 40 psi, do we need a booster pump? No. When the differential pressure is below the minimum manufacturers operating pressure, then a booster pump is recommended.
Sizing A Filter MEP Fundamentals Module Learning Activity #11
Example: Customer #1 • Building demand (calculated by fixture count) = 10 gpm • Backwash flow available = 7. 5 gpm
Example 1:
POE System Sizing MEP Fundamentals Module Learning Activity #15
Service flow rate 1. Count the total* number of water supply fixture units (WSFU’s) using: a. Table A (in WQA Knowledge Base) b. WSFU worksheet 2. Convert the WSFU’s to gpm = service flow rate
Example – Step 1 *Note: Total WSFU’s is not found by adding the hot & cold WSFU’s, it’s the values from the Total column in Table A. Type of fixture or group Number of fixtures or groups Hot water (WSFU) Cold water (WSFU) Total (WSFU) Grp: Shower, lav, water closet - flush tank 2 4 7 8 Lavatory Dishwasher Clothes washer 1 2 1. 5 1 1. 5 Kitchen sink 0. 5 2 1 0 1 0. 5 0 1 1 1 Water closet, flush tank 1 1 1 7. 5 11. 5 15 Total WSFUs Converted to flow rate (might require interpolation)
The relationship between WSFU’s and gpm is not linear and, therefore, requires interpolation.
WSFU to gpm interpolation Table C: Conversion of WSFU’s to gpm Total WSFU’s = 15 Look below & above the actual WSFU of 15; which is 10 @ 8 gpm & 20 @ 14 gpm 3
Example – Step 1 Type of fixture or group Number of fixtures or groups Hot water (WSFU) Cold water (WSFU) Total (WSFU) Grp: Shower, lav, water closet - flush tank 2 4 7 8 Lavatory Dishwasher Clothes washer 1 2 1. 5 1 1. 5 Kitchen sink 0. 5 2 1 0 1 0. 5 0 1 1 1 Water closet, flush tank 1 1 1 7. 5 11. 5 15 Total WSFUs Converted to flow rate (might require interpolation) 6. 25 gpm 8. 90 gpm 11. 00 gpm
Questions? Thank you!