Use of WSR88 D radar data to evaluate


- Slides: 39

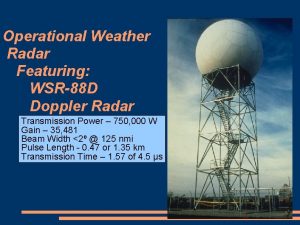
Use of WSR-88 D radar data to evaluate regional model forecasts Sandra Yuter North Carolina State University October 2005

Outline Comparison of 3 D radar and forecast model output n Mixed precipitation n Draft plan for observations in Carolinas n 2

Use of observations for model evaluation and diagnosis What structural characteristics of storms are most important to reproduce in numerical models? n What subset of characteristics can we most reliably observe? n How do we distinguish between details that are unique to an individual storm versus those that are repeated among a group of storms? n 3

Routine Daily comparison of observations to forecast model output n Directly comparable products derived from observations and model output yield objective measures of: Confidence in forecast model output for particular storm type n Model strengths and weaknesses n Evaluation of proposed model changes n Diagnosis of error sources n 4

What should the model/observations comparison products look like? 5

Model to Observation Comparison of Surface Rainfall 1 km cloud resolving model with explicit microphysics (ARPS) of Ft. Worth Texas storm for time=0 (Smedsmo et al, 2005) 6

Volumetric comparison for accumulated storm totals 7 Smedsmo et al. (2005)

Evaluation of Model Output must be 3 D! n Surface fields necessary but not sufficient for comparisons n Operational WSR-88 D radar can provide 3 D precipitation structure and wind field information Supplemental vertically-pointing radar can provide fine-scale information on freezing level and subgrid scale variability n 8

Prototype Concepts in Portland, Oregon Area 120 km radius from KRTX 9

METEK Inc. Radar in Scholls, OR Ku-band (1. 25 cm wavelength) Cost ~ $16 K Resolution 150 m Measurements of: n Doppler velocity n d. BZ- attenuates in moderate to heavy rain 10

Microphysical and Observational Context Fall velocity Radar reflectivity Snow Layer 0 C Melting Layer Rain Layer Vertically-pointing radar Ground Surface 11

UTC Time (hours) m/s Height (m) d. BZ Variable freezing level UTC Time (hours) 12

UTC Time (hours) m/s Height (m) d. BZ Variable freezing level UTC Time (hours) 13

UTC Time (hours) m/s Height (m) d. BZ Variable freezing level UTC Time (hours) 14

What sub area around radar can we use for comparisons? Radar Visibility: n Total n Partial n Blocked 15

Interpolate Polar Radar Data to Cartesian Coordinate System WSR-88 D Precip Scan • Spatial coordinates similar to model • Minimize range dependence of radar data 16

31 Dec - 1 Jan storm Wind Field (radial velocity) 1. 0 km altitude Freq. of Echo 13 d. BZ 17

31 Dec - 1 Jan storm Wind Field (radial velocity) 3. 0 km altitude Freq. of Echo 13 d. BZ 18

17 - 18 Jan 2005 storm Wind Field (radial velocity) 1. 0 km altitude Freq. of Echo 13 d. BZ 19

17 - 18 Jan 2005 storm Wind Field (radial velocity) 3. 0 km altitude Freq. of Echo 13 d. BZ 20

B. Colle MM 5 output Distance (km) WSR-88 D Observation Distance (km) 21

Findings Orography limits radar’s visibility, compare with model over subarea of domain n Interpolate radar data to Cartesian grid n minimize range dependence n common coordinate system with model n n Variable freezing level height in winter complicates use of quantitative d. BZ statistics 22

Suggested Observed 3 D Characteristics for Forecasts of Winter Storms to Reproduce From WSR-88 D: n Wind field pattern (radial velocity) n Precipitation frequency pattern From vertically-pointing radar n Freezing level altitude (location, time) 23

PARSIVEL disdrometer: simultaneously measures diameter and fall speed of particles Löffler-Mang and Joss (2000) 24

Mc. Kenzie Bridge, Oregon (494 m MSL) MKB Observation Locations Steamboat Springs, Colorado (3200 m MSL) SPL 25

MKB 17 December 2001 Rising Temperature: 2. 5 o. C to 5. 5 o. C Rain r g Lump graupel, Locatelli and Hobbs (1974) Log 10(# of particles) Fall Velocity (m/s) Rain, Berry and Pranger (1974) d Unrimed dendrites, Locatelli and Hobbs (1974) D (mm) 26

SPL 27 February 2003 Falling Temperature: -5 o. C to -10 o. C r g Log 10(# of particles) Fall Velocity (m/s) Dry Snow d D (mm) 27

MKB 19 December 2001 Steady Temperature: 0. 0 o. C r g Log 10(# of particles) Fall Velocity (m/s) Period C d D (mm) 28

MKB 18 -19 December 2001 Falling Temperature: 0. 5 o. C to 0. 0 o. C r g Log 10(# of particles) Fall Velocity (m/s) Period B d D (mm) 29

Precipitation Classification Fall Velocity (m/s) Rain r g Not Rain d Ambiguous D (mm) 30

MKB 18 -19 December 2001 r g Log 10(# of particles) Fall Velocity (m/s) Rain Subset d D (mm) 31

MKB 18 -19 December 2001 r g Log 10(# of particles) Fall Velocity (m/s) Not-Rain Subset d D (mm) 32

Relative proportions of rain subset of particles during mixed precipitation at Mc. Kenzie Bridge, OR. Air Temp 0°C 0. 5°C-0°C 1. 5°C 0. 5°C % rain particles of total conc (# m-3) 5% 23% % rain volume of total vol. 1% 4% Average rain rate (mm hr-1) 0. 09 1. 0 93% 74% 2. 3 Statistics are calculated for subset of particles with 1 mm ≤ D ≤ 10 mm. 33

34

North Carolina Planned New Observations n Initial Phase (Winter 2005 -2006) n n n Clayton DAQ site (Spring 2006) n n n Micro. Rain. Radar at Raleigh NWSFO Precip instrument test including PARSIVEL Micro. Rain. Radar PARSIVEL precip type Mt. Mitchell (Winter 2006) n n n Micro. Rain. Radar PARSIVEL precip type Snow measurement (hopefully) 35

Long Term Possibilities n NOAA Hydrometeorology Testbed (HMT) moves to Appalachians (~2010) Likely Tar River Basin n Many observation resources n Seasonal operations over several years n n Carolina Experiment (2015? ) in coordination with NOAA HMT intensive field phase 36

Archived Level 2 WSR-88 D data is being used for research! n Preferred VCPs for precip n VCP 11 – 14 elevation angles n VCP 21 – 9 elevation angles n VCPs to avoid n VCP 121 – smears rapidly moving storms n VCP 12 – faster antenna rotation degrades Vr and Z data 37

Cooperative studies n Important to Operations n Interesting for Basic Science n Practical n Able to make quality observations n High potential to make progress 38

The End 39
 Difference between pulse doppler radar and mti radar
 Pulse doppler radar vs mti
 Evaluate using synthetic substitution
 Synthetic substitution worksheet
 Ncdc radar data
 How you use ict today and how you will use it tomorrow
 Zero negative exponents
 Examples of internal forms of social control
 Trigonometry table
 Expression vs equation
 Cognitive psychology essay
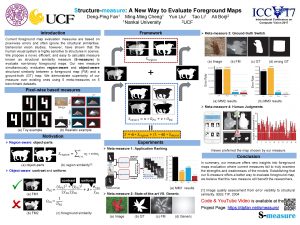
 Structure-measure: a new way to evaluate foreground maps
 Darley and gross 1983
 Evaluate
 Infix equation
 Engage explore explain elaborate evaluate
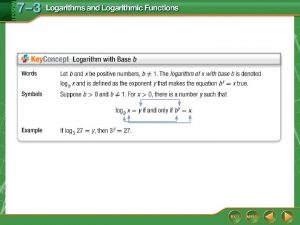
 How to write log in exponential form
 Engage explore explain elaborate evaluate
 Site:slidetodoc.com
 Evaluate 32 3/5
 Square roots
 Higher pe questions
 How to answer source based questions in history
 How to evaluate a function
 Simplify 64:24
 Evaluating logarithms practice
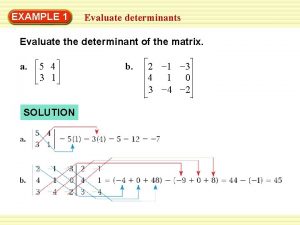
 Evaluate the determinant
 Evaluate the limit
 I can evaluate functions
 Evaluate the usefulness
 081-com-1001
 Synthetic substitution example
 Plan together in community mobilization
 Application of residue theorem to evaluate real integrals
 Application of residue theorem to evaluate real integrals
 Assure model lesson plan physical education
 How to express summation notation
 Evaluation of polynomial function
 How to evaluate the determinant of a matrix
 Function notation
