The East African Tea Trade Association The Uganda




- Slides: 42
The East African Tea Trade Association & The Uganda Tea Association, The Serena Hotel Kampala, Uganda 26 th – 28 th June, 2019.
Enhancing Tea Quality Standards Prof Philip Okinda Owuor, Ph. D, FKNAS, FAAS Department of Chemistry, Maseno University P. O. Box 333 – 40105 Maseno Kenya Email: pokindao@gmail. com or okindaowuor@maseno. ac. ke
Quality Definition • • In tea trade the definition of quality is ambiguous and shifts with roles of individuals in the business. Producers = tea whose sale leads to higher income. Tea traders = tea as that gives maximum profit Consumers = tea which can be obtained at reasonable price but has desirable taste, aroma, appearance and class.
Reality of Tea Prices • The prices of black tea are dictated by supply and demand, factors that usually have nothing to do with quality (Biswas; Biswas & Sarkar J. Sci. Food Agric, 22, 191 -198 (1971); Biswas; Sarkar; Biswas J. Sci. Food Agric. , 24, 1457 -1477. (1973)) • When supply is less than demand all teas are bought with less choice and prices tend to be higher than usual. • When supply is more than demand all tea is bought on basis of quality as defined by some chemical composition. • However, for sustainable tea business, consumer satisfaction is key
Need for Tea Standards • International standards are vital to facilitate international trade • To ensure consumer expectations are met • To provide guidance and common understanding of Good Manufacturing practices via compositional specifications • To provide validated methods of analysis
International Standards for Tea 1970’s - Tea Committee became ISO Working Group 8 - ISO Technical Committee 34 Sub-committee 8 – Tea 1977 - ISO 3720 Black tea standard 8 testing methods to measure basic tea parameters 1980 - ISO 1839 Sampling tea 1980 - ISO 3103 Preparation of liquor for sensory analysis 1982 - Glossary of terms 1990 - Instant tea standard 4 supporting test methods
ISO BLACK TEA SPECIFICATION - ISO 3720 1977 (First edition): The Quality Parameters Contents of caffeine and polyphenolic constituents are important chemical characteristics of black tea, (but not included in the specification) For caffeine agreement has not yet been reached on a standard method for the determination. For polyphenolic constituents, knowledge about test methods was not sufficiently developed to justify the standardization of any one of the methods in existence Also information on the contents of these constituents was only available for a few types of tea. 7
Measurements of Tea Caffeine and polyphenolic constituents Contents 1995 - Measurement of caffeine in tea and instant tea - Measurement of caffeine in tea, instant tea and decaffeinated tea 2005 – Measurement of total polyphenols in tea 2005 - Measurement of catechins in green and black tea 8
Minimum export standard In early 1980 s, UNCTAD commissioned a consultant to formulate Minimum Export Standard for black tea be adopted for use to regulate black tea trade. Purpose of standard To remove low quality and sub-standard black teas from the market. To improve the image of black tea as a beverage thereby, leading to increasing consumption And creating an upward surge in black tea prices for the benefit of the producers. The requirements of the Minimum Export Standard Minimum level of theaflavins in tea 8 µmoles/gm (dry weight) Crude fibre 16% Moisture content 6%
Towards Quality Black Tea Enhancing Quality Standard : i. Through Agronomic Practices ii. Optimising Processing Conditions iii. Managing Post processing quality deteriorations
Agronomic Practices 1. The condition of the leaf 2. Plucking standard 3. Uniformity of the leaf (Influence of pruning and leaf handling) 4. Origin (Geographical area of production) 5. Harvest date (Further away from the equator) 6. Cultivar 6. Management of pests and diseases
Optimising Processing Conditions 1. Tea maker 2. Processing i. Withering ii. Maceration iii. Fermentation iv. Drying v. Sorting
Managing Post Processing Quality Deteriorations i. iii. iv. v. Percentage of moisture remaining in the tea Colour Conservation of Aroma Taste Contamination
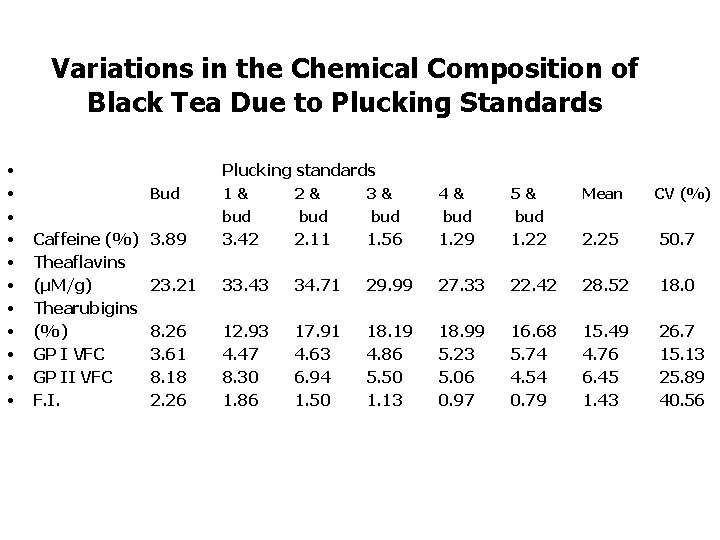
Variations in the Chemical Composition of Black Tea Due to Plucking Standards • • Plucking standards Bud 1 & 2 & 3 & 4 & 5 & bud bud 3. 89 3. 42 2. 11 1. 56 1. 29 23. 21 33. 43 34. 71 29. 99 8. 26 3. 61 8. 18 2. 26 12. 93 4. 47 8. 30 1. 86 17. 91 4. 63 6. 94 1. 50 18. 19 4. 86 5. 50 1. 13 • • • Caffeine (%) Theaflavins (μM/g) Thearubigins (%) GP I VFC GP II VFC F. I. Mean CV (%) 1. 22 2. 25 50. 7 27. 33 22. 42 28. 52 18. 0 18. 99 5. 23 5. 06 0. 97 16. 68 5. 74 4. 54 0. 79 15. 49 4. 76 6. 45 1. 43 26. 7 15. 13 25. 89 40. 56
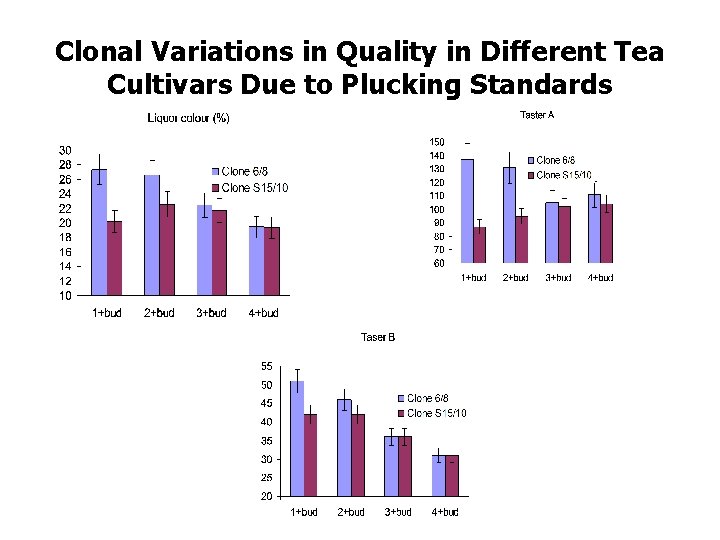
Clonal Variations in Quality in Different Tea Cultivars Due to Plucking Standards
Clonal Variations in Quality in Different Tea Cultivars Due to Plucking Standards
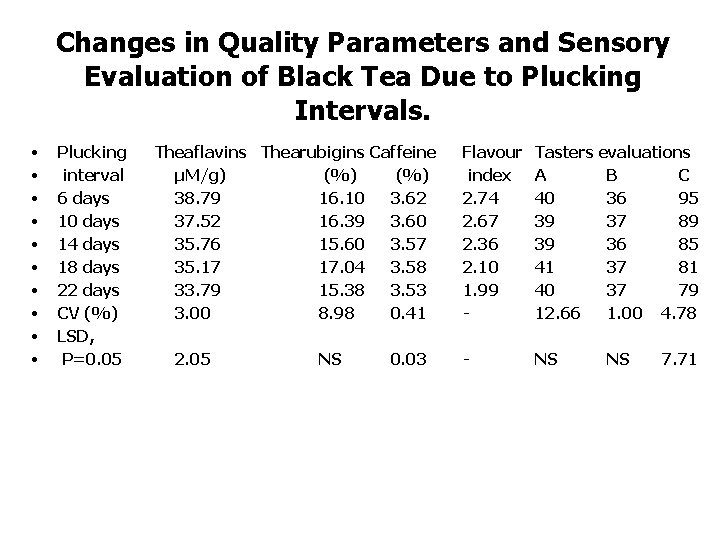
Changes in Quality Parameters and Sensory Evaluation of Black Tea Due to Plucking Intervals. • • • Plucking Theaflavins Thearubigins Caffeine interval μM/g) (%) 6 days 38. 79 16. 10 3. 62 10 days 37. 52 16. 39 3. 60 14 days 35. 76 15. 60 3. 57 18 days 35. 17 17. 04 3. 58 22 days 33. 79 15. 38 3. 53 CV (%) 3. 00 8. 98 0. 41 LSD, P=0. 05 2. 05 NS 0. 03 Flavour index 2. 74 2. 67 2. 36 2. 10 1. 99 - Tasters evaluations A B C 40 36 95 39 37 89 39 36 85 41 37 81 40 37 79 12. 66 1. 00 4. 78 - NS NS 7. 71
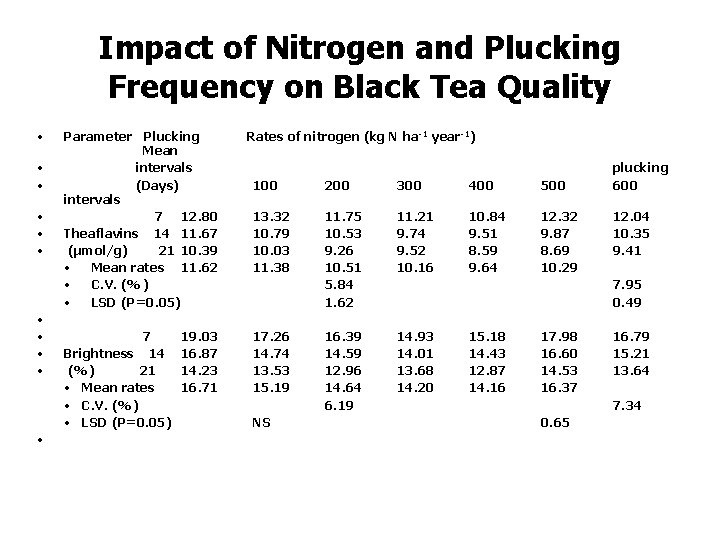
Impact of Nitrogen and Plucking Frequency on Black Tea Quality • • • Parameter Plucking Mean intervals (Days) intervals 7 12. 80 Theaflavins 14 11. 67 (μmol/g) 21 10. 39 • Mean rates 11. 62 • C. V. (%) • LSD (P=0. 05) 7 19. 03 Brightness 14 16. 87 (%) 21 14. 23 • Mean rates 16. 71 • C. V. (%) • LSD (P=0. 05) Rates of nitrogen (kg N ha-1 year-1) 100 200 300 400 500 13. 32 10. 79 10. 03 11. 38 11. 75 10. 53 9. 26 10. 51 5. 84 1. 62 11. 21 9. 74 9. 52 10. 16 10. 84 9. 51 8. 59 9. 64 12. 32 9. 87 8. 69 10. 29 16. 39 14. 59 12. 96 14. 64 6. 19 14. 93 14. 01 13. 68 14. 20 17. 26 14. 74 13. 53 15. 19 NS plucking 600 12. 04 10. 35 9. 41 7. 95 0. 49 15. 18 14. 43 12. 87 14. 16 17. 98 16. 60 14. 53 16. 37 16. 79 15. 21 13. 64 7. 34 0. 65
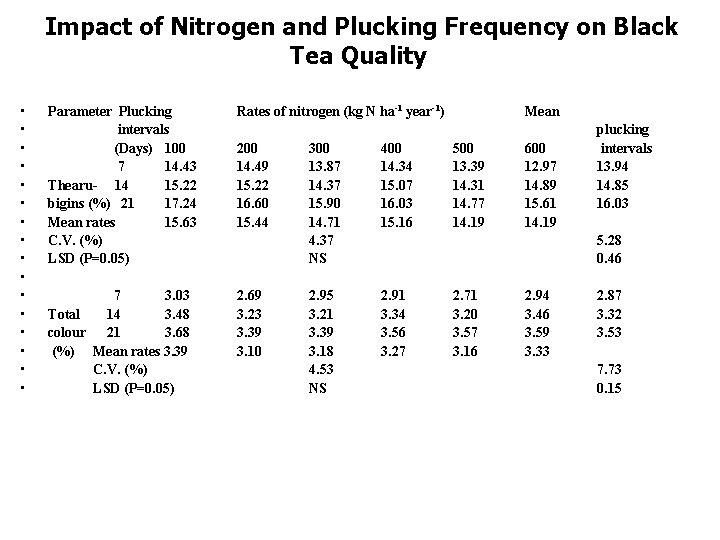
Impact of Nitrogen and Plucking Frequency on Black Tea Quality • • • • Parameter Plucking intervals (Days) 100 7 14. 43 Thearu- 14 15. 22 bigins (%) 21 17. 24 Mean rates 15. 63 C. V. (%) LSD (P=0. 05) 7 3. 03 Total 14 3. 48 colour 21 3. 68 (%) Mean rates 3. 39 C. V. (%) LSD (P=0. 05) Rates of nitrogen (kg N ha-1 year-1) 200 14. 49 15. 22 16. 60 15. 44 2. 69 3. 23 3. 39 3. 10 300 13. 87 14. 37 15. 90 14. 71 4. 37 NS 400 14. 34 15. 07 16. 03 15. 16 2. 95 3. 21 3. 39 3. 18 4. 53 NS 2. 91 3. 34 3. 56 3. 27 Mean 500 13. 39 14. 31 14. 77 14. 19 600 12. 97 14. 89 15. 61 14. 19 plucking intervals 13. 94 14. 85 16. 03 5. 28 0. 46 2. 71 3. 20 3. 57 3. 16 2. 94 3. 46 3. 59 3. 33 2. 87 3. 32 3. 53 7. 73 0. 15
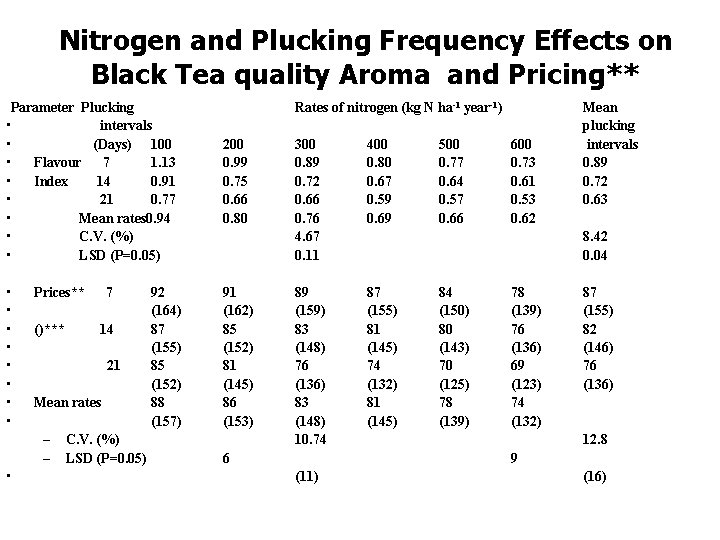
Nitrogen and Plucking Frequency Effects on Black Tea quality Aroma and Pricing** Parameter Plucking • intervals • (Days) 100 • Flavour 7 1. 13 • Index 14 0. 91 • 21 0. 77 • Mean rates 0. 94 • C. V. (%) • LSD (P=0. 05) 200 0. 99 0. 75 0. 66 0. 80 • • 91 (162) 85 (152) 81 (145) 86 (153) Prices** 7 ()*** 21 Mean rates – – • 14 C. V. (%) LSD (P=0. 05) 92 (164) 87 (155) 85 (152) 88 (157) Rates of nitrogen (kg N ha-1 year-1) 300 0. 89 0. 72 0. 66 0. 76 4. 67 0. 11 400 0. 80 0. 67 0. 59 0. 69 89 (159) 83 (148) 76 (136) 83 (148) 10. 74 87 (155) 81 (145) 74 (132) 81 (145) 6 500 0. 77 0. 64 0. 57 0. 66 600 0. 73 0. 61 0. 53 0. 62 Mean plucking intervals 0. 89 0. 72 0. 63 8. 42 0. 04 84 (150) 80 (143) 70 (125) 78 (139) 76 (136) 69 (123) 74 (132) 87 (155) 82 (146) 76 (136) 12. 8 9 (11) (16)
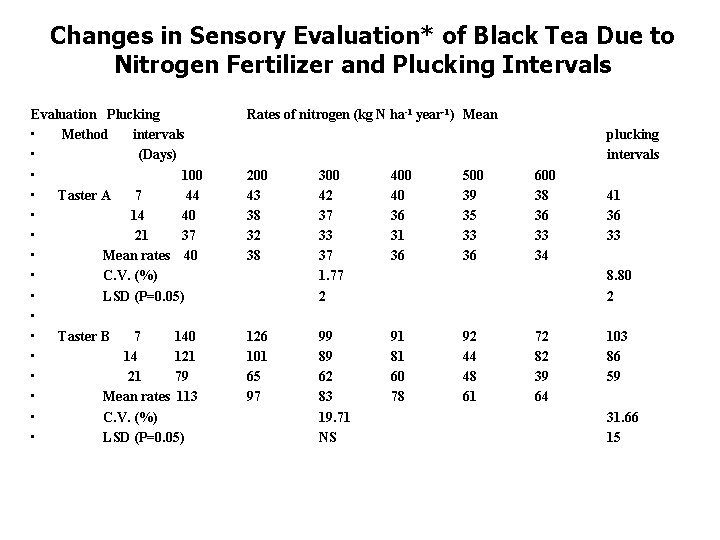
Changes in Sensory Evaluation* of Black Tea Due to Nitrogen Fertilizer and Plucking Intervals Evaluation Plucking • Method intervals • (Days) • 100 • Taster A 7 44 • 14 40 • 21 37 • Mean rates 40 • C. V. (%) • LSD (P=0. 05) • • Taster B 7 140 • 14 121 • 21 79 • Mean rates 113 • C. V. (%) • LSD (P=0. 05) Rates of nitrogen (kg N ha-1 year-1) Mean 200 43 38 32 38 126 101 65 97 300 42 37 33 37 1. 77 2 400 40 36 31 36 99 89 62 83 19. 71 NS 91 81 60 78 500 39 35 33 36 600 38 36 33 34 plucking intervals 41 36 33 8. 80 2 92 44 48 61 72 82 39 64 103 86 59 31. 66 15
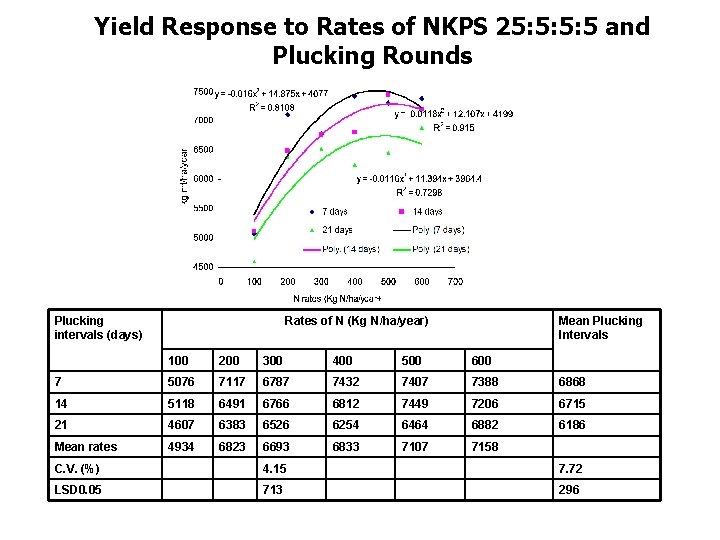
Yield Response to Rates of NKPS 25: 5: 5: 5 and Plucking Rounds Plucking intervals (days) Rates of N (Kg N/ha/year) Mean Plucking Intervals 100 200 300 400 500 600 7 5076 7117 6787 7432 7407 7388 6868 14 5118 6491 6766 6812 7449 7206 6715 21 4607 6383 6526 6254 6464 6882 6186 Mean rates 4934 6823 6693 6833 7107 7158 C. V. (%) 4. 15 7. 72 LSD 0. 05 713 296
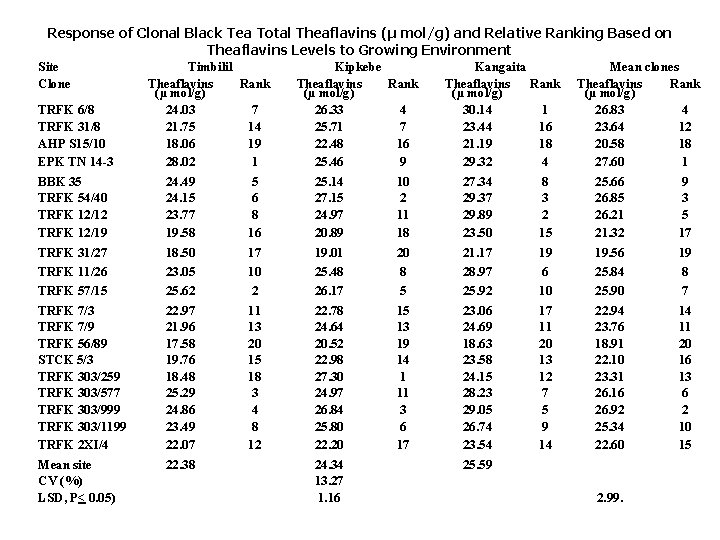
Response of Clonal Black Tea Total Theaflavins (µ mol/g) and Relative Ranking Based on Theaflavins Levels to Growing Environment Site Clone TRFK 6/8 TRFK 31/8 AHP S 15/10 EPK TN 14 -3 BBK 35 TRFK 54/40 TRFK 12/12 TRFK 12/19 TRFK 31/27 TRFK 11/26 TRFK 57/15 TRFK 7/3 TRFK 7/9 TRFK 56/89 STCK 5/3 TRFK 303/259 TRFK 303/577 TRFK 303/999 TRFK 303/1199 TRFK 2 XI/4 Mean site CV (%) LSD, P< 0. 05) Timbilil Theaflavins Rank (µ mol/g) 24. 03 7 21. 75 14 18. 06 19 28. 02 1 24. 49 5 24. 15 6 23. 77 8 19. 58 16 18. 50 17 23. 05 10 25. 62 2 22. 97 11 21. 96 13 17. 58 20 19. 76 15 18. 48 18 25. 29 3 24. 86 4 23. 49 8 22. 07 12 22. 38 Kipkebe Theaflavins Rank (µ mol/g) 26. 33 4 25. 71 7 22. 48 16 25. 46 9 25. 14 10 27. 15 2 24. 97 11 20. 89 18 19. 01 20 25. 48 8 26. 17 5 22. 78 15 24. 64 13 20. 52 19 22. 98 14 27. 30 1 24. 97 11 26. 84 3 25. 80 6 22. 20 17 24. 34 13. 27 1. 16 Kangaita Theaflavins Rank (µ mol/g) 30. 14 1 23. 44 16 21. 19 18 29. 32 4 27. 34 8 29. 37 3 29. 89 2 23. 50 15 21. 17 19 28. 97 6 25. 92 10 23. 06 17 24. 69 11 18. 63 20 23. 58 13 24. 15 12 28. 23 7 29. 05 5 26. 74 9 23. 54 14 25. 59 Mean clones Theaflavins Rank (µ mol/g) 26. 83 4 23. 64 12 20. 58 18 27. 60 1 25. 66 9 26. 85 3 26. 21 5 21. 32 17 19. 56 19 25. 84 8 25. 90 7 22. 94 14 23. 76 11 18. 91 20 22. 10 16 23. 31 13 26. 16 6 26. 92 2 25. 34 10 22. 60 15 2. 99.
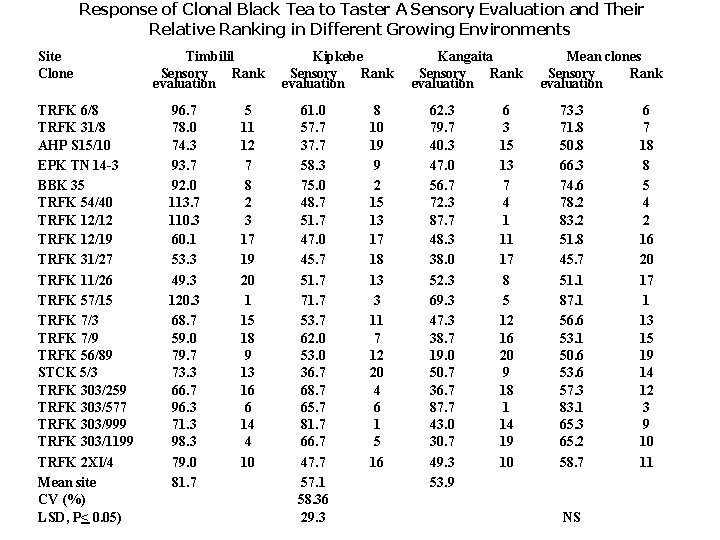
Response of Clonal Black Tea to Taster A Sensory Evaluation and Their Relative Ranking in Different Growing Environments Site Clone TRFK 6/8 TRFK 31/8 AHP S 15/10 EPK TN 14 -3 BBK 35 TRFK 54/40 TRFK 12/12 TRFK 12/19 TRFK 31/27 TRFK 11/26 TRFK 57/15 TRFK 7/3 TRFK 7/9 TRFK 56/89 STCK 5/3 TRFK 303/259 TRFK 303/577 TRFK 303/999 TRFK 303/1199 TRFK 2 XI/4 Mean site CV (%) LSD, P< 0. 05) Timbilil Sensory Rank evaluation 96. 7 78. 0 74. 3 93. 7 92. 0 113. 7 110. 3 60. 1 53. 3 49. 3 120. 3 68. 7 59. 0 79. 7 73. 3 66. 7 96. 3 71. 3 98. 3 79. 0 81. 7 5 11 12 7 8 2 3 17 19 20 1 15 18 9 13 16 6 14 4 10 Kipkebe Sensory Rank evaluation 61. 0 57. 7 37. 7 58. 3 75. 0 48. 7 51. 7 47. 0 45. 7 51. 7 71. 7 53. 7 62. 0 53. 0 36. 7 68. 7 65. 7 81. 7 66. 7 47. 7 57. 1 58. 36 29. 3 8 10 19 9 2 15 13 17 18 13 3 11 7 12 20 4 6 1 5 16 Kangaita Sensory Rank evaluation 62. 3 79. 7 40. 3 47. 0 56. 7 72. 3 87. 7 48. 3 38. 0 52. 3 69. 3 47. 3 38. 7 19. 0 50. 7 36. 7 87. 7 43. 0 30. 7 49. 3 53. 9 6 3 15 13 7 4 1 11 17 8 5 12 16 20 9 18 1 14 19 10 Mean clones Sensory Rank evaluation 73. 3 71. 8 50. 8 66. 3 74. 6 78. 2 83. 2 51. 8 45. 7 51. 1 87. 1 56. 6 53. 1 50. 6 53. 6 57. 3 83. 1 65. 3 65. 2 58. 7 NS 6 7 18 8 5 4 2 16 20 17 1 13 15 19 14 12 3 9 10 11
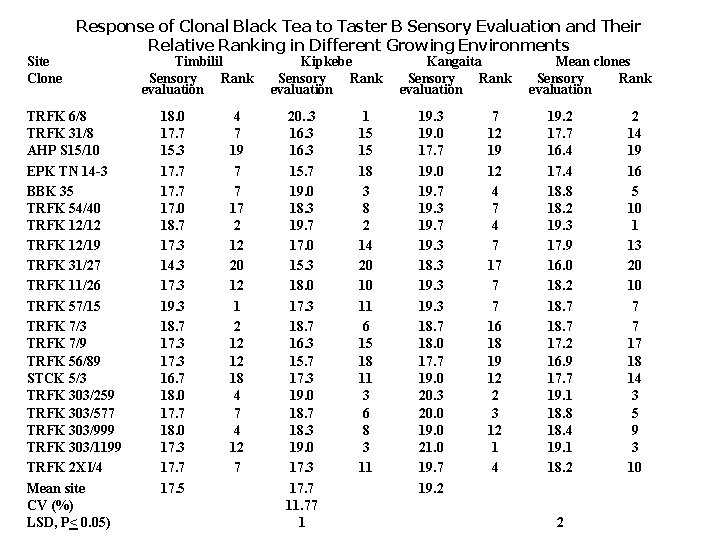
Site Clone Response of Clonal Black Tea to Taster B Sensory Evaluation and Their Relative Ranking in Different Growing Environments TRFK 6/8 TRFK 31/8 AHP S 15/10 EPK TN 14 -3 BBK 35 TRFK 54/40 TRFK 12/12 TRFK 12/19 TRFK 31/27 TRFK 11/26 TRFK 57/15 TRFK 7/3 TRFK 7/9 TRFK 56/89 STCK 5/3 TRFK 303/259 TRFK 303/577 TRFK 303/999 TRFK 303/1199 TRFK 2 XI/4 Mean site CV (%) LSD, P< 0. 05) Timbilil Sensory Rank evaluation 18. 0 17. 7 15. 3 17. 7 17. 0 18. 7 17. 3 14. 3 17. 3 19. 3 18. 7 17. 3 16. 7 18. 0 17. 3 17. 7 17. 5 4 7 19 7 7 17 2 12 20 12 1 2 12 12 18 4 7 4 12 7 Kipkebe Sensory Rank evaluation 20. . 3 16. 3 15. 7 19. 0 18. 3 19. 7 17. 0 15. 3 18. 0 17. 3 18. 7 16. 3 15. 7 17. 3 19. 0 18. 7 18. 3 19. 0 17. 3 17. 7 11. 77 1 1 15 15 18 3 8 2 14 20 10 11 6 15 18 11 3 6 8 3 11 Kangaita Sensory Rank evaluation 19. 3 19. 0 17. 7 19. 0 19. 7 19. 3 18. 3 19. 3 18. 7 18. 0 17. 7 19. 0 20. 3 20. 0 19. 0 21. 0 19. 7 19. 2 7 12 19 12 4 7 17 7 7 16 18 19 12 2 3 12 1 4 Mean clones Sensory Rank evaluation 19. 2 17. 7 16. 4 17. 4 18. 8 18. 2 19. 3 17. 9 16. 0 18. 2 18. 7 17. 2 16. 9 17. 7 19. 1 18. 8 18. 4 19. 1 18. 2 2 2 14 19 16 5 10 1 13 20 10 7 7 17 18 14 3 5 9 3 10
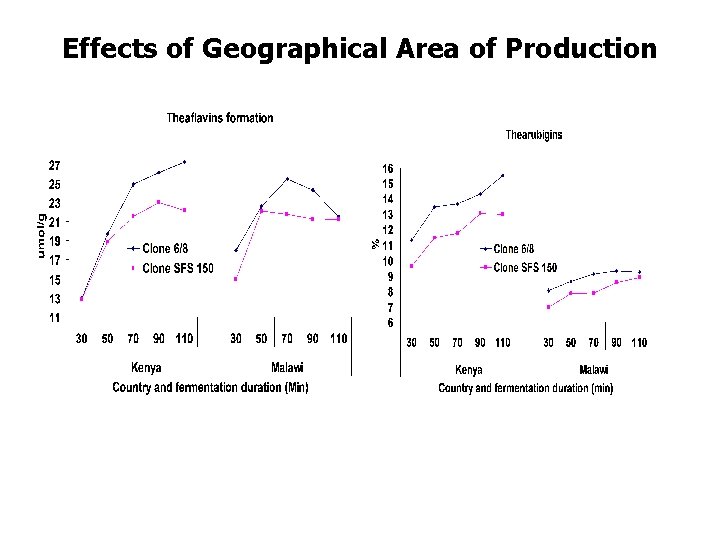
Effects of Geographical Area of Production
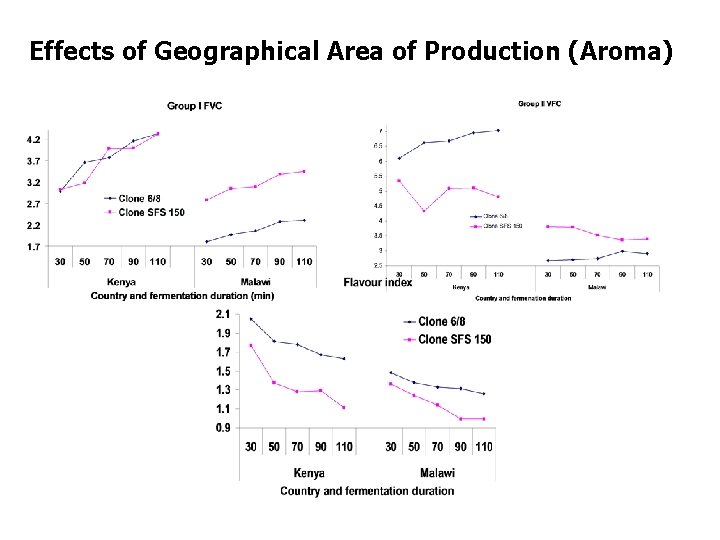
Effects of Geographical Area of Production (Aroma)
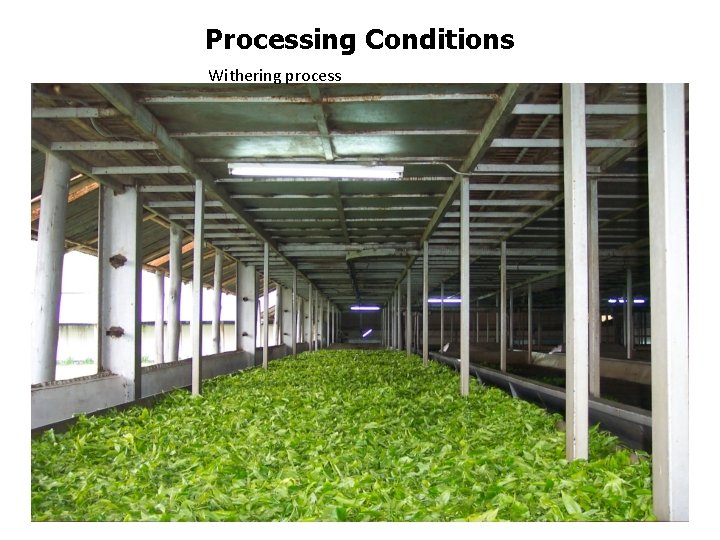
Processing Conditions Withering process
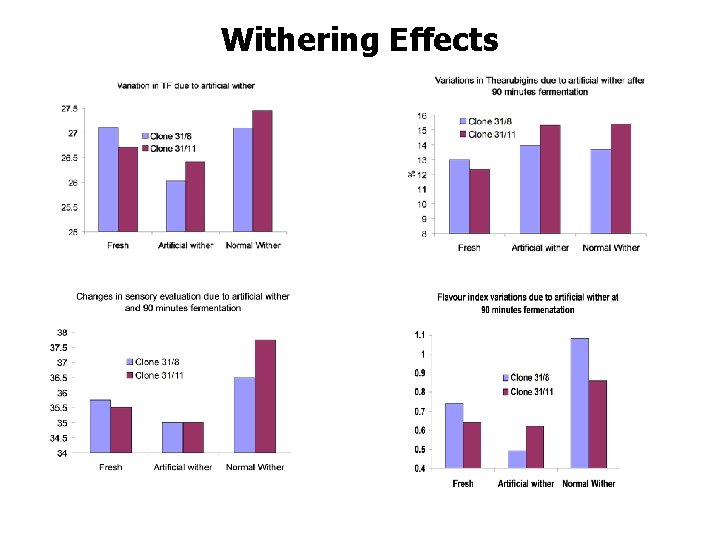
Withering Effects
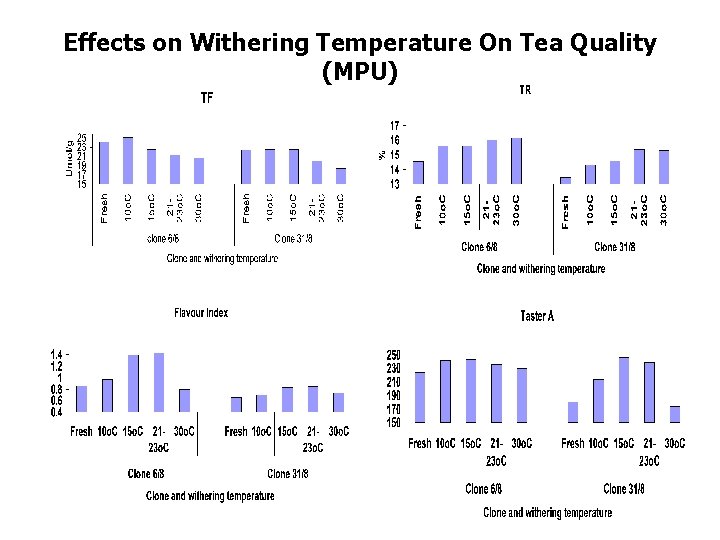
Effects on Withering Temperature On Tea Quality (MPU)
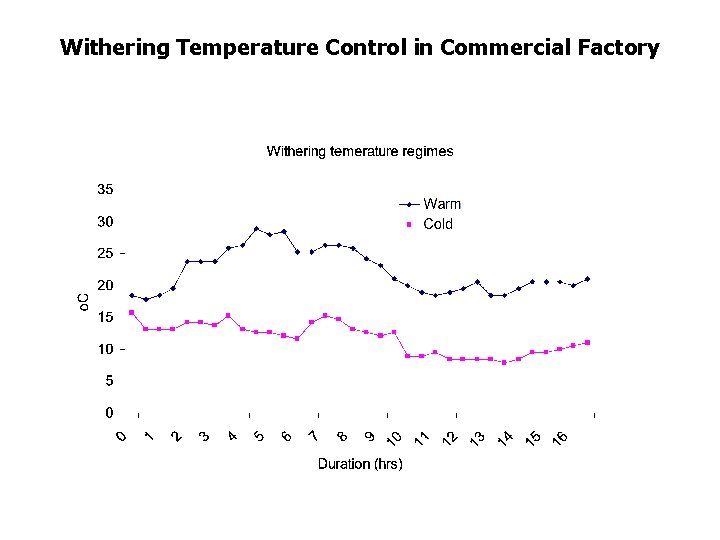
Withering Temperature Control in Commercial Factory
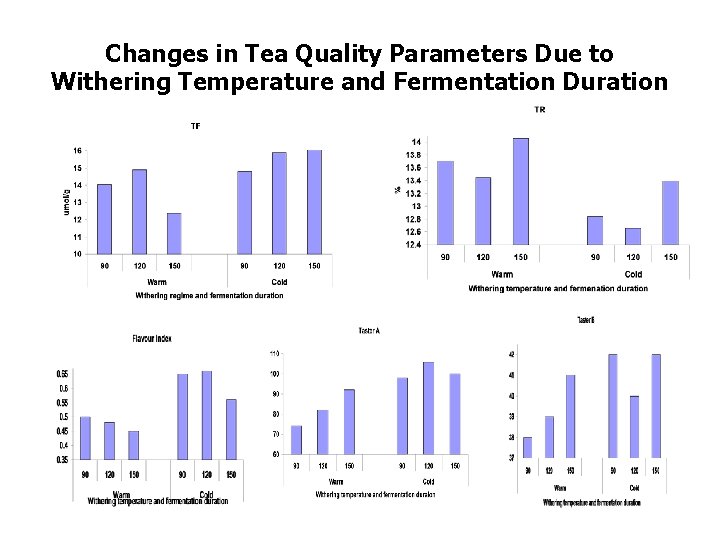
Changes in Tea Quality Parameters Due to Withering Temperature and Fermentation Duration
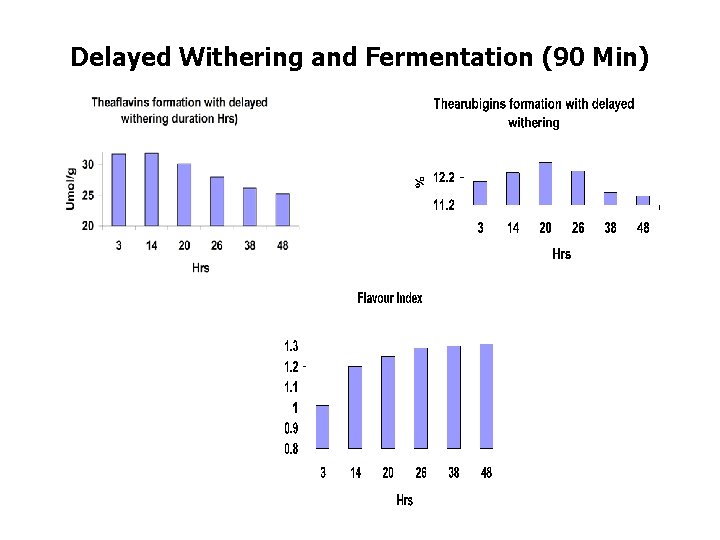
Delayed Withering and Fermentation (90 Min)
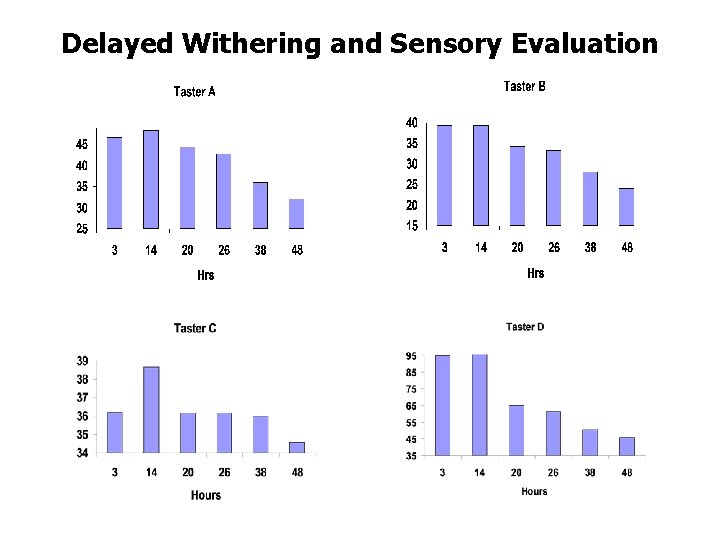
Delayed Withering and Sensory Evaluation
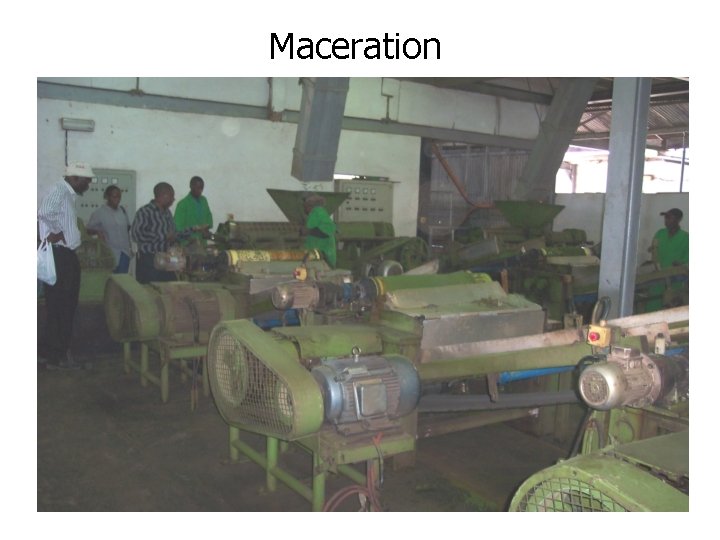
Maceration
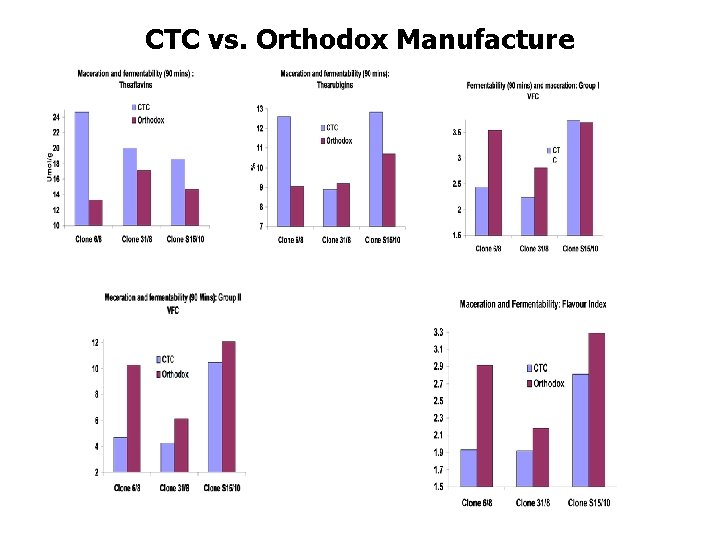
CTC vs. Orthodox Manufacture
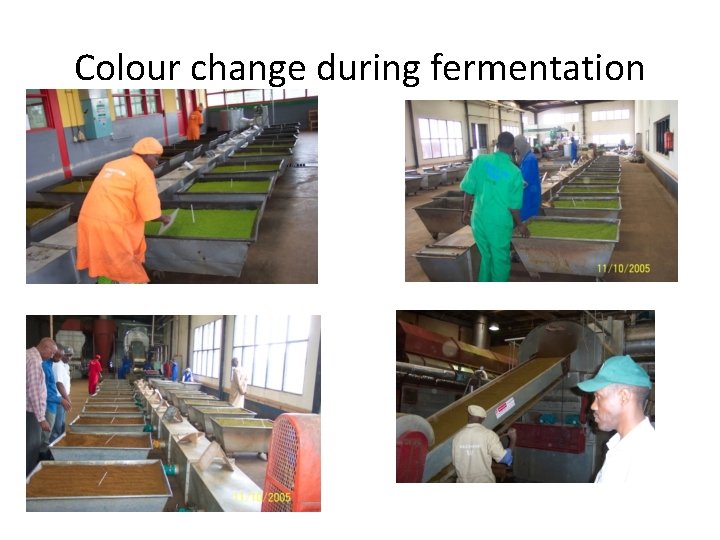
Colour change during fermentation
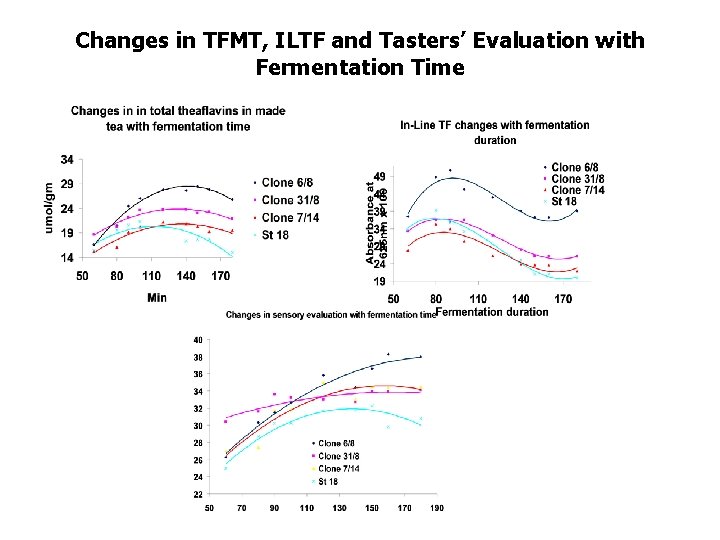
Changes in TFMT, ILTF and Tasters’ Evaluation with Fermentation Time
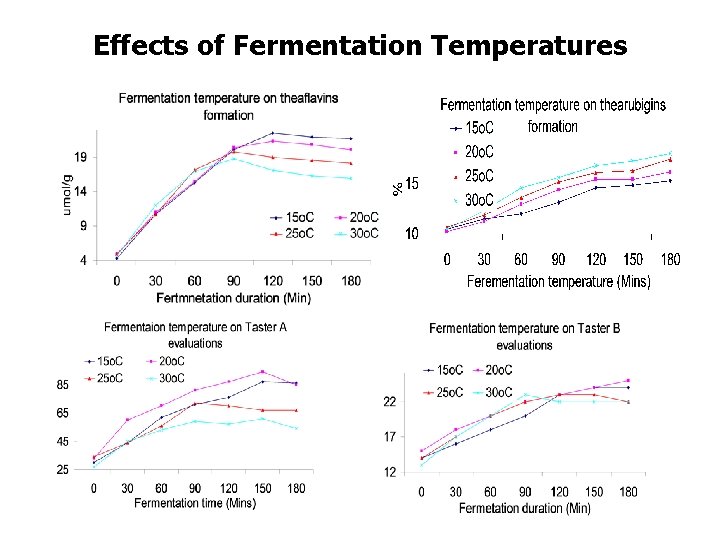
Effects of Fermentation Temperatures
Conclusion Enhance Tea Quality Standard: i. Agronomic and Cultural Practices ii. Optimising Processing Conditions iii. Managing Post processing quality deteriorations
ACKNOWLEDGEMENT The Organisers of the 4 th African Tea Convention and Exhibition for the Invitation THANK YOU