
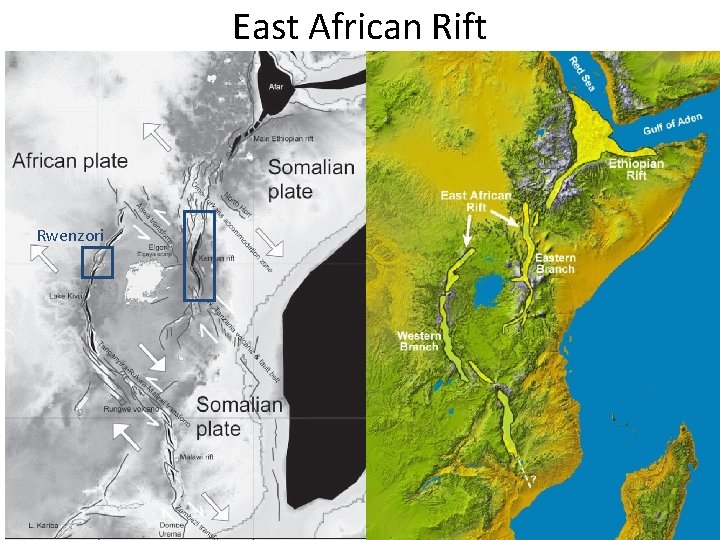
East African Rift Rwenzori Whats TorresAcosta et al

- Slides: 18
East African Rift Rwenzori
What’s Torres-Acosta et al. objective? How can we relate last week’s paper to this Torres-Acosta et al. ’s paper?
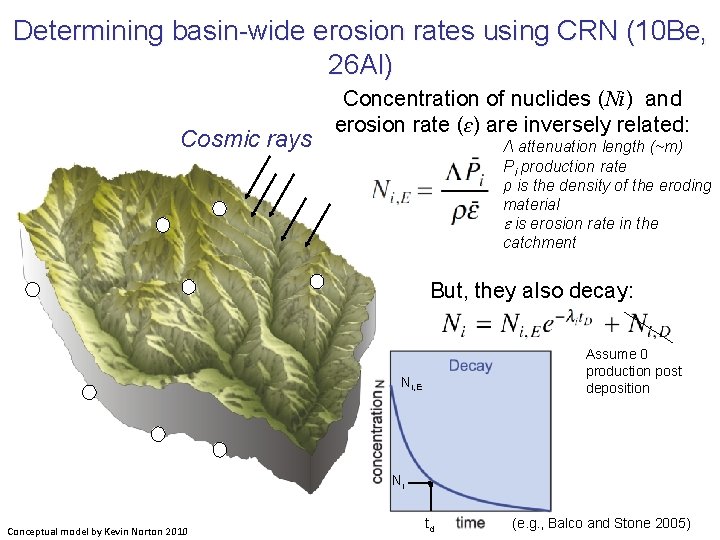
Determining basin-wide erosion rates using CRN (10 Be, 26 Al) Cosmic rays Concentration of nuclides (Ni) and erosion rate (ɛ) are inversely related: Λ attenuation length (~m) Pi production rate ρ is the density of the eroding material e is erosion rate in the catchment But, they also decay: Assume 0 production post deposition Ni, E Ni Conceptual model by Kevin Norton 2010 td (e. g. , Balco and Stone 2005)
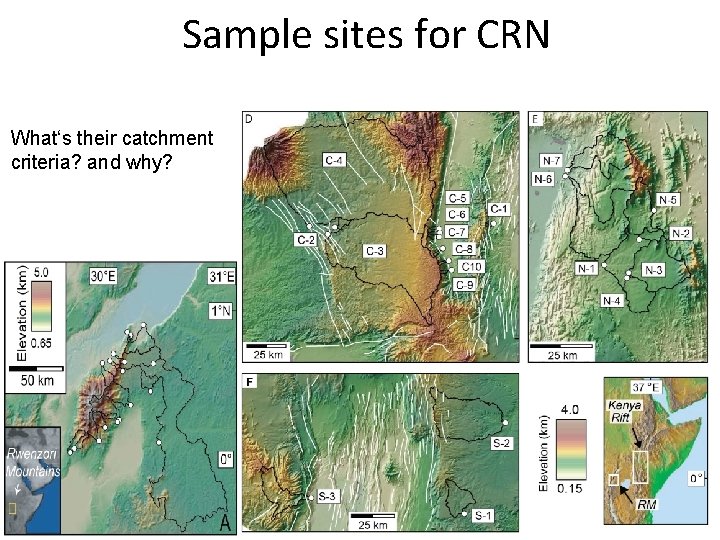
Sample sites for CRN What‘s their catchment criteria? and why?
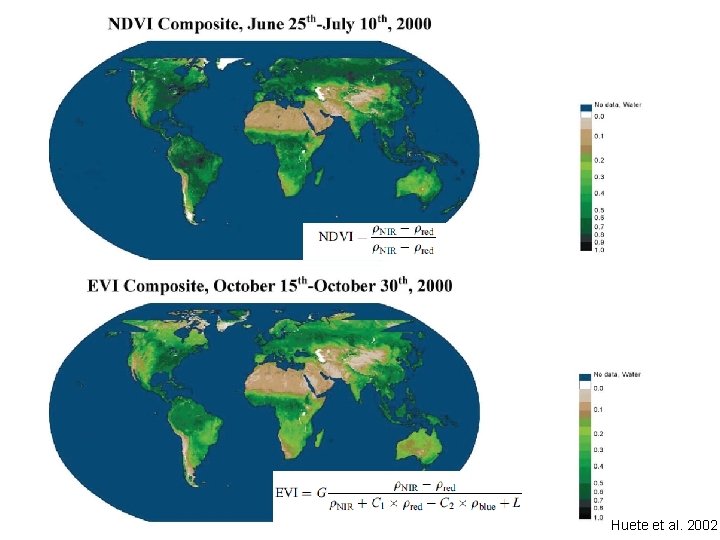
Methods • Erosion rate: – CRN-10 Be • Vegetation: – Enhance Vegetation Index (EVI) – Vegetation Continuous Field (VCF) – What are the differences between the two data sets?
Huete et al. 2002
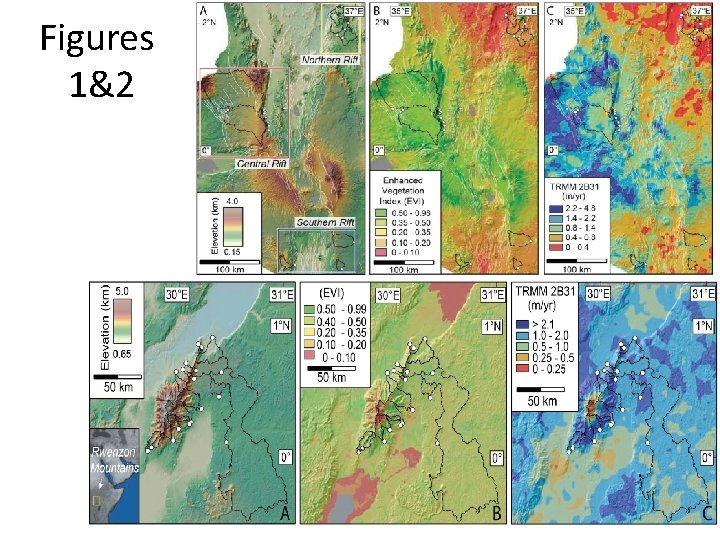
Figures 1&2
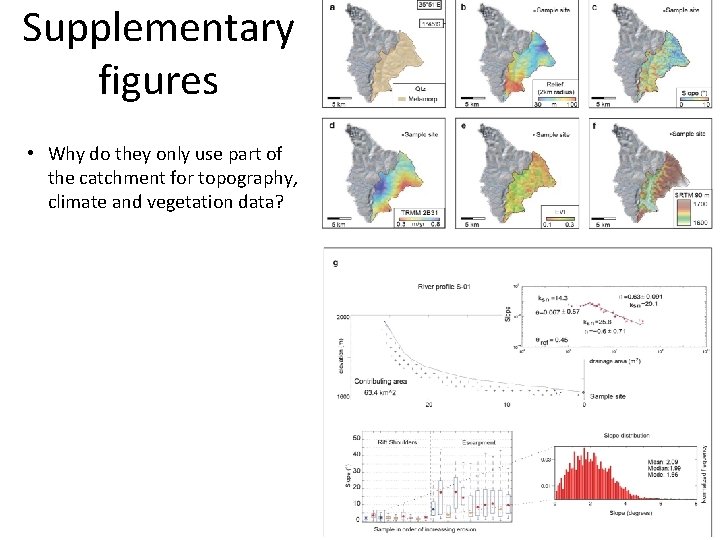
Supplementary figures • Why do they only use part of the catchment for topography, climate and vegetation data?
Methods • Erosion rate: – CRN-10 Be • Vegetation: – Enhance Vegetation Index (EVI) – Vegetation Continuous Field (VCF) • What is the issue about comparing the denudation rates with vegetation data?
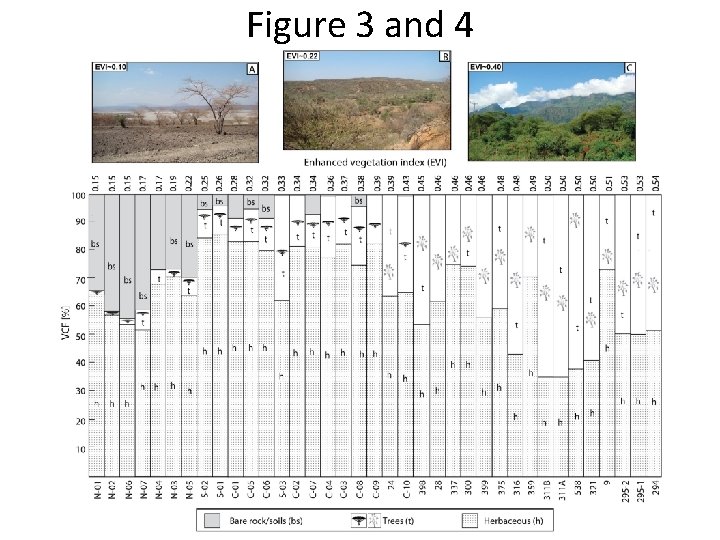
Figure 3 and 4
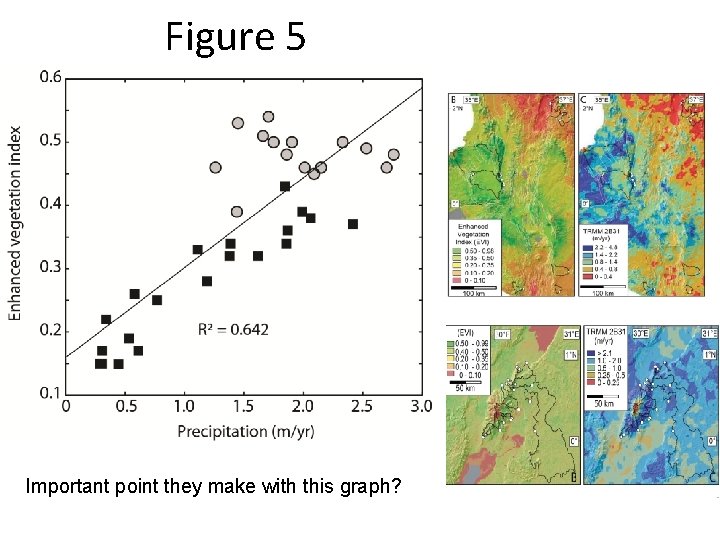
Figure 5 Important point they make with this graph?
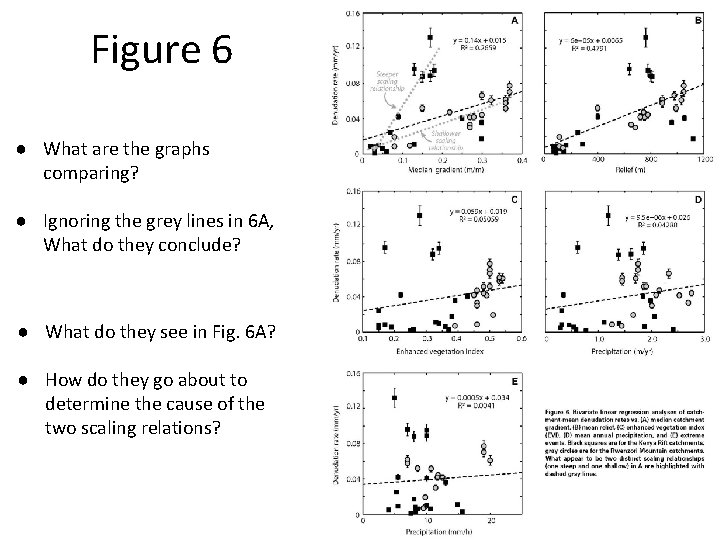
Figure 6 ● What are the graphs comparing? ● Ignoring the grey lines in 6 A, What do they conclude? ● What do they see in Fig. 6 A? ● How do they go about to determine the cause of the two scaling relations?
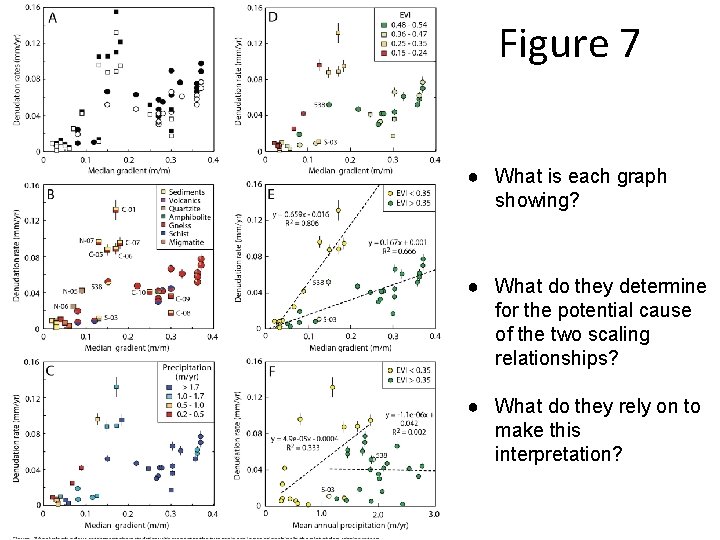
Figure 7 ● What is each graph showing? ● What do they determine for the potential cause of the two scaling relationships? ● What do they rely on to make this interpretation?
Changing climate conditions - time scale integration • How to they account for the fact that the modern vegetation does not capture the time-integrated effects of vegetation changes? • How do they connect denudation rates with vegetation changes? • Is vegetation cover an important factor in denudation rate?
Concluding comments? Do you agree with their conclusion?
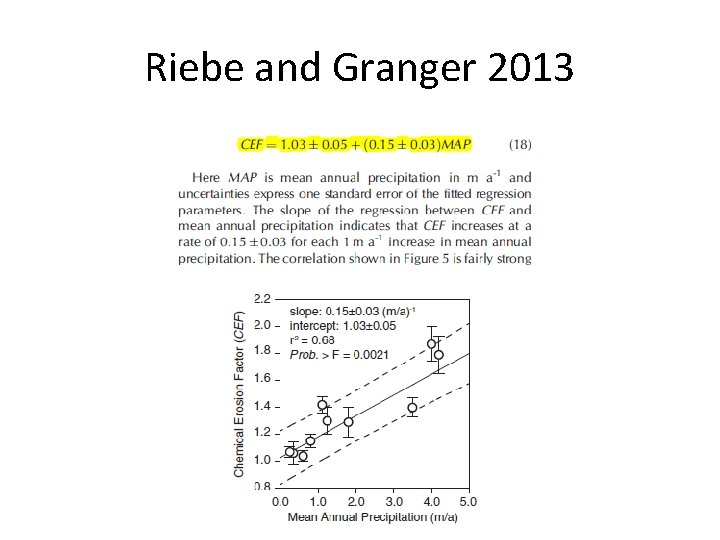
Riebe and Granger 2013