
Approaches to service delivery and the implications for
- Slides: 17
Approaches to service delivery and the implications for public administration Dr. Vincent Bagambe (Mo. H-Global Fund, Uganda) 1
Presentation Overview Ø Global Statistics on HIV Ø Burden of HIV in Uganda Ø Drivers of the epidemic Ø Goals & Strategies for HIV Response Ø Achievements/response to the epidemic Ø Challenges Ø Priorities for the period 2015 -2025 2
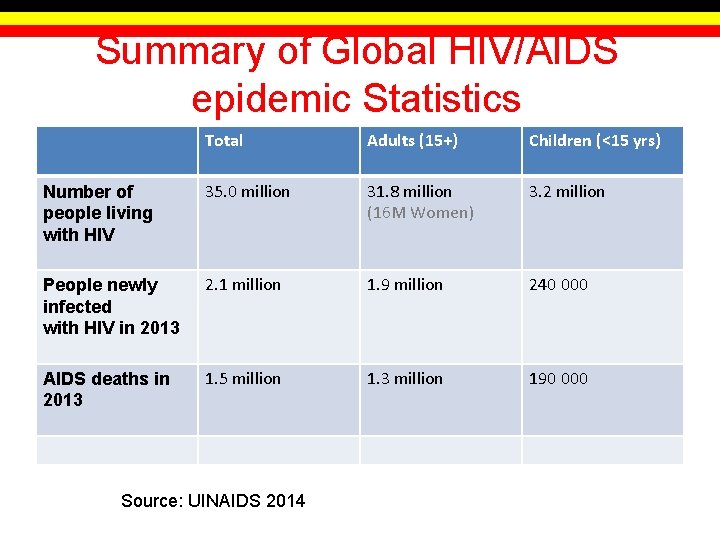
Summary of Global HIV/AIDS epidemic Statistics Total Adults (15+) Children (<15 yrs) Number of people living with HIV 35. 0 million 31. 8 million (16 M Women) 3. 2 million People newly infected with HIV in 2013 2. 1 million 1. 9 million 240 000 AIDS deaths in 2013 1. 5 million 1. 3 million 190 000 Source: UINAIDS 2014
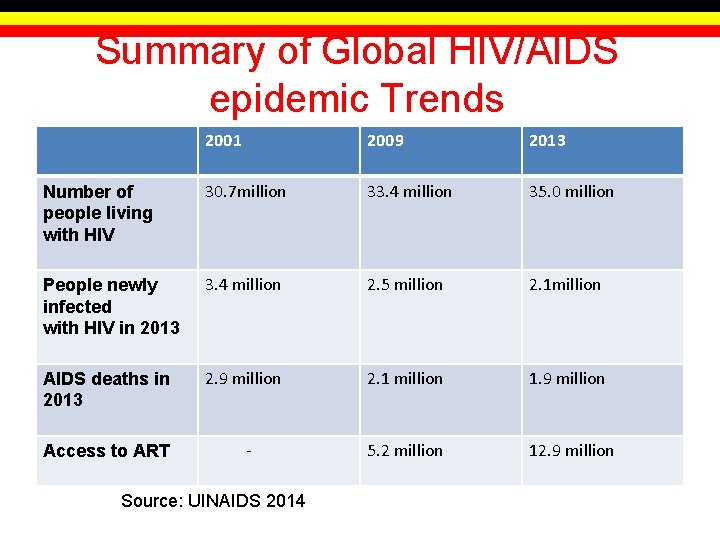
Summary of Global HIV/AIDS epidemic Trends 2001 2009 2013 Number of people living with HIV 30. 7 million 33. 4 million 35. 0 million People newly infected with HIV in 2013 3. 4 million 2. 5 million 2. 1 million AIDS deaths in 2013 2. 9 million 2. 1 million 1. 9 million Access to ART - 5. 2 million 12. 9 million Source: UINAIDS 2014
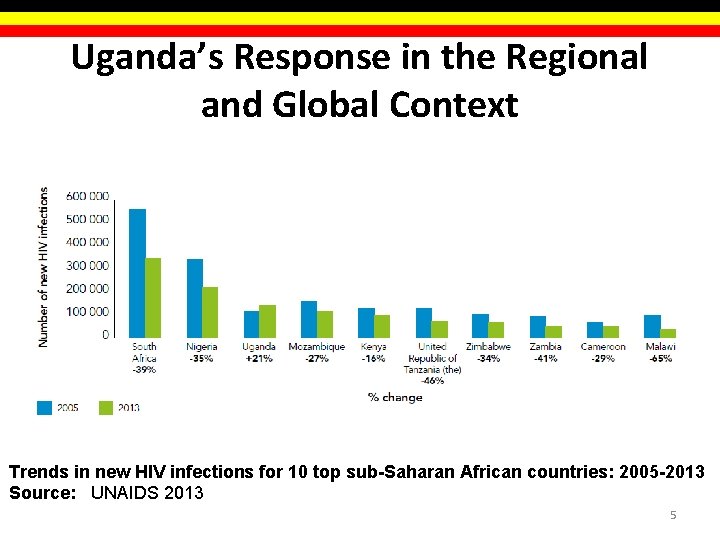
Uganda’s Response in the Regional and Global Context Trends in new HIV infections for 10 top sub-Saharan African countries: 2005 -2013 Source: UNAIDS 2013 5
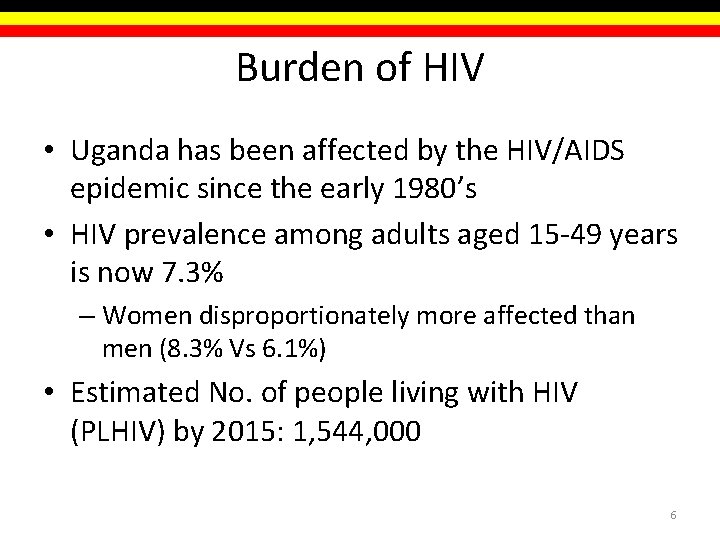
Burden of HIV • Uganda has been affected by the HIV/AIDS epidemic since the early 1980’s • HIV prevalence among adults aged 15 -49 years is now 7. 3% – Women disproportionately more affected than men (8. 3% Vs 6. 1%) • Estimated No. of people living with HIV (PLHIV) by 2015: 1, 544, 000 6
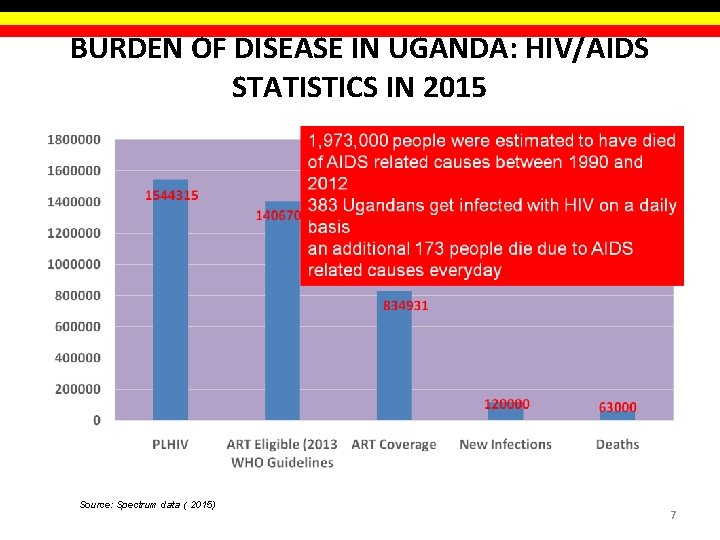
BURDEN OF DISEASE IN UGANDA: HIV/AIDS STATISTICS IN 2015 Source: Spectrum data ( 2015) 7
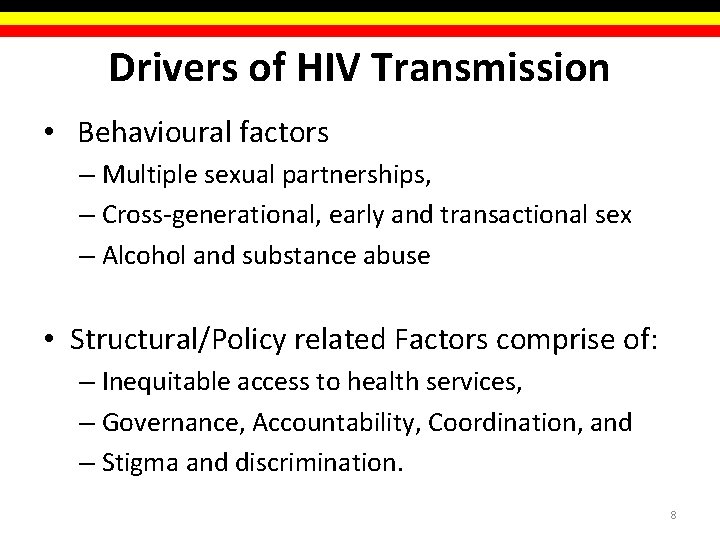
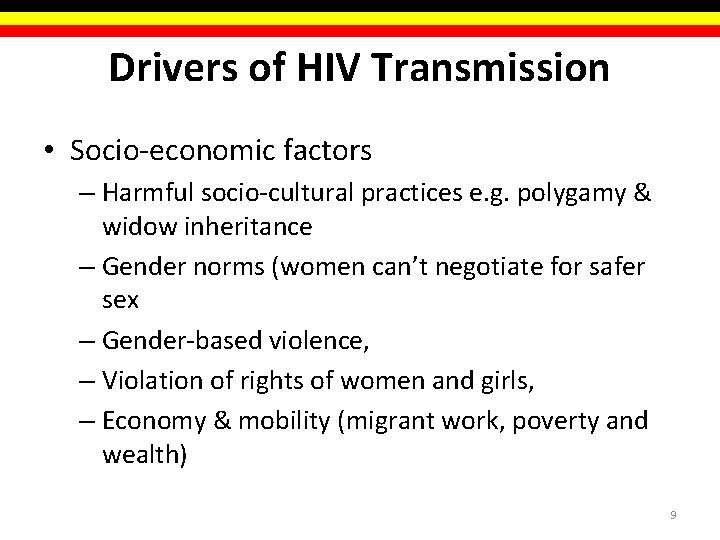
Drivers of HIV Transmission • Behavioural factors – Multiple sexual partnerships, – Cross-generational, early and transactional sex – Alcohol and substance abuse • Structural/Policy related Factors comprise of: – Inequitable access to health services, – Governance, Accountability, Coordination, and – Stigma and discrimination. 8
Drivers of HIV Transmission • Socio-economic factors – Harmful socio-cultural practices e. g. polygamy & widow inheritance – Gender norms (women can’t negotiate for safer sex – Gender-based violence, – Violation of rights of women and girls, – Economy & mobility (migrant work, poverty and wealth) 9
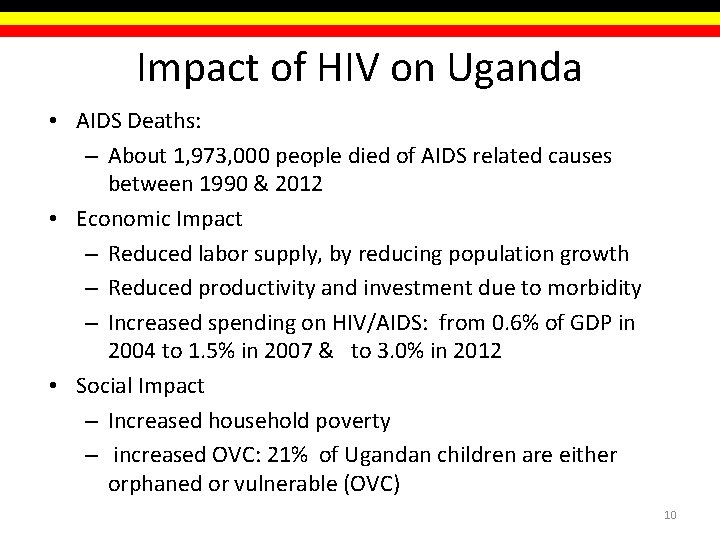
Impact of HIV on Uganda • AIDS Deaths: – About 1, 973, 000 people died of AIDS related causes between 1990 & 2012 • Economic Impact – Reduced labor supply, by reducing population growth – Reduced productivity and investment due to morbidity – Increased spending on HIV/AIDS: from 0. 6% of GDP in 2004 to 1. 5% in 2007 & to 3. 0% in 2012 • Social Impact – Increased household poverty – increased OVC: 21% of Ugandan children are either orphaned or vulnerable (OVC) 10
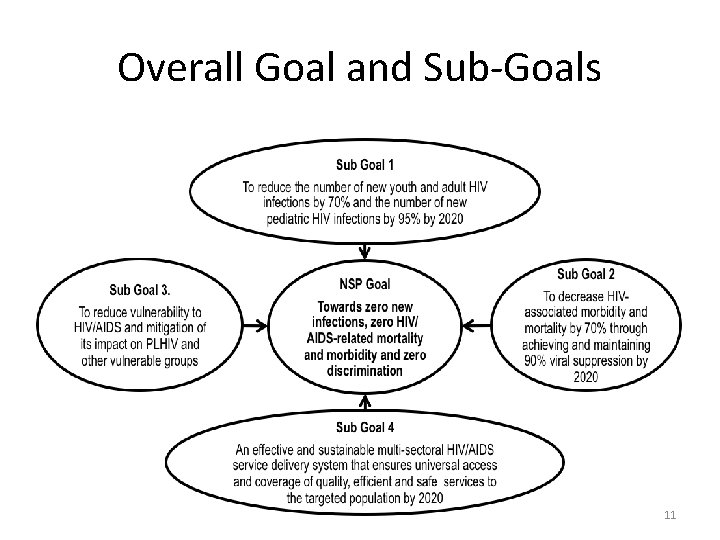
Overall Goal and Sub-Goals 11
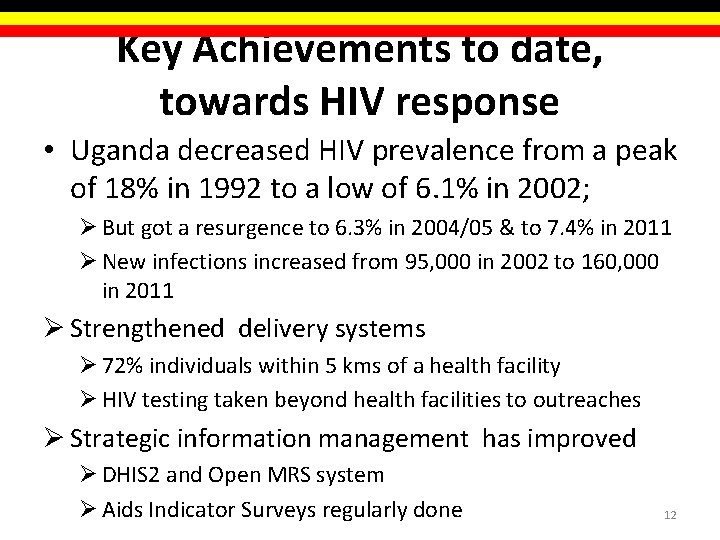
Key Achievements to date, towards HIV response • Uganda decreased HIV prevalence from a peak of 18% in 1992 to a low of 6. 1% in 2002; Ø But got a resurgence to 6. 3% in 2004/05 & to 7. 4% in 2011 Ø New infections increased from 95, 000 in 2002 to 160, 000 in 2011 Ø Strengthened delivery systems Ø 72% individuals within 5 kms of a health facility Ø HIV testing taken beyond health facilities to outreaches Ø Strategic information management has improved Ø DHIS 2 and Open MRS system Ø Aids Indicator Surveys regularly done 12
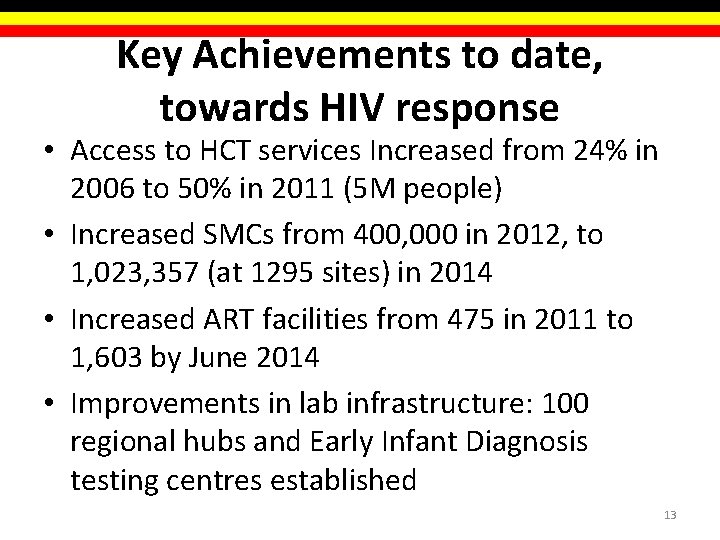
Key Achievements to date, towards HIV response • Access to HCT services Increased from 24% in 2006 to 50% in 2011 (5 M people) • Increased SMCs from 400, 000 in 2012, to 1, 023, 357 (at 1295 sites) in 2014 • Increased ART facilities from 475 in 2011 to 1, 603 by June 2014 • Improvements in lab infrastructure: 100 regional hubs and Early Infant Diagnosis testing centres established 13
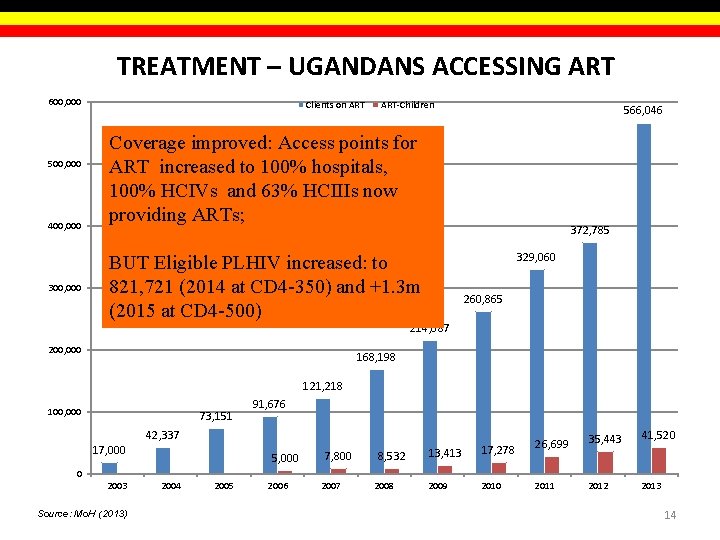
TREATMENT – UGANDANS ACCESSING ART 600, 000 500, 000 400, 000 300, 000 Clients on ART-Children 566, 046 Coverage improved: Access points for ART increased to 100% hospitals, 100% HCIVs and 63% HCIIIs now providing ARTs; 372, 785 329, 060 BUT Eligible PLHIV increased: to 821, 721 (2014 at CD 4 -350) and +1. 3 m (2015 at CD 4 -500) 260, 865 214, 087 200, 000 168, 198 121, 218 100, 000 73, 151 91, 676 42, 337 17, 000 5, 000 7, 800 8, 532 13, 413 17, 278 2009 2010 26, 699 35, 443 41, 520 2012 2013 0 2003 Source: Mo. H (2013) 2004 2005 2006 2007 2008 2011 14
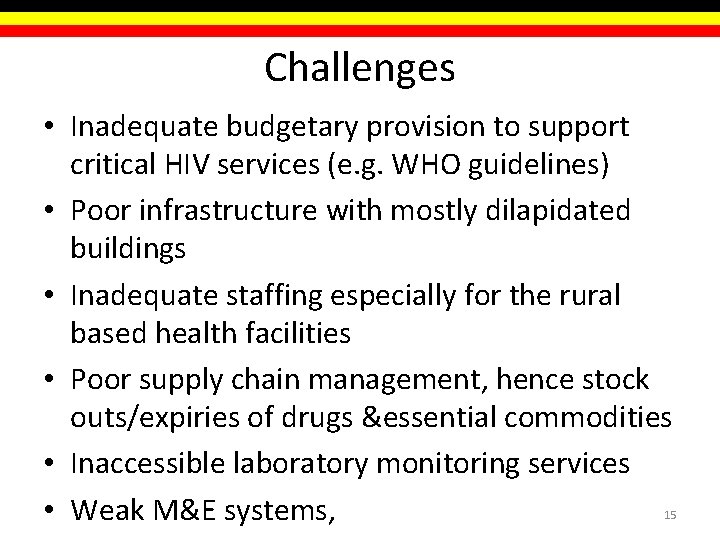
Challenges • Inadequate budgetary provision to support critical HIV services (e. g. WHO guidelines) • Poor infrastructure with mostly dilapidated buildings • Inadequate staffing especially for the rural based health facilities • Poor supply chain management, hence stock outs/expiries of drugs &essential commodities • Inaccessible laboratory monitoring services • Weak M&E systems, 15
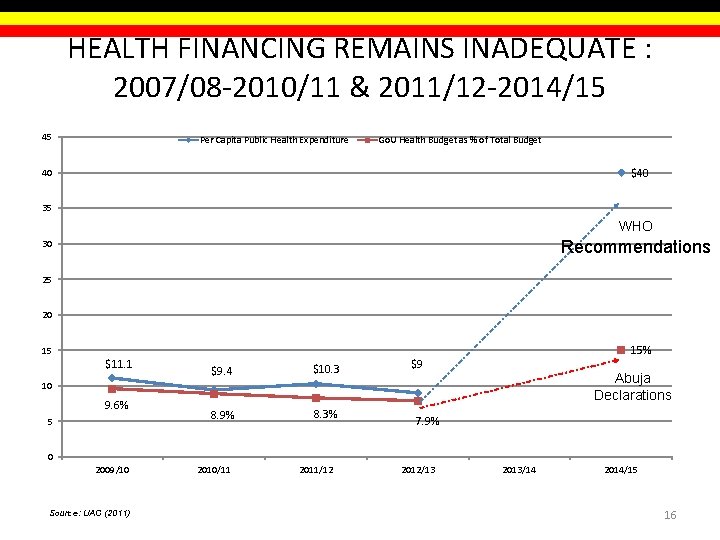
HEALTH FINANCING REMAINS INADEQUATE : 2007/08 -2010/11 & 2011/12 -2014/15 45 Per Capita Public Health Expenditure Go. U Health Budget as % of Total Budget $40 40 35 WHO Recommendations 30 25 20 15% 15 $11. 1 $9. 4 $10. 3 8. 9% 8. 3% $9 Abuja Declarations 10 9. 6% 5 7. 9% 0 2009/10 Source: UAC (2011) 2010/11 2011/12 2012/13 2013/14 2014/15 16
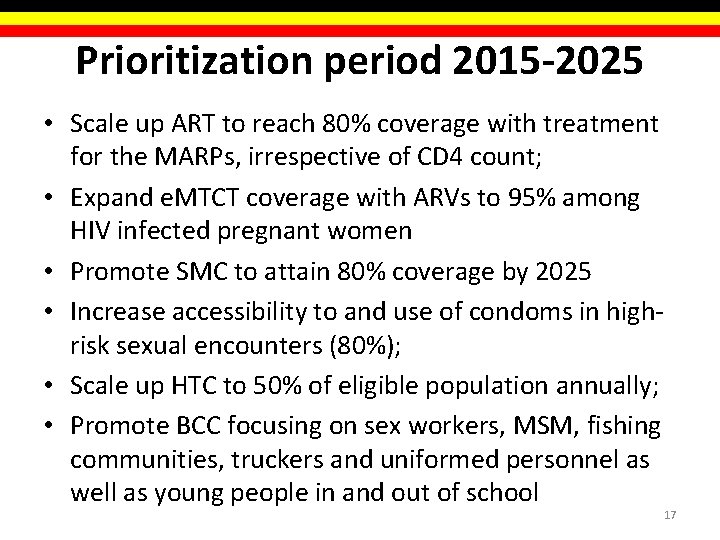
Prioritization period 2015 -2025 • Scale up ART to reach 80% coverage with treatment for the MARPs, irrespective of CD 4 count; • Expand e. MTCT coverage with ARVs to 95% among HIV infected pregnant women • Promote SMC to attain 80% coverage by 2025 • Increase accessibility to and use of condoms in highrisk sexual encounters (80%); • Scale up HTC to 50% of eligible population annually; • Promote BCC focusing on sex workers, MSM, fishing communities, truckers and uniformed personnel as well as young people in and out of school 17