TASS III The Next Generation of a Growth


- Slides: 52
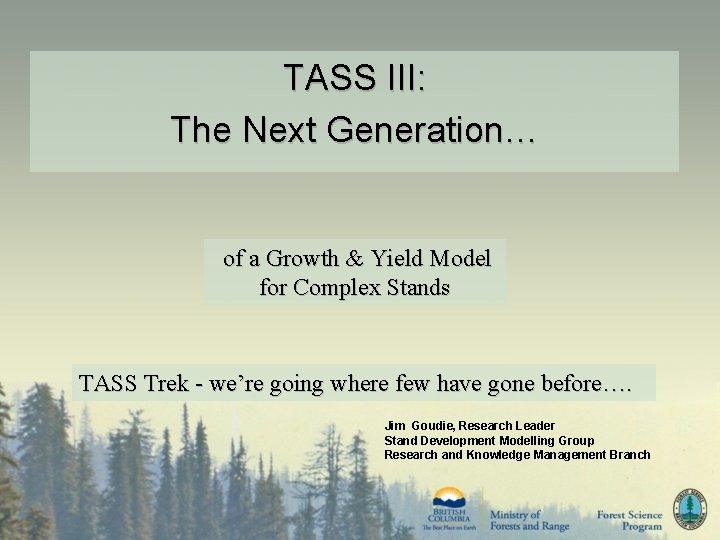
TASS III: The Next Generation… of a Growth & Yield Model for Complex Stands TASS Trek - we’re going where few have gone before…. Jim Goudie, Research Leader Stand Development Modelling Group Research and Knowledge Management Branch
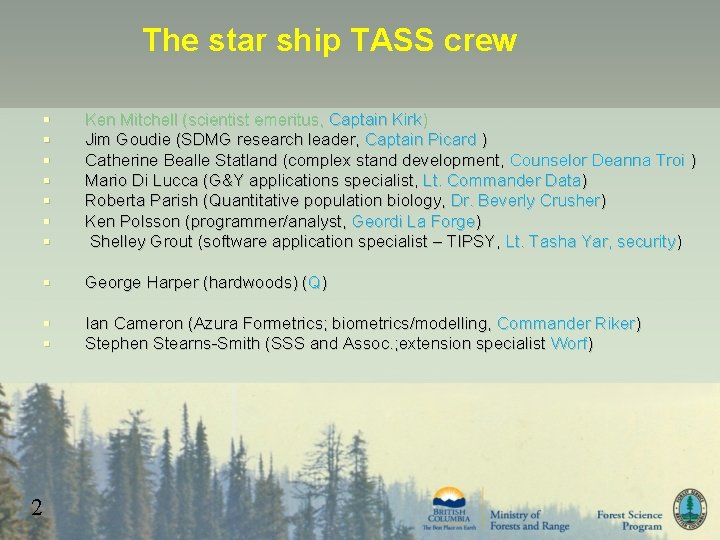
The star ship TASS crew 2 § § § § Ken Mitchell (scientist emeritus, Captain Kirk) Jim Goudie (SDMG research leader, Captain Picard ) Catherine Bealle Statland (complex stand development, Counselor Deanna Troi ) Mario Di Lucca (G&Y applications specialist, Lt. Commander Data) Roberta Parish (Quantitative population biology, Dr. Beverly Crusher) Ken Polsson (programmer/analyst, Geordi La Forge) Shelley Grout (software application specialist – TIPSY, Lt. Tasha Yar, security) § George Harper (hardwoods) (Q) § § Ian Cameron (Azura Formetrics; biometrics/modelling, Commander Riker) Stephen Stearns-Smith (SSS and Assoc. ; extension specialist Worf)
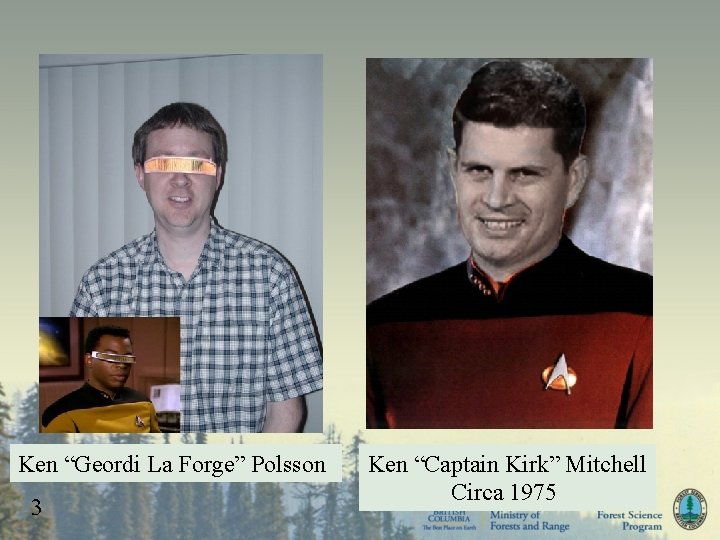
Ken “Geordi La Forge” Polsson 3 Ken “Captain Kirk” Mitchell Circa 1975
Outline • • • About TASS I – III history TASS III modifications o o • • 4 t. RAYci light model Crown profiles Crown competition Mortality TASS Graphical User Interface PLOTSY
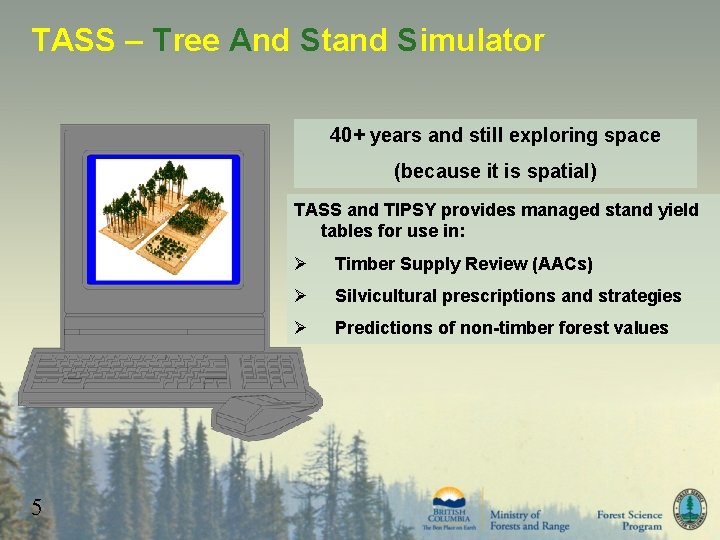
TASS – Tree And Stand Simulator 40+ years and still exploring space (because it is spatial) TASS and TIPSY provides managed stand yield tables for use in: 5 Ø Timber Supply Review (AACs) Ø Silvicultural prescriptions and strategies Ø Predictions of non-timber forest values
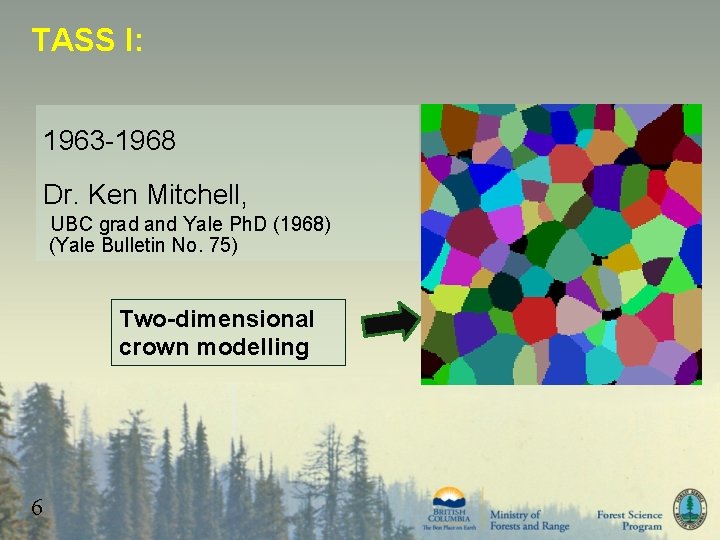
TASS I: 1963 -1968 Dr. Ken Mitchell, UBC grad and Yale Ph. D (1968) (Yale Bulletin No. 75) Two-dimensional crown modelling 6
TASS II: 1968 – present 1975 For. Sci. Monograph 17 Three-dimensional crown modelling 7
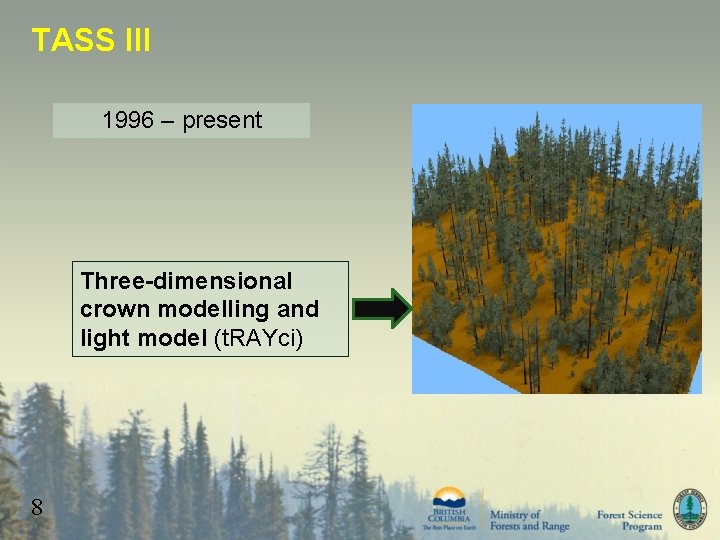
TASS III 1996 – present Three-dimensional crown modelling and light model (t. RAYci) 8
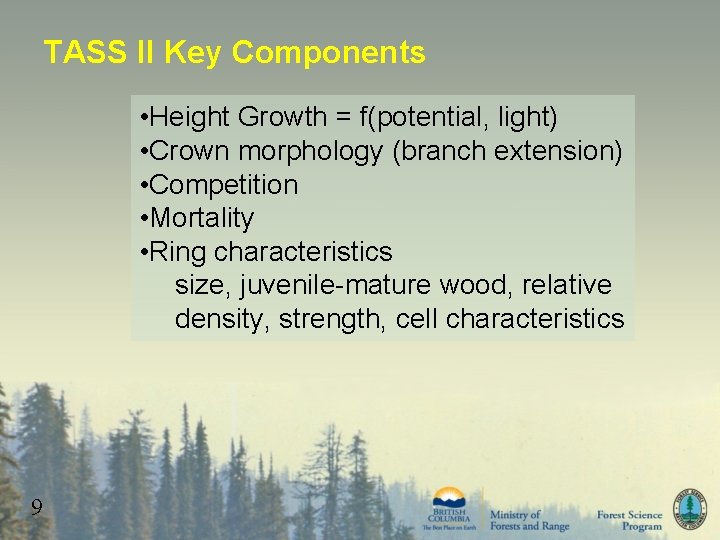
TASS II Key Components • Height Growth = f(potential, light) • Crown morphology (branch extension) • Competition • Mortality • Ring characteristics size, juvenile-mature wood, relative density, strength, cell characteristics 9
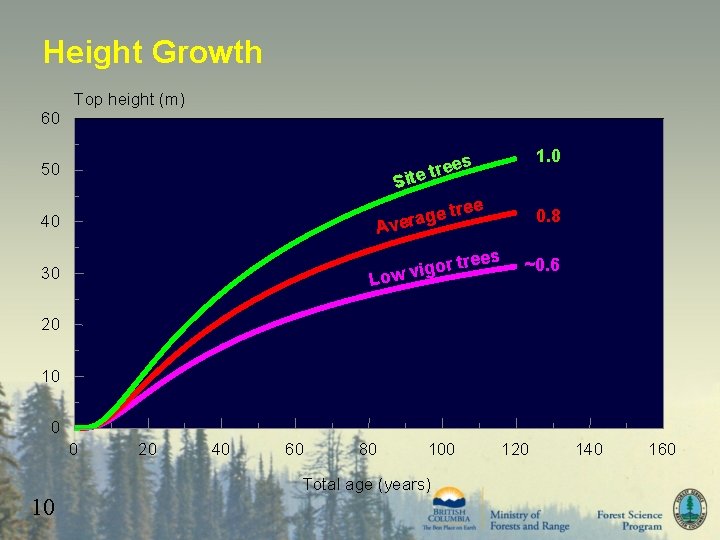
Height Growth 60 Top height (m) 1. 0 ees te tr 50 Si tree 40 ge Avera 30 ees r t r o g ow vi L 0. 8 ~0. 6 20 10 0 0 20 40 60 80 100 Total age (years) 10 120 140 160
Crown Growth 11
Competition - Mortality 12
Bole Increment Suppressed Open grown 13
Outline • • • About TASS I – III history TASS III modifications o o • • 14 t. RAYci light model Crown profiles Crown competition Mortality TASS Graphical User Interface PLOTSY
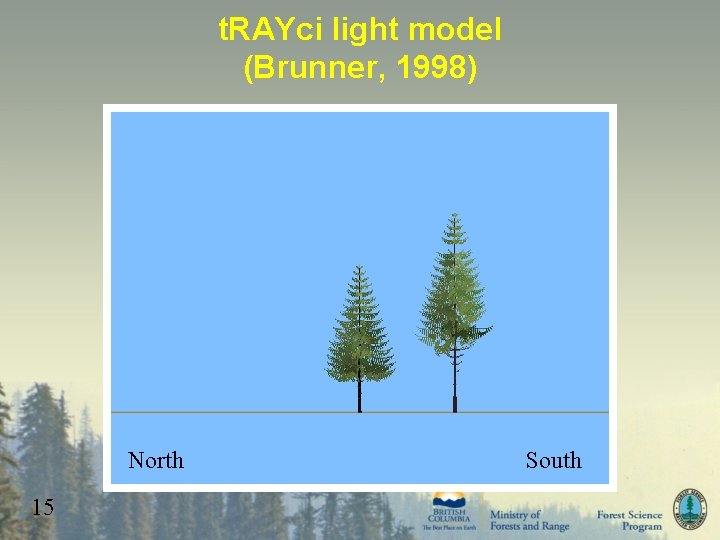
t. RAYci light model (Brunner, 1998) North 15 South
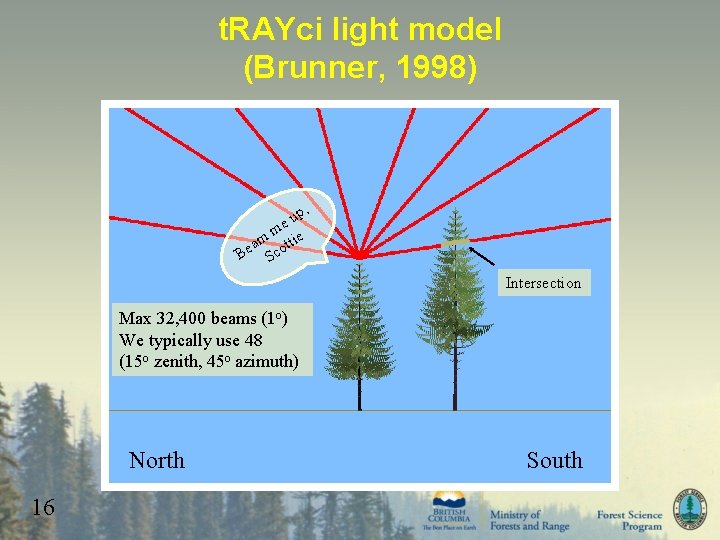
t. RAYci light model (Brunner, 1998) , up e m m ttie a Be Sco Intersection Max 32, 400 beams (1 o) We typically use 48 (15 o zenith, 45 o azimuth) North 16 South
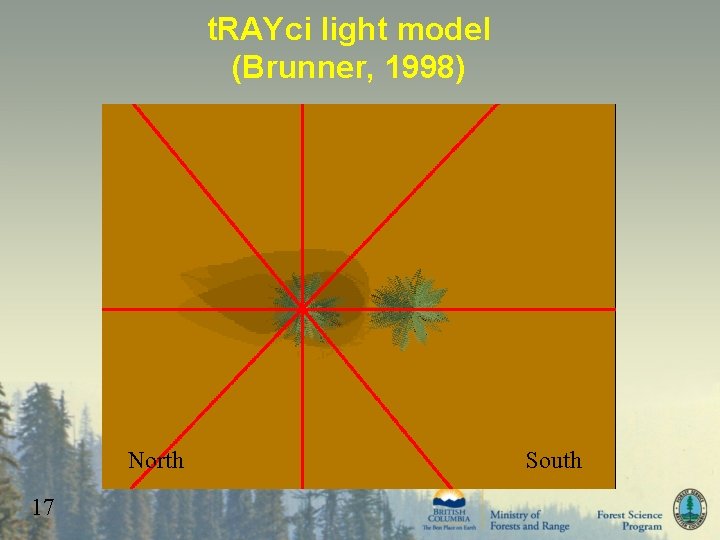
t. RAYci light model (Brunner, 1998) North 17 South
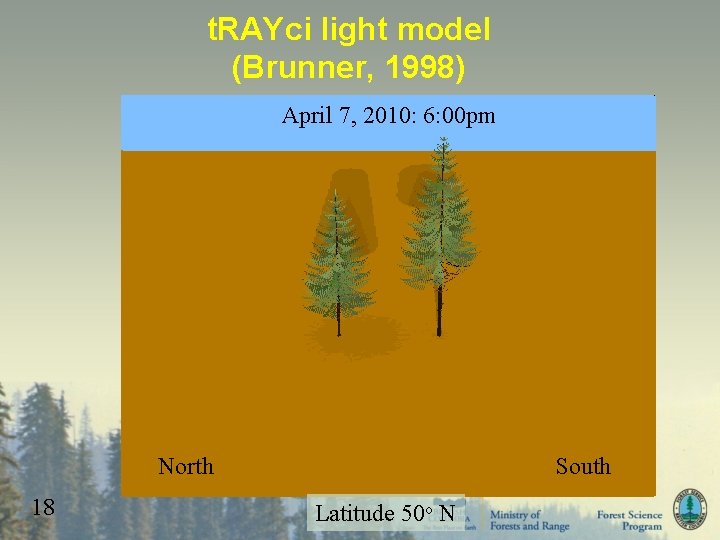
t. RAYci light model (Brunner, 1998) April 7, 2010: 5: 00 pm 3: 00 pm 6: 00 pm 4: 00 pm 1: 00 pm 8: 00 am 9: 00 am 2: 00 pm 7: 00 am 10: 00 am 11: 00 am 12: 00 am North 18 South Latitude 50 o N
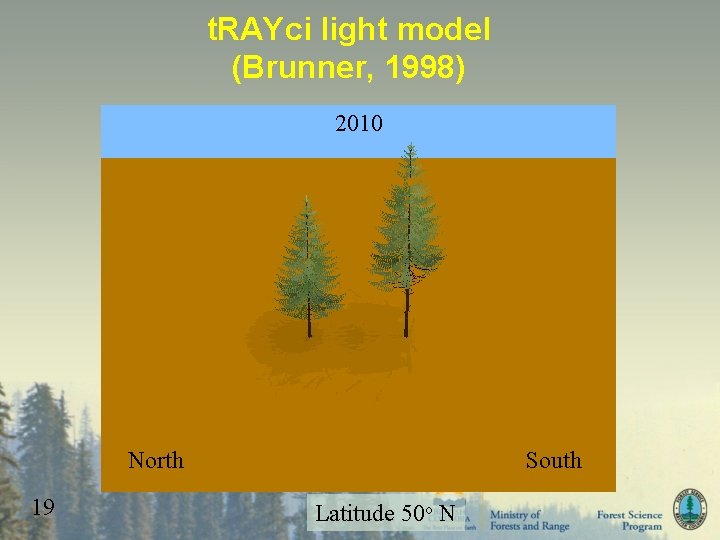
t. RAYci light model (Brunner, 1998) 2010 North 19 South Latitude 50 o N
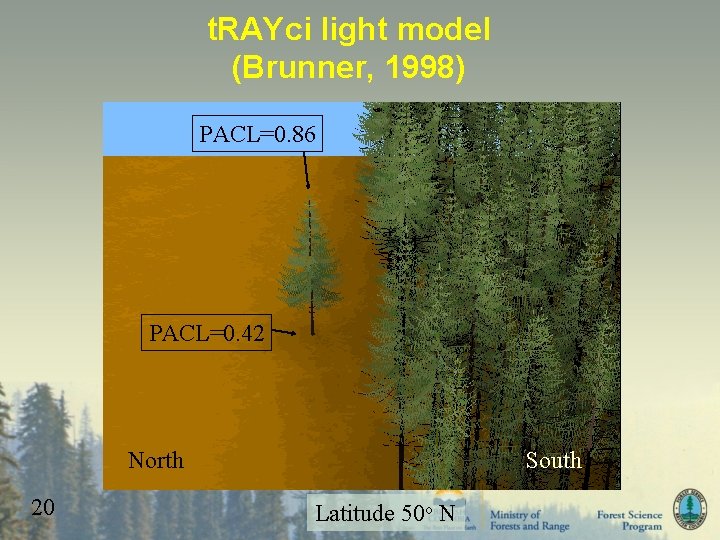
t. RAYci light model (Brunner, 1998) PACL=0. 86 PACL=0. 42 North 20 South Latitude 50 o N
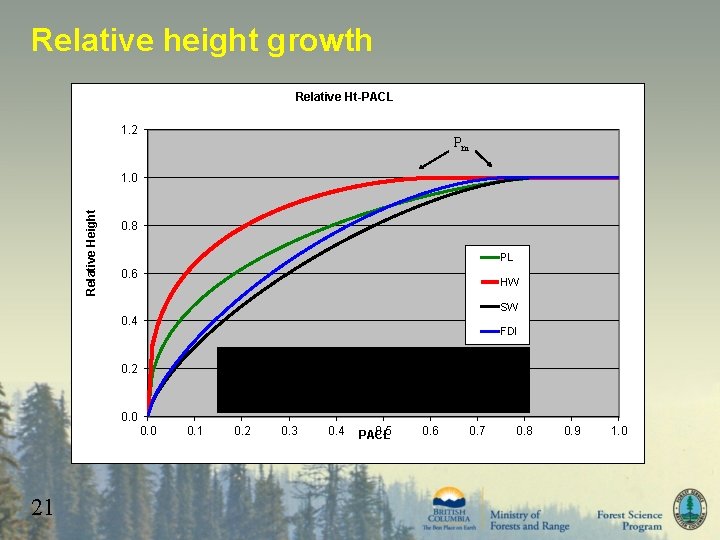
Relative height growth Relative Ht-PACL 1. 2 Pm Relative Height 1. 0 0. 8 PL 0. 6 HW SW 0. 4 FDI 0. 2 0. 0 21 0. 2 0. 3 0. 4 0. 5 PACL 0. 6 0. 7 0. 8 0. 9 1. 0
Outline • • • About TASS I – III history TASS III modifications o o • • 22 t. RAYci light model Crown profiles Crown competition Mortality TASS Graphical User Interface PLOTSY
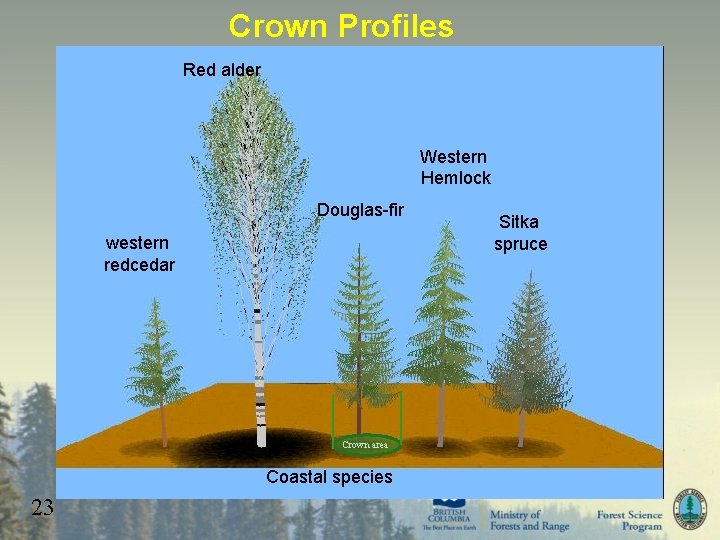
Crown Profiles Red alder Western Hemlock Douglas-fir western redcedar Crown area Coastal species 23 Sitka spruce
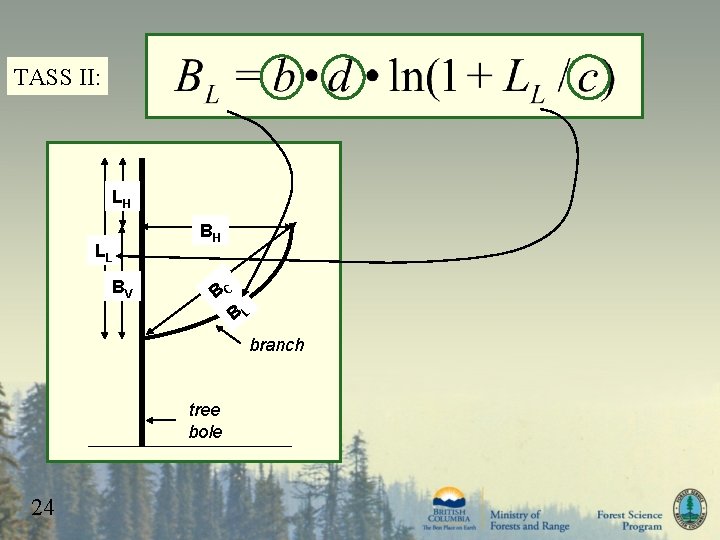
TASS II: LH LL BV BH BC BL branch tree bole 24
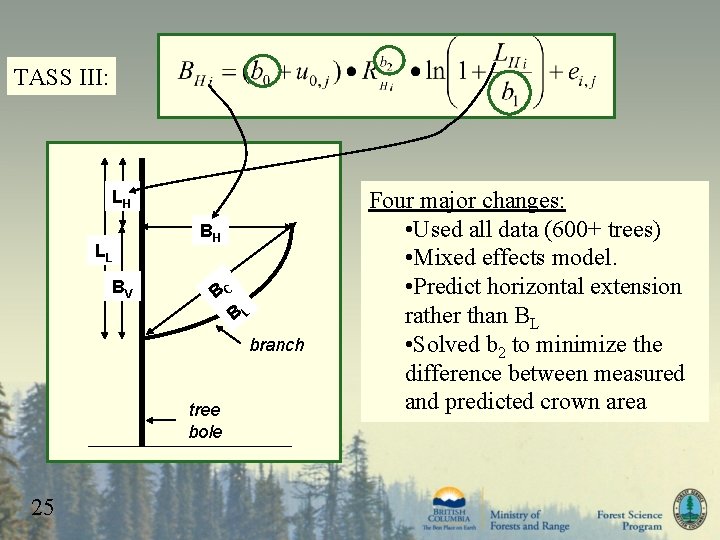
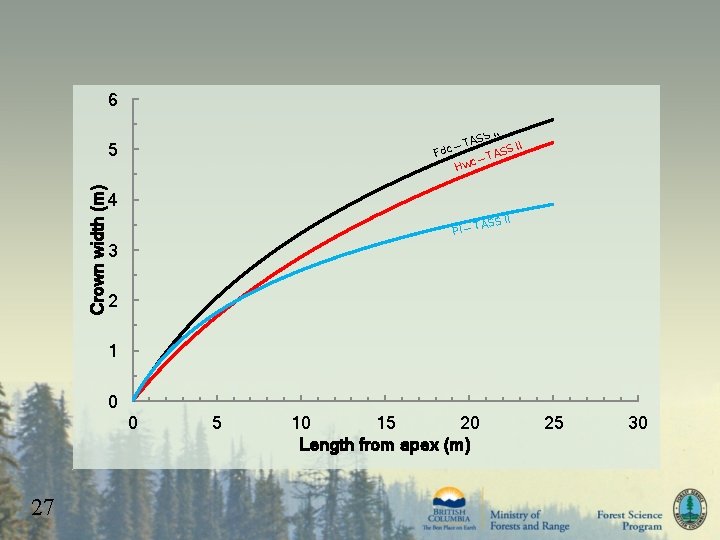
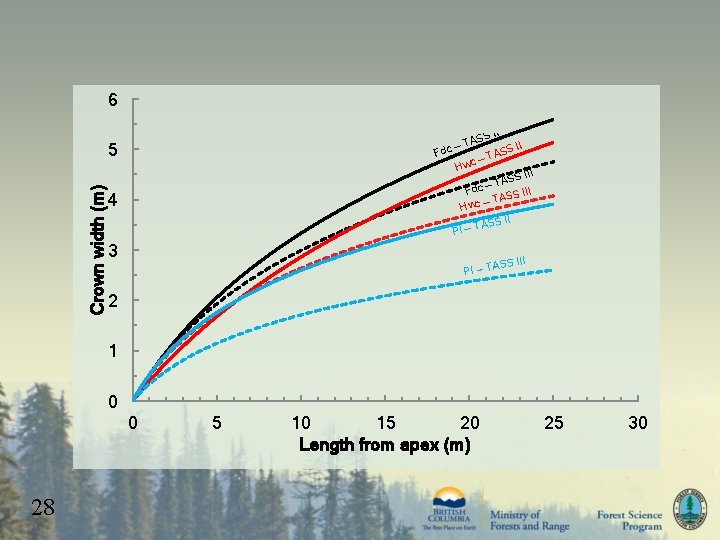
TASS III: LH LL BV BH BC BL branch tree bole 25 Four major changes: • Used all data (600+ trees) • Mixed effects model. • Predict horizontal extension rather than BL • Solved b 2 to minimize the difference between measured and predicted crown area
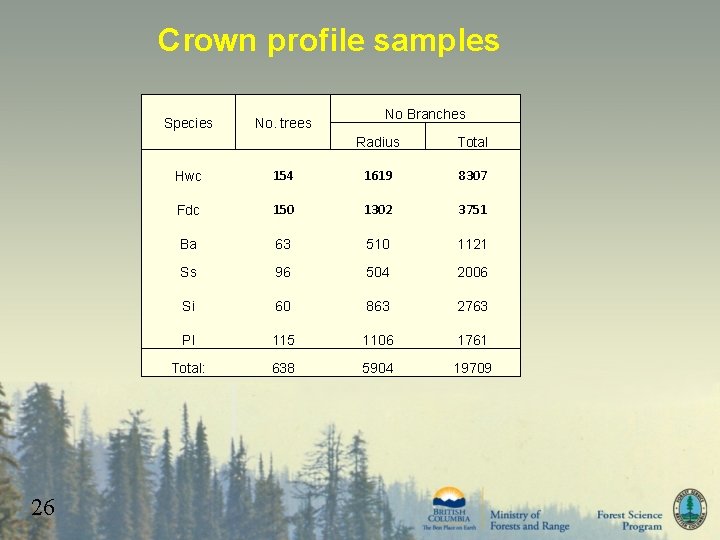
Crown profile samples Species 26 No. trees No Branches Radius Total Hwc 154 1619 8307 Fdc 150 1302 3751 Ba 63 510 1121 Ss 96 504 2006 Si 60 863 2763 Pl 115 1106 1761 Total: 638 5904 19709
6 S II TAS – S II Fdc TAS – Hwc Crown width (m) 5 4 I ASS I Pl – T 3 2 1 0 0 27 5 10 15 20 Length from apex (m) 25 30
6 S II TAS – S II Fdc TAS – Hwc S III TAS – c Fd III TASS – c Hw I ASS I Pl – T Crown width (m) 5 4 3 SS III Pl – TA 2 1 0 0 28 5 10 15 20 Length from apex (m) 25 30
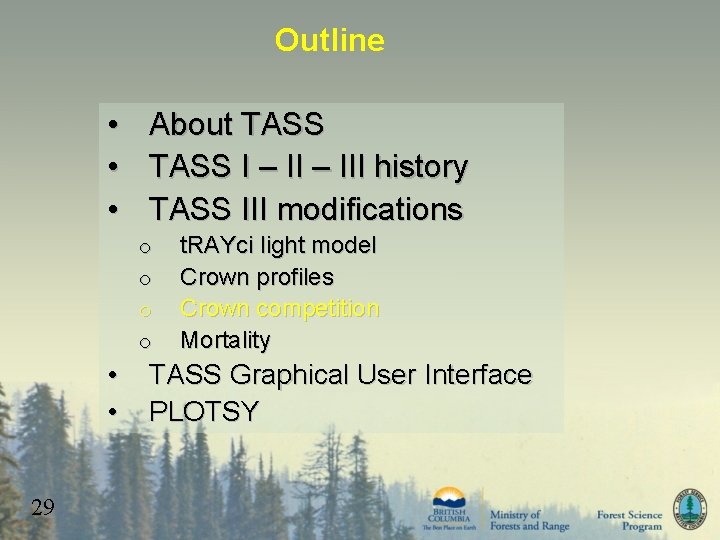
Outline • • • About TASS I – III history TASS III modifications o o • • 29 t. RAYci light model Crown profiles Crown competition Mortality TASS Graphical User Interface PLOTSY
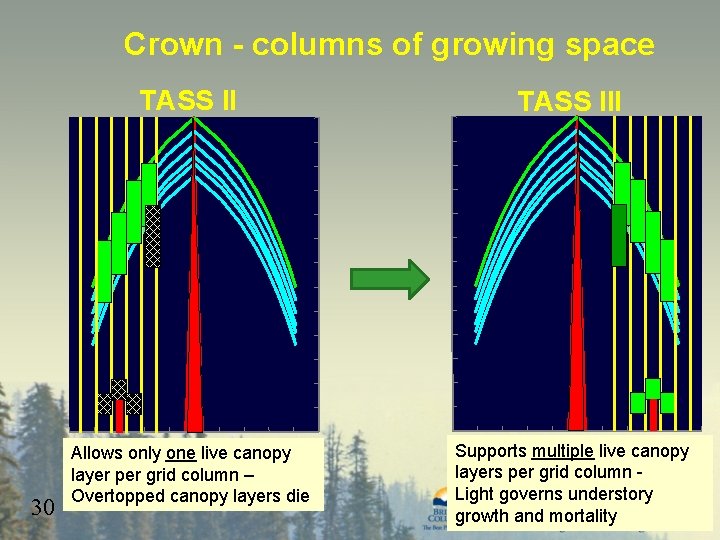
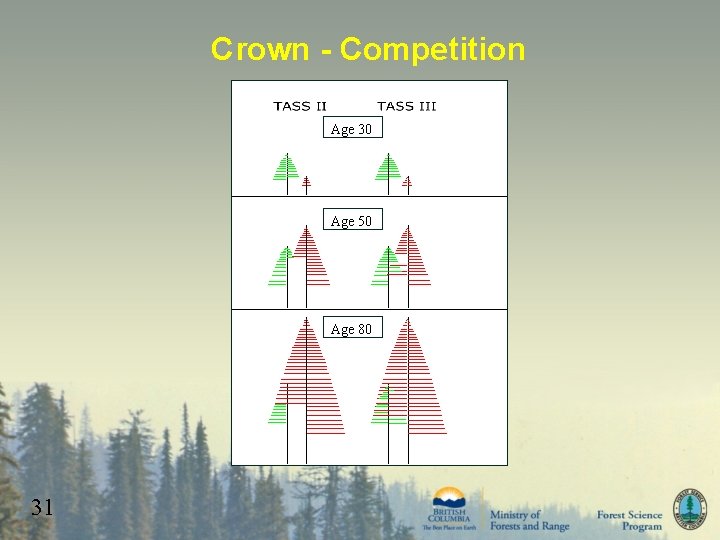
Crown - columns of growing space 30 TASS III Allows only one live canopy layer per grid column – Overtopped canopy layers die Supports multiple live canopy layers per grid column Light governs understory growth and mortality
Crown - Competition Age 30 Age 50 Age 80 31
Outline • • • About TASS I – III history TASS III modifications o o • • 32 t. RAYci light model Crown profiles Crown competition Mortality (our nemesis, the Borg) TASS Graphical User Interface PLOTSY
Mortality steps • Collected all stem-mapped PSPs • Input tree list and x-y coordinates into TASS • Estimated the PACL of each tree at each measurement • Used this derived PACL and other variables to predict the probability of death (or survival). • Tried several approaches but now, 33
Classification And Regression Trees (CART) • Classification for categorical variables (i. e. live or dead) or Regression for continuous variables • Random forests is the most well known software • While similar in concept to principle components analysis (which creates linear combinations of variables), this routine is nonparamentric (no assumptions necessary about the underlying distribution) and uses if-then-else logic. • Results are fairly straightforward to interpret, however, the algorithms are very complex • Need to decide: • The criteria for predictive accuracy • When to stop splitting • What is the "right-sized" tree (i. e. , over fitting can be a problem) 34
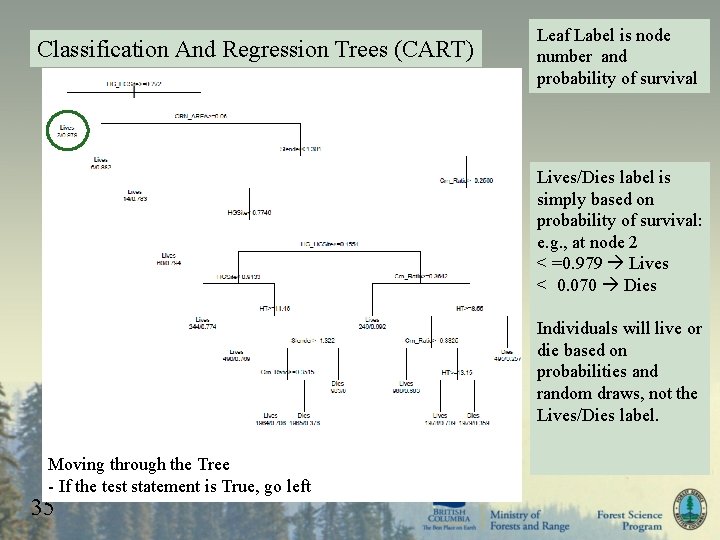
Classification And Regression Trees (CART) Leaf Label is node number and probability of survival Lives/Dies label is simply based on probability of survival: e. g. , at node 2 < =0. 979 Lives < 0. 070 Dies Individuals will live or die based on probabilities and random draws, not the Lives/Dies label. Moving through the Tree - If the test statement is True, go left 35
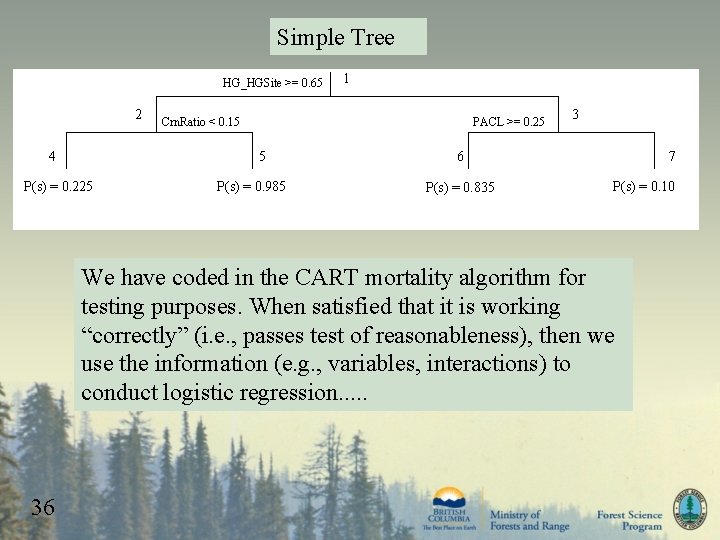
Simple Tree HG_HGSite >= 0. 65 2 4 PACL >= 0. 25 Crn. Ratio < 0. 15 5 P(s) = 0. 225 1 P(s) = 0. 985 3 6 P(s) = 0. 835 7 P(s) = 0. 10 We have coded in the CART mortality algorithm for testing purposes. When satisfied that it is working “correctly” (i. e. , passes test of reasonableness), then we use the information (e. g. , variables, interactions) to conduct logistic regression. . . 36
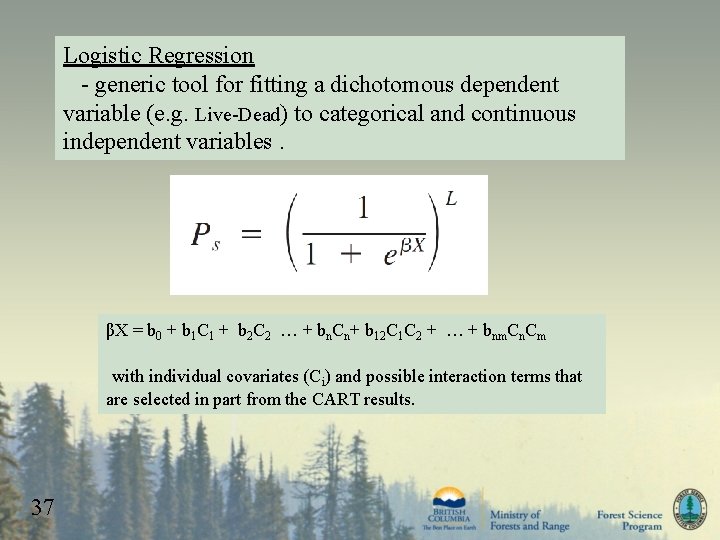
Logistic Regression - generic tool for fitting a dichotomous dependent variable (e. g. Live-Dead) to categorical and continuous independent variables. βX = b 0 + b 1 C 1 + b 2 C 2 … + bn. Cn+ b 12 C 1 C 2 + … + bnm. Cn. Cm with individual covariates (Ci) and possible interaction terms that are selected in part from the CART results. 37
Outline • • • About TASS I – III history TASS III modifications o o • • 38 t. RAYci light model Crown profiles Crown competition Mortality TASS Graphical User Interface (the holodeck) PLOTSY
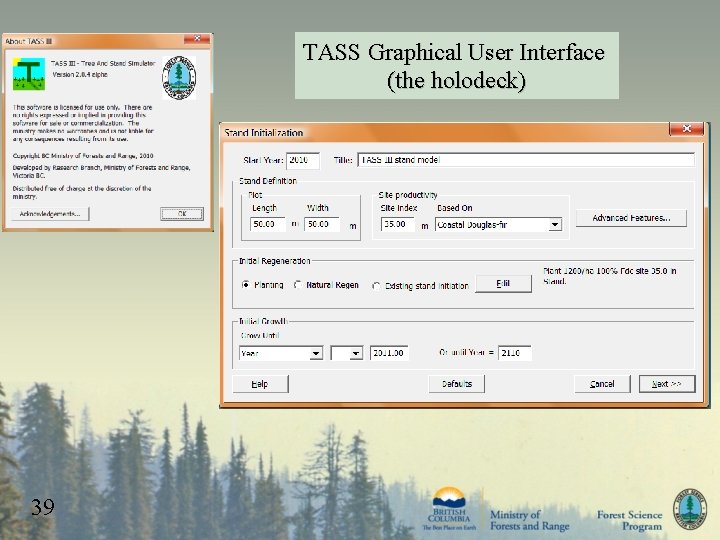
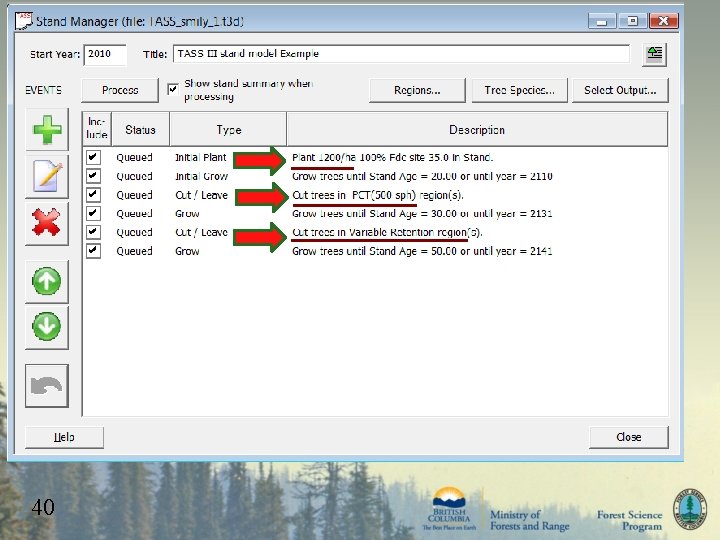
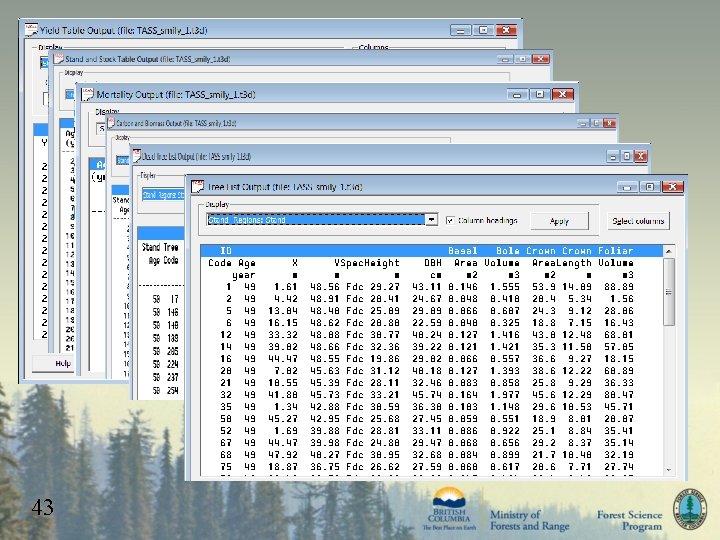
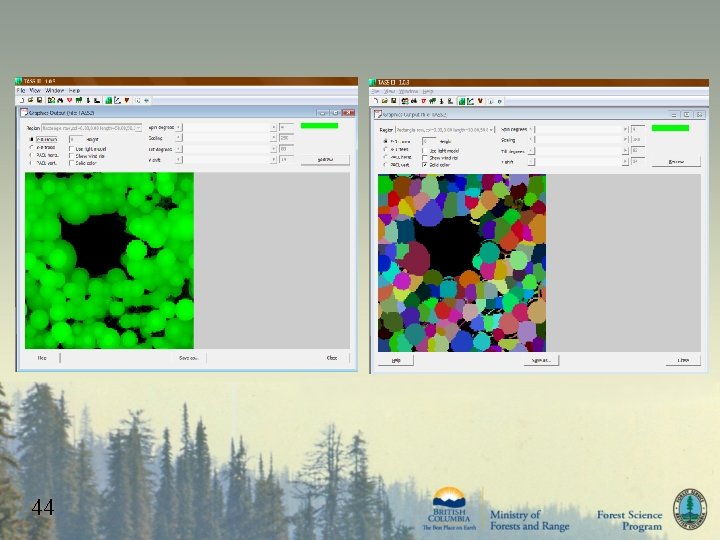
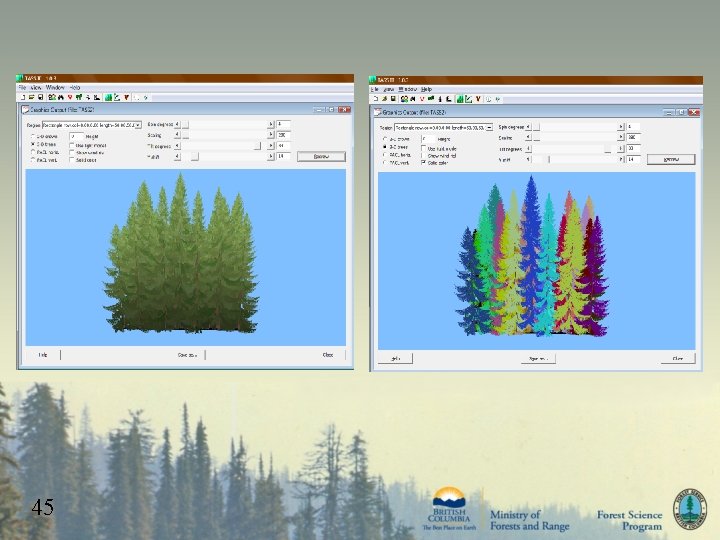
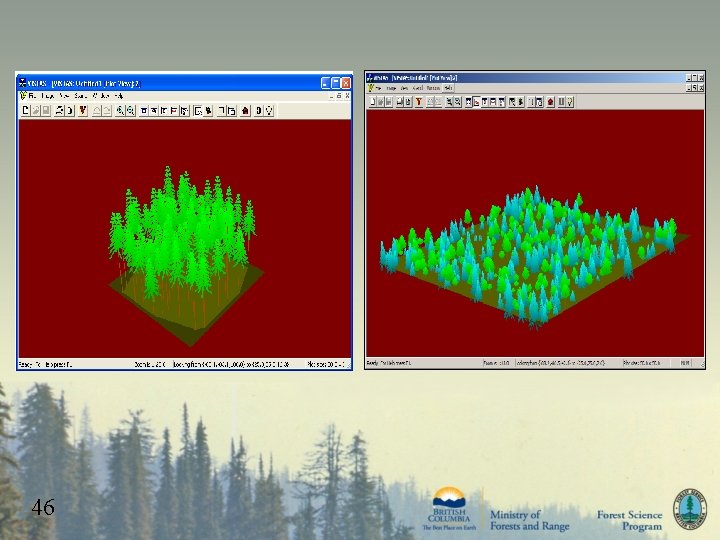
TASS Graphical User Interface (the holodeck) 39
40
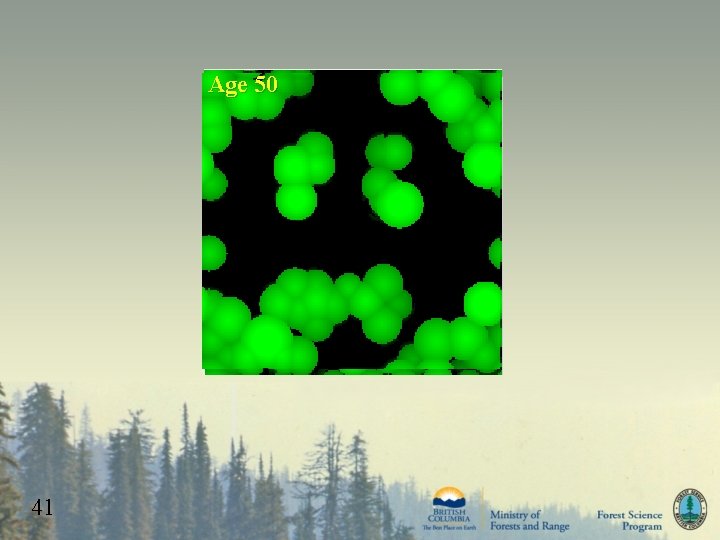
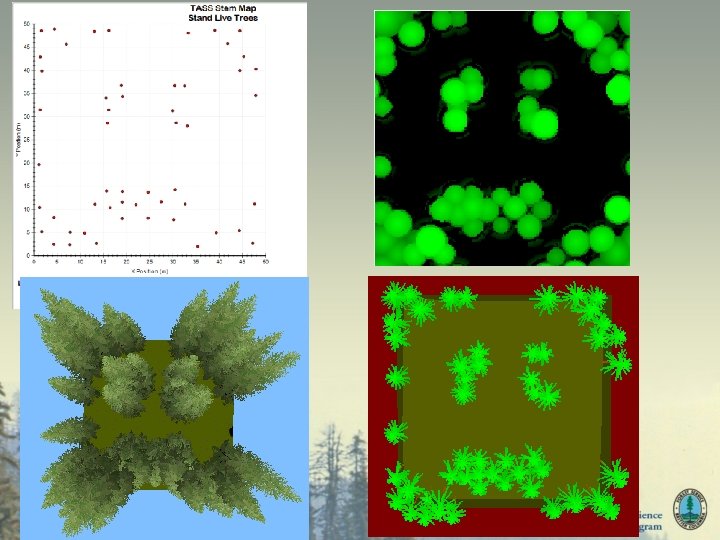
Age 30 30 PCT VR 400 50 Age 500 sph 520 10 Age 41
42
43
44
45
46
Outline • • • About TASS I – III history TASS III modifications o o t. RAYci light model Crown profiles Crown competition Mortality • TASS Graphical User Interface • 47 PLOTSY
48
49
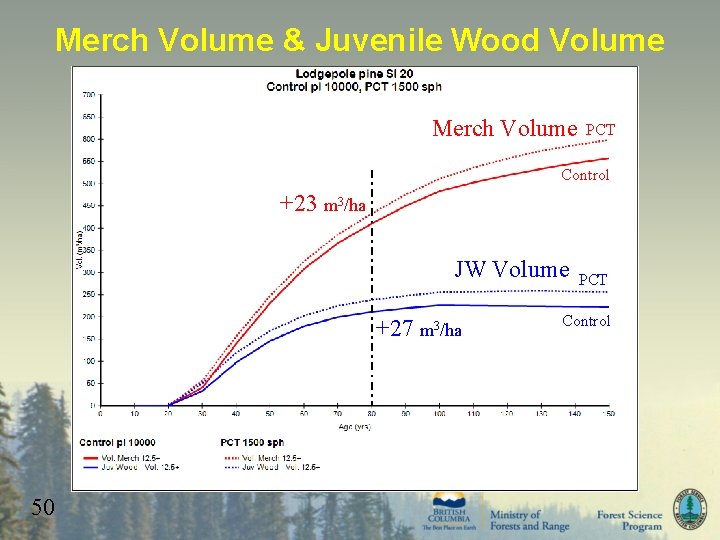
Merch Volume & Juvenile Wood Volume Merch Volume PCT Control +23 m 3/ha JW Volume +27 m 3/ha 50 PCT Control
TASS III Underlying philosophy unchanged: Advancing the prediction of stand growth and yield by focusing on the spatial dynamics of individual tree crowns, the biological engine of tree growth. TASS is a framework for synthesis of world-wide research on tree growth and stand development, with a focus on treatment response. 51
Thank you for your attention 52