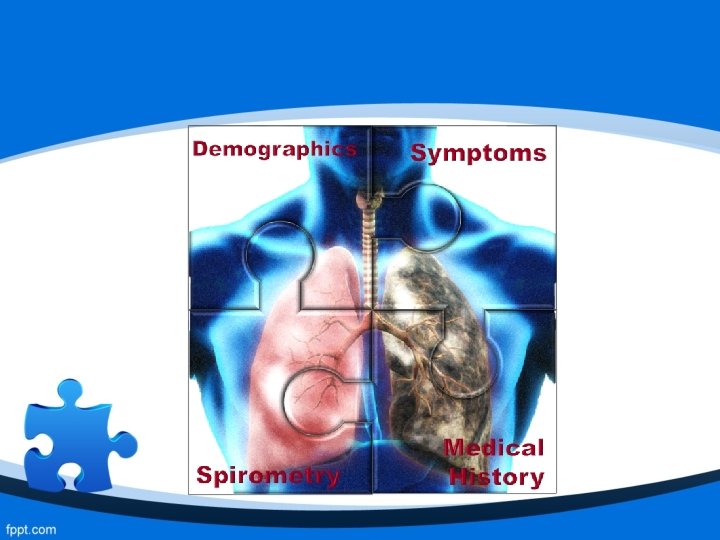
Spirometry Putting the Puzzle Together Rasheda Choudhury Senior


 - Back straight - Legs")
: • Patient takes big breath in • Blows")
 Time (seconds) Volume (Litres) A rapid start to a sharp")


 Tumour in the airways")


- Slides: 30
Spirometry: Putting the Puzzle Together Rasheda Choudhury Senior Respiratory Physiologist Adult Respiratory Care and Rehabilitation ARCa. Re
Anatomy and Physiology Trachea Bronchioles Narrowed Healthy Inflammation Airways are and constriction clear and - airways are open. swollen and No swelling muscles tighten and muscles around airways are relaxed Mucus blocks the airways
Objective of Spirometry • Spirometry is a diagnostic test performed to identify abnormalities in the airways and lung volume • It is the gold standard in the diagnosis and assessment of COPD • Performed in accordance to ARTP (Association of Respiratory and Technology Physiology) guidelines and standards
Performing Quality Assured Spirometry 1. Prepare the equipment: • Clean and safe to use • SABA Calibrated using 3 L syringe LABA before every session 4 HOURS 8 HOURS • Machine works! – Quality Control 2. Prepare the patient: • Gain consent. LAMA • Check for contraindications: 36 × Recent surgery Absolute if 4 -6 HOURS × Recent chest infection weeks × Chest pains
3. Record accurate height, weight, ethnic origin and age: - Asians: 10% lower vital capacity (VC) than Caucasians - Afro-Caribbean: 13% lower VC than Caucasians
25 Years Equations for predicted values are valid 55 Years between the ages 20 -60 years. Therefore, caution must 75 be. Years exercised in the interpretation of the spirometry results in the very young and very old. ` ↑ Age ↓ VC
4. Position: - Sitting comfortably (standing is not advised) - Back straight - Legs uncrossed
5 a. Slow Vital Capacity (SVC): • Patient takes big breath in • Blows out gently and steadily for as long as they can • At least 3 good blows (BTS/ARTP standard) b. Forced Vital Capacity (FVC): • Patient takes big breath in • Blows out fast and hard for as long as they can • At least 3 good blows (BTS/ARTP standard)
Normal Spirometry Volume (Litres) Time (seconds) Volume (Litres) A rapid start to a sharp peak with linear flow until FVC is reached (usually 4 -6 seconds)
Errors in Technique Extra Breath Sub-Maximal Effort Slow Start Coughing Early Termination
Measurements FEV 1: Forced Expiratory Volume in the 1 st Second The volume of air in litres that can be forcefully and maximally exhaled out in the 1 st second after a maximal FEV 1/FVC Ratio (%) inspiration. This ratio is used to determine normal, restrictive or FVC: Forced Vital Capacitylung disorders. obstructive The volume of air in litres that can be forcefully and maximally exhaled out after a maximal inspiration. Relaxed/Slow Vital Capacity (SVC) – similar to FVC, but slow maximal exhalation
Interpretation 3 Easy Steps: 1. Flow Volume Loop 2. FEV 1/FVC Ratio 3. FEV 1 % Predicted and FVC % Predicted
Flow Volume Loop: Normal Flow volume curve between peak and FVC is approximately a straight line due to relative uniform emptying of lungs. FVC
Normal
Flow Volume Loop: Restrictive Flow volume curve shows a similar shape to a normal curve but with a reduced FVC and/or FEV 1. Curve is squashed to the left indicating reduced lung volumes due to a drop in lung compliance (stiffening of the lungs, e. g. pulmonary fibrosis
Causes of Restriction - Obesity Pulmonary Fibrosis Sarcoidosis Scoliosis Pulmonary Oedema Muscle Weakness Previous Surgery, e. g. lobectomy or pneumonectomy
Restrictive
Flow Volume Loop: Obstructive Flow volume curve shows a smooth curvilinear drop in flow with respect to volume indicating flow limitation, e. g. asthma. Chronic – early collapse of large airways and sudden drop in flow, e. g. emphysema.
Causes of Obstruction - COPD Asthma Bronchiectasis Cystic Fibrosis (CF) Tumour in the airways Foreign body in the airways
Mild Obstruction
Moderate Obstruction
Mixed: Restrictive and Obstructive
Causes of Mixed/Combined Multiple Pathologies: - Kyphoscoliosis and COPD - Tumour and COPD
Bronchodilator Response Asthma or COPD? - Salbutamol: 100 mcg MDI x 4 puffs with spacer or 2. 5 mg nebules via nebuliser 15 minutes 3 Forced Vital Capacity manoeuvres BD Difference = (Post FEV 1 – Pre FEV 1) x 1000
Positive Reversibility: 430 ml increase in FEV 1
Interpretation Flow Chart
Spirometry Training • Performing spirometry with no training = poor standards • Machines not calibrated / cared for • Minimum standards of acceptance • Poor interpretation Incorrect diagnoses and treatment management
Quality of Diagnostic Spirometry • New ARTP Framework for certificate of competency • Improve the quality of spirometry by establishing a national register of certified healthcare professionals. • Full implementation by April 2021. • Re-certification every 3 years
Any Questions? Feedback / Contact: Rasheda. Choudhury@bartshealth. nhs. uk Rasheda. Choudhury@nhs. net @THspiro @NHSBarts. Health