Dynamic Spirometry by Dr Thouraya BOUTKEDIIRT Spirometry It

Dynamic Spirometry by Dr. Thouraya BOUTKEDIIRT

Spirometry It provides an objective measurement of lung function. It analyzes volume and velocity of expired air

Static test Performed without regard to time Relaxed Vital capacity: Volume of expired air measured after a maximal inspiration

Dynamic test Performed at forcible and max effort against time Measures the rate at which the lung changes volume during forced breathing. Forced vital capacity The max volume of air that can be forcibly and rapidly exhaled following a max inspiration.

Two types of curves can be obtained Forced expiratory curve Flow Volume curve

Forced Expiratory Curve Ø The subject takes a maximal inspiration and then exhales as rapidly, as forcibly, & as maximally as possible. Ø A plot of volume against time:

FEV 1 : Volume of air expelled in the 1 st sec of forced expiration starting from full inspiration FEV 1 = 4 l/sec (plateau) FVC = 5 l/sec (FEV 1/FVC) * 100 ≥ 80% NL: able to exhale 80% from VC in the 1 st sec

Normal Trace Showing FEV 1 and FVC Volume, liters 5 4 FEV 1 = 4 L 3 FVC = 5 L 2 FEV 1/FVC = 0. 8 1 1 2 3 4 Time, sec 5 6

The curve helps ≠ obstructive LD Restrictive LD
 5 3 2 1")
Obstructive lung disease A 4 B FVC Expired Volume (l) 5 3 2 1 0 1 2 3 4 5 Time (s)

Obstructive Disease Normal Volume, liters 5 4 3 FEV 1 = 1. 8 L 2 FVC = 3. 2 L 1 FEV 1/FVC = 0. 56 1 2 3 4 5 Time, seconds 6 Obstructive
 5 A 4 3 C 2 1 0")
Restrictive lung disease Expired Volume (l) 5 A 4 3 C 2 1 0 1 2 3 4 5 Time (s)

Restrictive Disease Normal Volume, liters 5 4 3 Restrictive FEV 1 = 1. 9 L 2 FVC = 2. 0 L 1 FEV 1/FVC = 0. 95 1 2 3 4 5 Time, seconds 6
 5 A 4 B 3 C 2 1 0 1 2")
Expired Volume (l) 5 A 4 B 3 C 2 1 0 1 2 3 4 5 Time (s)

Obstructive lung disease FEV 1 ↓↓ ↓↓ FVC FEV 1/ ↓ or FVC ↔ ↓

Restrictive lung disease FEV ↓ 1 ↓ FVC ↓↓ FEV / FVC 1 ↔ or ↑
 ↓ (3) FEV 1")
Volume Normal Obstructive Restrictive FVC 5 ↓ or ↔ (5) ↓ (3) FEV 1 4 ↓↓↓ FEV 1% 80% (2) ↓ (40%) ↓ (2. 7) ↔ or ↑ (90)
 , and as percentages")
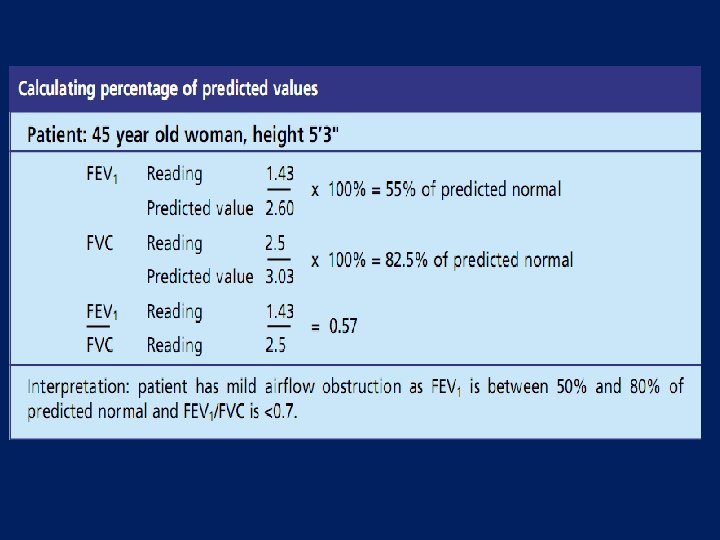
Results interpretation • Results are reported as absolute values (litre) , and as percentages of predicted values based on age, height, sex, ethnicity. • Normal: Both FVC and FEV 1 ≥ 80% of predicted • If one of the parameters is < 80% predicted, calculate FEV 1 ratio: • FEV 1% ≥ 90% ------ Restrictive • FEV 1% < 80 % ------ Obstructive
 rapid max inspirato Exhales Fast")
Flow Volume loop breathes normally (TV) rapid max inspirato Exhales Fast

This measures exp & insp flow as a function of exhaled volume rather then against time. Maximum expiratory flow (PEF) Expiratory flow rate L/sec TLC FVC Inspiratory flow rate L/sec Volume (L) RV
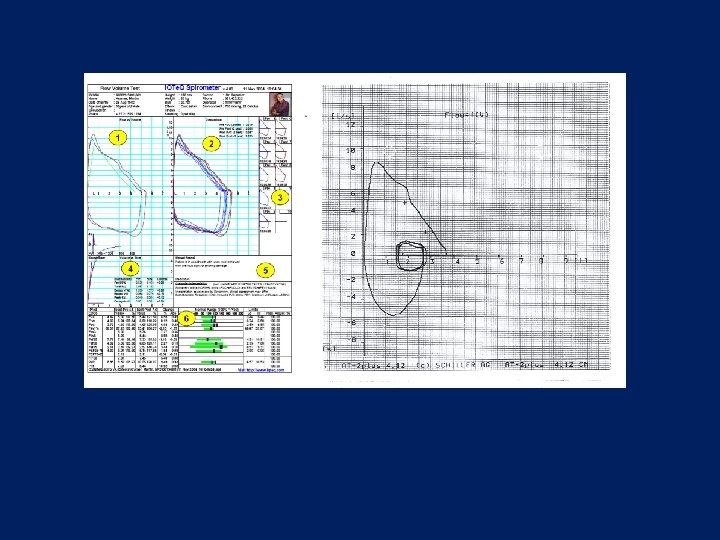

Flow Volume loop

• Measurements on flow V loop • PEFR : Greatest flow achieved during the maneuvre = 6 - 12 l/sec • PIFR = 6 l/sec • MEF 50: max expiratory flow at 50% of FVC = 4 - 6 l/sec • MEF 25= 2. 5 l/sec

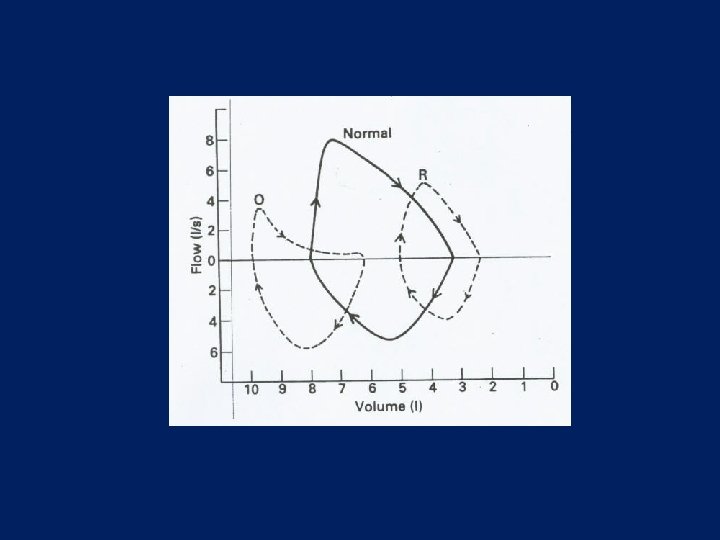
MEF 50↓ Effort independent part of curve: concave PEFR↓ Inspiratory loop Normal Obstructive LD
 All flow parameters ↓")
Restrictive LD Miniature loop (elliptical) All flow parameters ↓

Importance of spirometry Assess physical fitness. Helps in the diagnosis of certain pulmonary diseases (obstructive & restrictive). Follow disease progression.

Thank You
- Slides: 29