Space Weather in Ionosphere and Thermosphere Yihua Zheng


 Flare effects at Earth: ~ 8")


 Courtesy: SVS@ NASA/GSFC Geomagnetic storms due")


 Equator •")


- Slides: 41
Space Weather in Ionosphere and Thermosphere Yihua Zheng For SW REDI 2014
Space Weather Illustrated
Space Weather Effects and Timeline (Flare and CME) Flare effects at Earth: ~ 8 minutes (radio blackout storms) Duration: minutes to hours Two X-class flares/Two fast wide CMEs SEP radiation effects reaching Earth: 20 minutes – 1 hour after the event onset Duration: a few days CME effects arrives @ Earth: 1 -2 days (35 hours here) Geomagnetic storms: a couple of days 4
Types of Storms 5
ientation STEREO A CME SOHO/ACE SDO Earth * STEREO B
CME and SEP path are different CME Courtesy: Odstrcil SEPs CME: could get deflected, bended, but more or less in the radial direction
Important distinction Ion Radiation storm vs Geomagnetic storm CME impact and SEP (Solar Energetic Particle) impact are different CME impact @ Earth: Geomagnetic Storm Radiation storm @ Earth from SEPs CME speed: 300 – 3500 km/s SEPs: fraction of c Light speed c: 3 x 10^5 km/s
SEPs: ion radiation storms Potentially affect everywhere in the solar system Courtesy: SVS@ NASA/GSFC 9
Geomagnetic Storms: CME interaction with Earth (magnetic field) Courtesy: SVS@ NASA/GSFC Geomagnetic storms due to CIRs are at most moderate 10
Ionospheric Dynamics/Storms 11
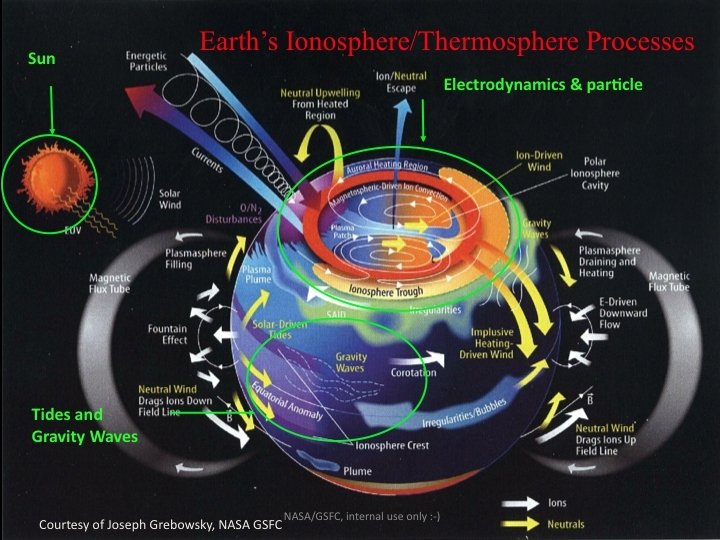
Ionosphere - Thermosphere Overview
Day/night ionospheric structure Day/night ionosphere is very different D region 50 to 90 km; E region 90 to 140 km; F 1 region 140 to 210 km; F 2 region over 210 km. 14
Composition of ionosphere
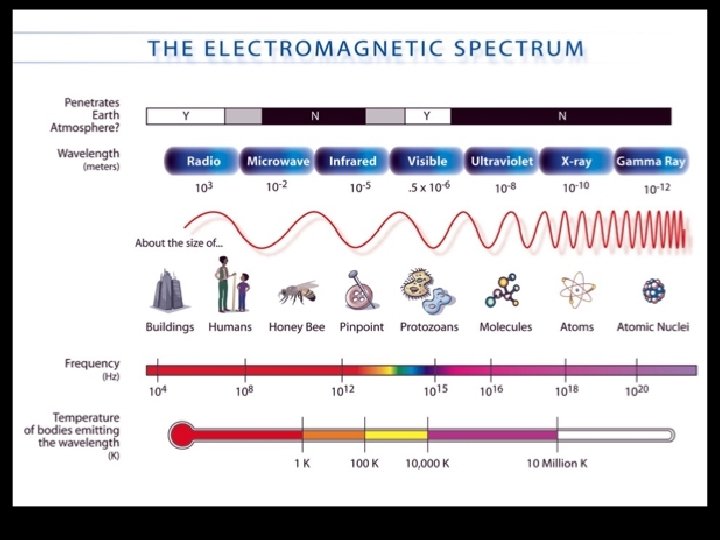
Ionosphere 101 Formed by solar EUV/UV radiation Reflects, refracts, diffracts & scatters radio waves, depending on frequency, density, and gradients Dielectric Properties Subject to Raleigh. Taylor instability at night formation of Equatorial Plasma Bubbles (EPBs) TURBULENT PLASMA “BUBBLES” Leads to highly variable reflection / refraction = “SCINTILLATION” PRN 7 Scintillated GPS Signal Courtesy: de la beaujardiere
The ionosphere is the densest plasma between the Earth and Sun, and is traditionally believed to be mainly influenced by forcing from above (solar radiation, solar wind/magnetosphere) Recent scientific results show that the ionosphere is strongly influenced by forces acting from below. Text Research remains to be done: How competing influences from above and below shape our space environment. Courtesy: ICON
The daytime ionosphere exhibits significant variability in its motion and density. the source of these changes: unknown likely originates with modulation of neutral and/or ionized state variables along the magnetic field - need to be determined coupled ion-neutral dynamics critical
Space Weather Phenomena and Effects in the Ionosphere Aurora – hemispheric power (satellite charging, scintillation) Satellite drag due to neutrals Equatorial bubbles/irregularities –scintillation, communication problems Radio blackout -- solar flare Polar Cap Absorption - solar energetic particles
Types of space weather events affecting nav and commu
Signals of different types with different purposes GPS signal: Penetrate through the ionosphere Text
ALF: Absorption Limiting Freq.
Communication/Navigation Problem
Flare: SWx impacts • • • Cause radio blackout through changing the structures/composition of the ionosphere (sudden ionospheric disturbances) – x ray and EUV emissions, lasting minutes to hours and dayside Affect radio comm. , GPS, directly by its radio noises at different wavelengths Contribute to SEP – proton radiation, lasting a couple of days
Solar radio bursts can directly affect GPS operation • Solar radio bursts during December 2006 were sufficiently intense to be measurable with GPS receivers. The strongest event occurred on 6 December 2006 and affected the operation of many GPS receivers. This event exceeded 1, 000 solar flux unit and was about 10 times larger than any previously reported event. The strength of the event was especially surprising since the solar radio bursts occurred near solar minimum. The strongest periods of solar radio burst activity lasted a few minutes to a few tens of minutes and, in some cases, exhibited large intensity differences between L 1 (1575. 42 MHz) and L 2 (1227. 60 MHz). Civilian dual frequency GPS receivers were the most severely affected, and these events suggest that continuous, precise positioning services should account for solar radio bursts in their operational plans. This investigation raises the possibility of even more intense solar radio bursts during the next solar maximum that will significantly impact the operation of GPS receivers. Cerruti et al. , 2008, Space Weather
Ionospheric impact on signal path Could cause potential problems
22
30
Radiation Storms 31
32
Scintillation Basu et al. , 1999 33
Phase Scintillation Low Lat High Lat 34
Courtesy: Pi at JPL 35
Equatorial Plasma Bubbles • Plasma moves easily along field lines Magnetic (Dip) Equator • Upward plasma drift supports plasma against gravity unstable configuration Unstable Plasma F Region • E-region “shorts out” electrodynamic instability during day • At night, E-region conductivity too small to short-out E field Magnetic Field Lines E Region • Instability in plasma grows to form equatorial plasma bubbles (EPBs), which contain irregularities seen by radars (right image) & which disrupt communications • Irregularities mainly present during quiet times (Courtesy: de la beaujardiere) Daytime “Shorting” Earth
Ionosphere Irregularities • plasma bubbles: typical east–west dimensions of several hundred kilometers contain irregularities with scale-lengths ranging from tens of kilometers to tens of centimeters ( Woodman and Tsunoda). Basu et al. (1978) showed that between sunset and midnight, 3 -m scale irregularities that cause radar backscatter at 50 MHz, co-exist with sub-kilometer scale irregularities that cause VHF and L-band scintillations. After midnight, however, the radar backscatter and L-band scintillations decay but VHF scintillations caused by km-scale irregularities persist for several hours. Journal of Atmospheric and Solar-Terrestrial Physics Volume 61, Issue 16, 1 November 1999, Pages 1219 -1226
Spacecraft Drag • Spacecraft in LEO experience periods of increased drag that causes them to slow, lose altitude and finally reenter the atmosphere. Short-term drag effects are generally felt by spacecraft <1, 000 km altitude. • Drag increase is well correlated with solar Ultraviolet (UV) output and additional atmospheric heating that occurs during geomagnetic storms. • Most drag models use radio flux at 10. 7 cm wavelength as a proxy for solar UV flux. Kp is the index commonly used as a surrogate for short-term atmospheric heating due to geomagnetic storms. In general, 10. 7 cm flux >250 solar flux units and Kp>=6 result in detectably increased drag on LEO spacecraft. • Very high UV/10. 7 cm flux and Kp values can result in extreme short-term increases in drag. During the great geomagnetic storm of 13 -14 March 1989, tracking of thousands of space objects was lost. One LEO satellite lost over 30 kilometers of altitude, and hence significant lifetime, during this storm. 38
Satellite Drag • Atmospheric drag magnitude: is ballistic coefficient ρ is atmospheric density Solar cycle and space weather have strong impact on neutral atmospheric density Increasing atmospheric drag impacts: Frequency of “Drag Make-Up” maneuvers for satellite to stay in control box Covariance Uncertainty in predicted atmospheric drag impacts: Future satellite position predictions 39
The ionosphere is the densest plasma between the Earth and Sun, and is traditionally believed to be mainly influenced by forcing from above (solar radiation, solar wind/magnetosphere) Recent scientific results show that the ionosphere is strongly influenced by forces acting from below. Text Research remains to be done: How competing influences from above and below shape our space environment. Courtesy: ICON
i. SWA layout for ionosphere products http: //bit. ly/iono_layout