
IGS Ionospheric Working Group Status of the IGS
- Slides: 22
IGS Ionospheric Working Group Status of the IGS ionosphere products & future developments Andrzej Krankowski (University of Warmia and Mazury in Olsztyn, Poland) and Manuel Hernandez-Pajares (Technical University of Catalonia, Spain) IGS Analysis Center Workshop 2008 Miami Beach, 2 -6 June 2008 A. Krankowski and M. Hernández-Pajares 1
IGS Ionospheric Working Group Outline Introduction IGS IONO WG activities Summary of IGS global TEC maps performance Future activities and Conclusions IGS Analysis Center Workshop 2008 Miami Beach, 2 -6 June 2008 A. Krankowski and M. Hernández-Pajares 2
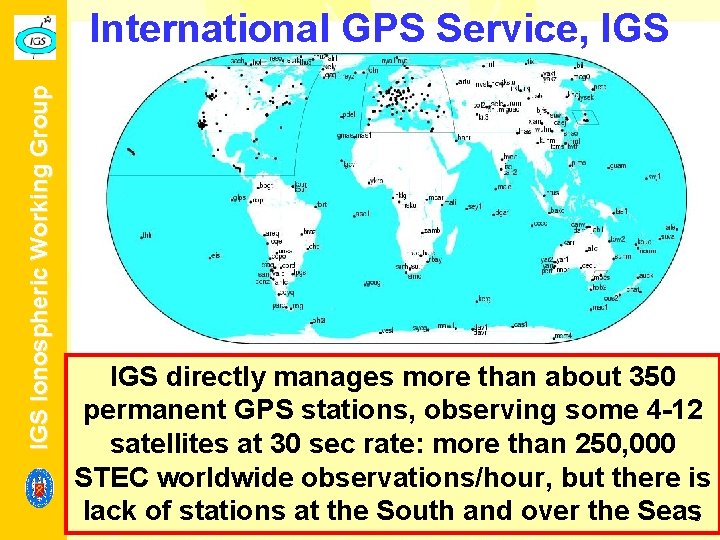
IGS Ionospheric Working Group International GPS Service, IGS directly manages more than about 350 permanent GPS stations, observing some 4 -12 satellites at 30 sec rate: more than 250, 000 STEC worldwide observations/hour, but there is lack of stations at the South and over the Seas 3 IGS Analysis Center Workshop 2008 Miami Beach, 2 -6 June 2008 A. Krankowski and M. Hernández-Pajares
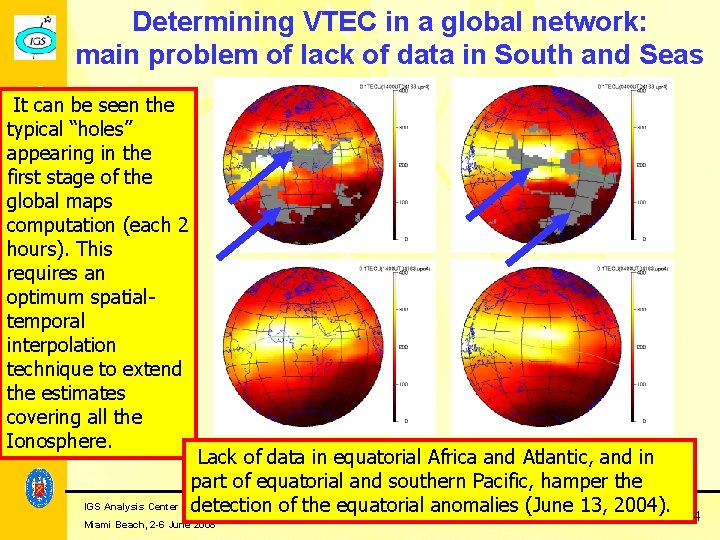
IGS Ionospheric Working Group Determining VTEC in a global network: main problem of lack of data in South and Seas It can be seen the typical “holes” appearing in the first stage of the global maps computation (each 2 hours). This requires an optimum spatialtemporal interpolation technique to extend the estimates covering all the Ionosphere. Lack of data in equatorial Africa and Atlantic, and in part of equatorial and southern Pacific, hamper the IGS Analysis Center Workshop 2008 Krankowski 13, and M. Hernández-Pajares detection of the equatorial anomalies A. (June 2004). 4 Miami Beach, 2 -6 June 2008
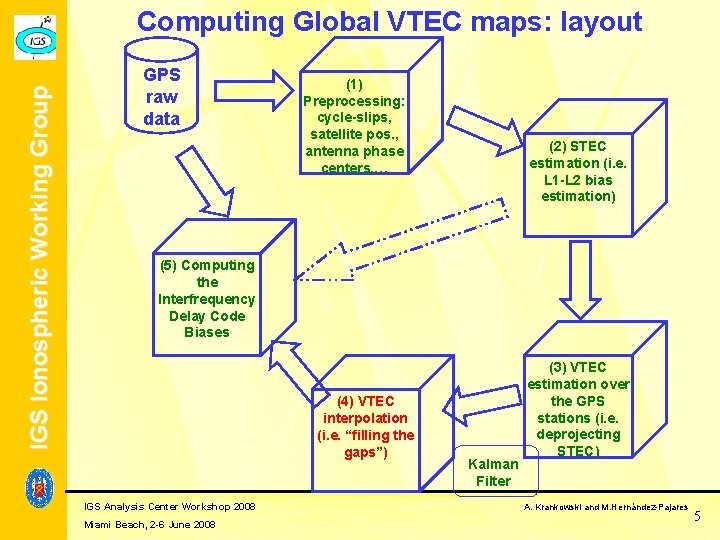
IGS Ionospheric Working Group Computing Global VTEC maps: layout GPS raw data (1) Preprocessing: cycle-slips, satellite pos. , antenna phase centers, … (2) STEC estimation (i. e. L 1 -L 2 bias estimation) (5) Computing the Interfrequency Delay Code Biases (4) VTEC interpolation (i. e. “filling the gaps”) IGS Analysis Center Workshop 2008 Miami Beach, 2 -6 June 2008 Kalman Filter (3) VTEC estimation over the GPS stations (i. e. deprojecting STEC) A. Krankowski and M. Hernández-Pajares 5
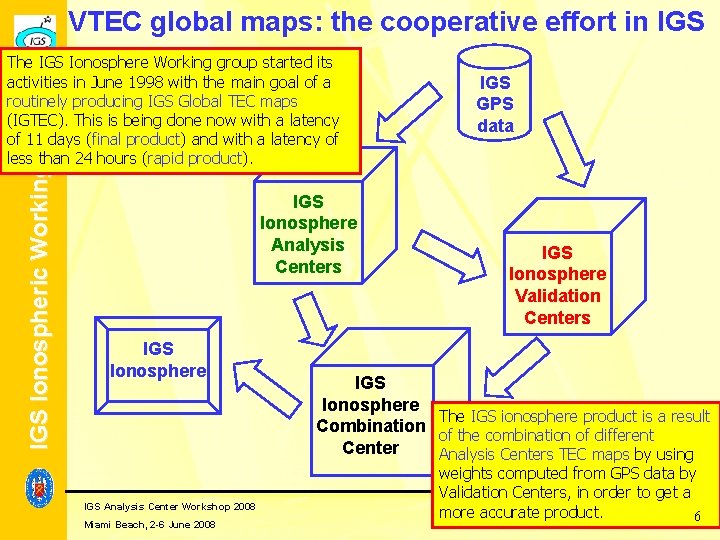
VTEC global maps: the cooperative effort in IGS Ionospheric Working Group The IGS Ionosphere Working group started its activities in June 1998 with the main goal of a routinely producing IGS Global TEC maps (IGTEC). This is being done now with a latency of 11 days (final product) and with a latency of less than 24 hours (rapid product). IGS Ionosphere Analysis Centers IGS Ionosphere IGS Analysis Center Workshop 2008 Miami Beach, 2 -6 June 2008 IGS GPS data IGS Ionosphere Validation Centers IGS Ionosphere The IGS ionosphere product is a result Combination of the combination of different Center Analysis Centers TEC maps by using weights computed from GPS data by Validation Centers, in order to get a A. Krankowski and M. Hernández-Pajares more accurate product. 6
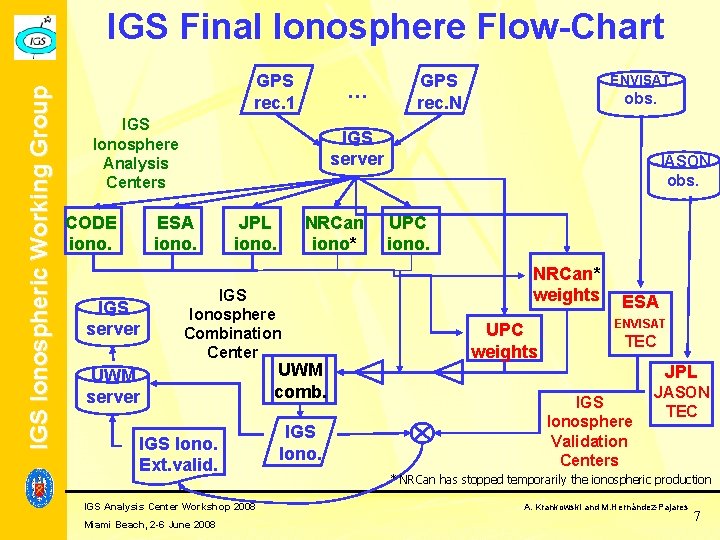
IGS Ionospheric Working Group IGS Final Ionosphere Flow-Chart GPS rec. 1 … IGS Ionosphere Analysis Centers CODE iono. ENVISAT obs. IGS server ESA iono. IGS server GPS rec. N JPL iono. NRCan iono* IGS Ionosphere Combination Center UWM server IGS Iono. Ext. valid. IGS Analysis Center Workshop 2008 Miami Beach, 2 -6 June 2008 UWM comb. IGS Iono. JASON obs. UPC iono. NRCan* weights UPC weights ESA ENVISAT TEC JPL IGS Ionosphere Validation Centers JASON TEC * NRCan has stopped temporarily the ionospheric production A. Krankowski and M. Hernández-Pajares 7
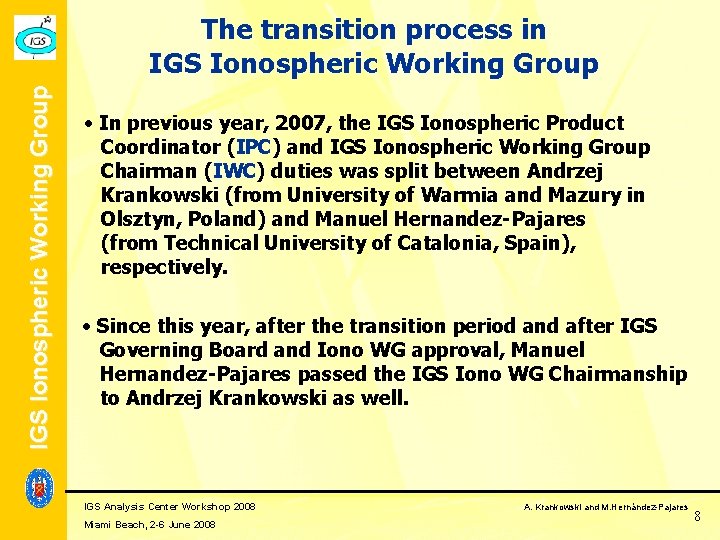
IGS Ionospheric Working Group The transition process in IGS Ionospheric Working Group In previous year, 2007, the IGS Ionospheric Product Coordinator (IPC) and IGS Ionospheric Working Group Chairman (IWC) duties was split between Andrzej Krankowski (from University of Warmia and Mazury in Olsztyn, Poland) and Manuel Hernandez-Pajares (from Technical University of Catalonia, Spain), respectively. Since this year, after the transition period and after IGS Governing Board and Iono WG approval, Manuel Hernandez-Pajares passed the IGS Iono WG Chairmanship to Andrzej Krankowski as well. IGS Analysis Center Workshop 2008 Miami Beach, 2 -6 June 2008 A. Krankowski and M. Hernández-Pajares 8
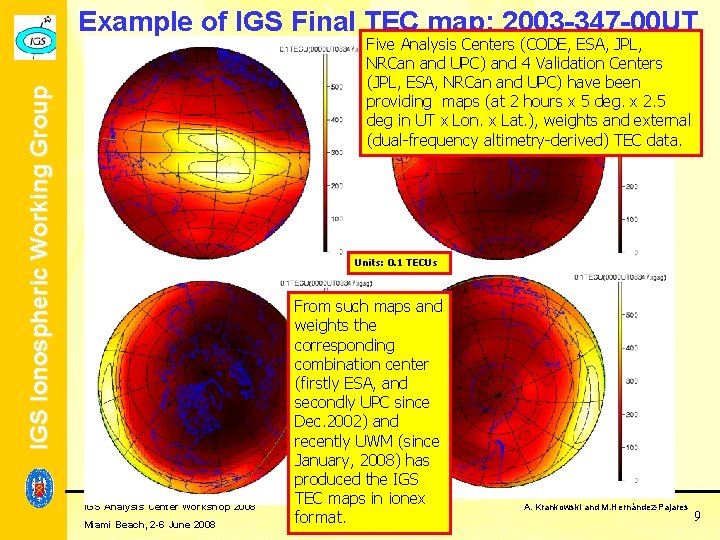
Example of IGS Final TEC map: 2003 -347 -00 UT IGS Ionospheric Working Group Five Analysis Centers (CODE, ESA, JPL, NRCan and UPC) and 4 Validation Centers (JPL, ESA, NRCan and UPC) have been providing maps (at 2 hours x 5 deg. x 2. 5 deg in UT x Lon. x Lat. ), weights and external (dual-frequency altimetry-derived) TEC data. Units: 0. 1 TECUs IGS Analysis Center Workshop 2008 Miami Beach, 2 -6 June 2008 From such maps and weights the corresponding combination center (firstly ESA, and secondly UPC since Dec. 2002) and recently UWM (since January, 2008) has produced the IGS TEC maps in ionex format. A. Krankowski and M. Hernández-Pajares 9
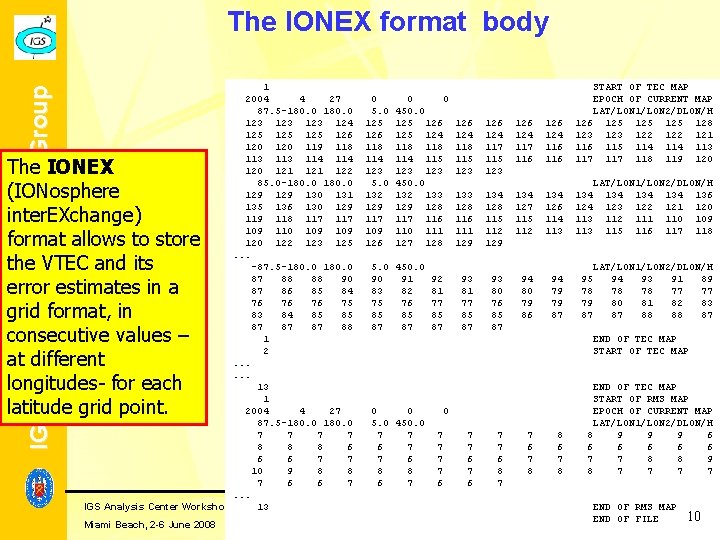
IGS Ionospheric Working Group The IONEX format body 1 2004 4 27 87. 5 -180. 0 123 123 124 125 125 126 120 119 118 113 114 120 121 122 85. 0 -180. 0 129 130 131 135 136 130 129 118 117 109 110 109 120 122 123 125. . . -87. 5 -180. 0 87 88 88 90 87 86 85 84 76 76 76 75 83 84 85 85 87 87 87 88 1 2. . . 13 1 2004 4 27 87. 5 -180. 0 7 7 8 8 8 6 6 6 7 7 10 9 8 8 7 6 6 7. . . IGS Analysis Center Workshop 2008 13 The IONEX (IONosphere inter. EXchange) format allows to store the VTEC and its error estimates in a grid format, in consecutive values – at different longitudes- for each latitude grid point. Miami Beach, 2 -6 June 2008 0 5. 0 125 126 118 114 123 5. 0 132 129 117 109 126 0 0 450. 0 125 126 125 124 118 114 115 123 450. 0 132 133 129 128 117 116 110 111 127 128 5. 0 450. 0 90 91 92 83 82 81 75 76 77 85 85 85 87 87 87 126 124 118 115 123 126 124 117 116 124 116 START OF TEC MAP EPOCH OF CURRENT MAP LAT/LON 1/LON 2/DLON/H 126 125 125 128 123 122 121 116 115 114 113 117 118 119 120 133 128 116 111 129 134 128 115 112 129 134 127 115 112 134 126 114 113 134 124 113 93 81 77 85 87 93 80 76 85 87 94 80 79 86 94 79 79 87 95 78 79 87 LAT/LON 1/LON 2/DLON/H 134 134 136 123 122 121 120 112 111 110 109 115 116 117 118 LAT/LON 1/LON 2/DLON/H 94 93 91 89 78 78 77 77 80 81 82 83 87 88 88 87 END OF TEC MAP START OF TEC MAP 0 0 5. 0 450. 0 7 7 6 8 8 6 7 0 7 7 6 7 7 6 8 7 7 6 7 8 8 6 7 8 END OF TEC MAP START OF RMS MAP EPOCH OF CURRENT MAP LAT/LON 1/LON 2/DLON/H 8 9 9 9 6 6 6 7 7 8 8 9 8 7 7 END OF RMS MAP A. Krankowski and M. Hernández-Pajares END OF FILE 10
IGS Ionospheric Working Group Overall validation of VTEC maps during more than 9 years of IGS final VTEC maps IGS Analysis Center Workshop 2008 Miami Beach, 2 -6 June 2008 A. Krankowski and M. Hernández-Pajares 11
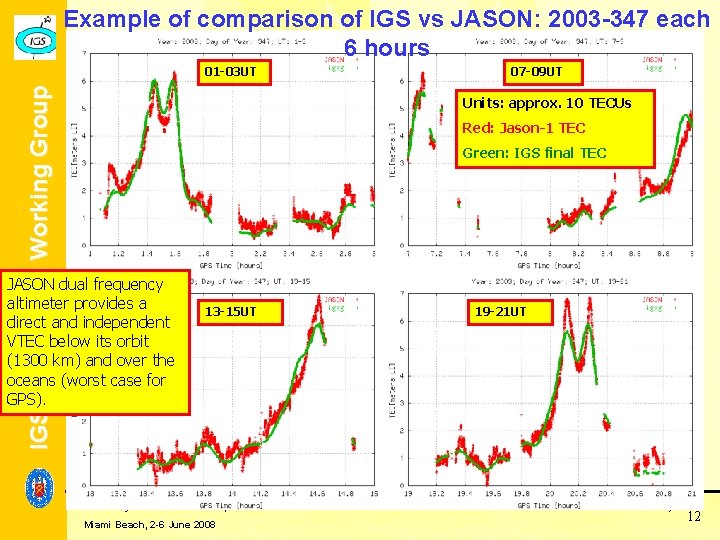
Example of comparison of IGS vs JASON: 2003 -347 each 6 hours IGS Ionospheric Working Group 01 -03 UT 07 -09 UT Units: approx. 10 TECUs Red: Jason-1 TEC Green: IGS final TEC JASON dual frequency altimeter provides a direct and independent VTEC below its orbit (1300 km) and over the oceans (worst case for GPS). 13 -15 UT IGS Analysis Center Workshop 2008 Miami Beach, 2 -6 June 2008 19 -21 UT A. Krankowski and M. Hernández-Pajares 12
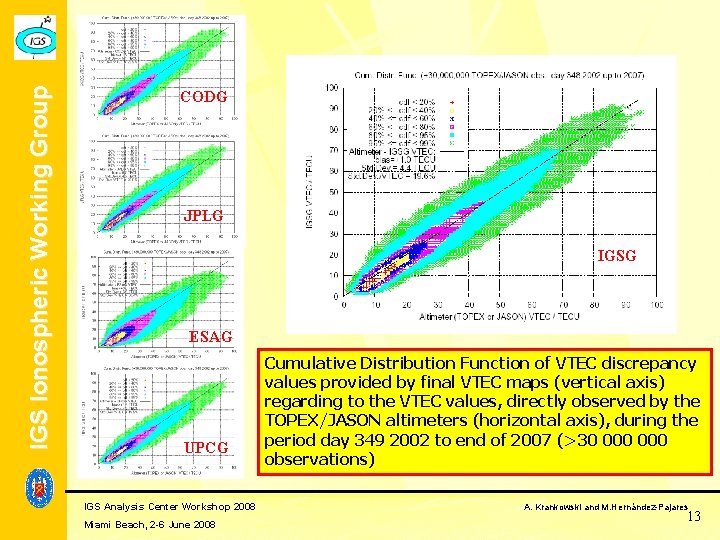
IGS Ionospheric Working Group CODG JPLG IGSG ESAG UPCG IGS Analysis Center Workshop 2008 Miami Beach, 2 -6 June 2008 Cumulative Distribution Function of VTEC discrepancy values provided by final VTEC maps (vertical axis) regarding to the VTEC values, directly observed by the TOPEX/JASON altimeters (horizontal axis), during the period day 349 2002 to end of 2007 (>30 000 observations) A. Krankowski and M. Hernández-Pajares 13
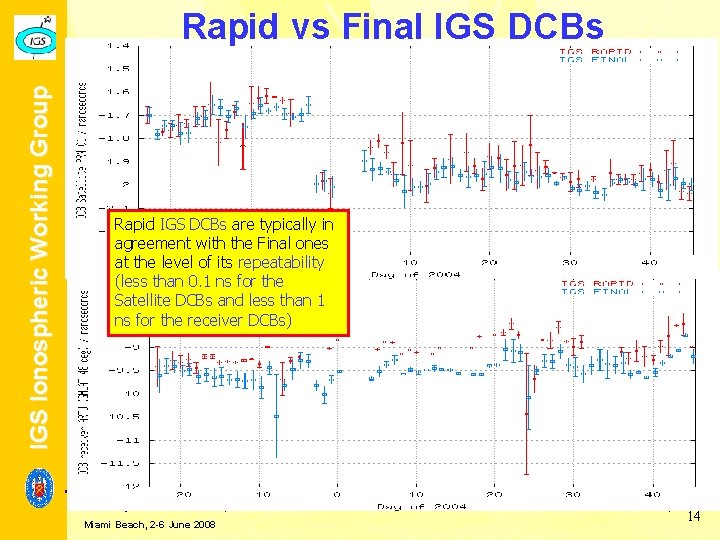
IGS Ionospheric Working Group Rapid vs Final IGS DCBs Rapid IGS DCBs are typically in agreement with the Final ones at the level of its repeatability (less than 0. 1 ns for the Satellite DCBs and less than 1 ns for the receiver DCBs) IGS Analysis Center Workshop 2008 Miami Beach, 2 -6 June 2008 A. Krankowski and M. Hernández-Pajares 14
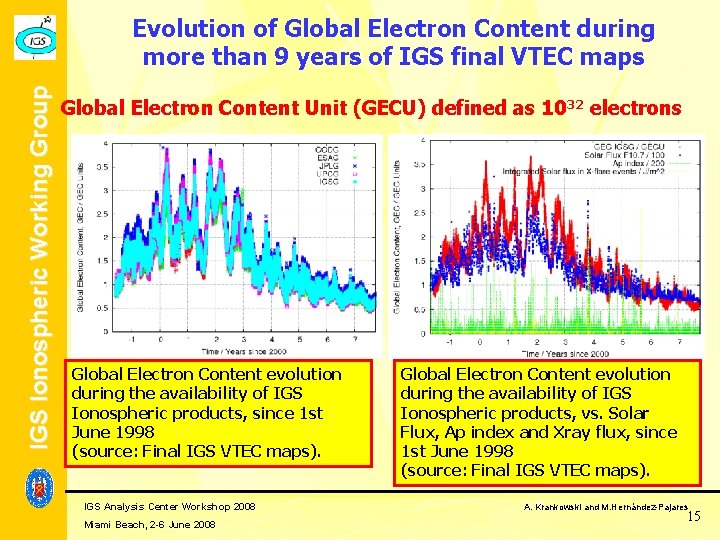
IGS Ionospheric Working Group Evolution of Global Electron Content during more than 9 years of IGS final VTEC maps Global Electron Content Unit (GECU) defined as 1032 electrons Global Electron Content evolution during the availability of IGS Ionospheric products, since 1 st June 1998 (source: Final IGS VTEC maps). IGS Analysis Center Workshop 2008 Miami Beach, 2 -6 June 2008 Global Electron Content evolution during the availability of IGS Ionospheric products, vs. Solar Flux, Ap index and Xray flux, since 1 st June 1998 (source: Final IGS VTEC maps). A. Krankowski and M. Hernández-Pajares 15
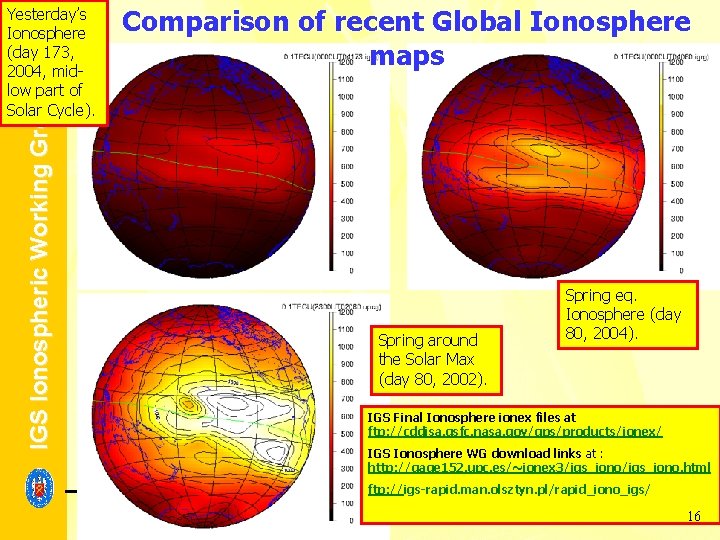
Comparison of recent Global Ionosphere maps IGS Ionospheric Working Group Yesterday’s Ionosphere (day 173, 2004, midlow part of Solar Cycle). Spring around the Solar Max (day 80, 2002). Spring eq. Ionosphere (day 80, 2004). IGS Final Ionosphere ionex files at ftp: //cddisa. gsfc. nasa. gov/gps/products/ionex/ IGS Ionosphere WG download links at : http: //gage 152. upc. es/~ionex 3/igs_iono. html ftp: //igs-rapid. man. olsztyn. pl/rapid_iono_igs/ IGS Analysis Center Workshop 2008 Miami Beach, 2 -6 June 2008 A. Krankowski and M. Hernández-Pajares 16
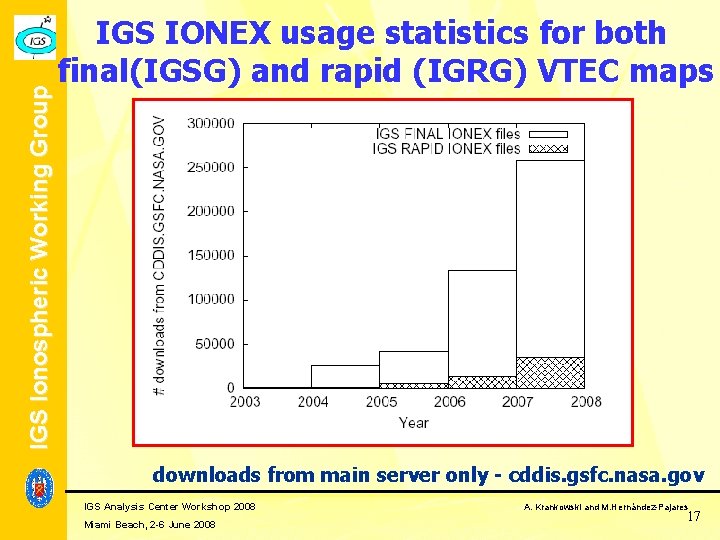
IGS Ionospheric Working Group IGS IONEX usage statistics for both final(IGSG) and rapid (IGRG) VTEC maps downloads from main server only - cddis. gsfc. nasa. gov IGS Analysis Center Workshop 2008 Miami Beach, 2 -6 June 2008 A. Krankowski and M. Hernández-Pajares 17
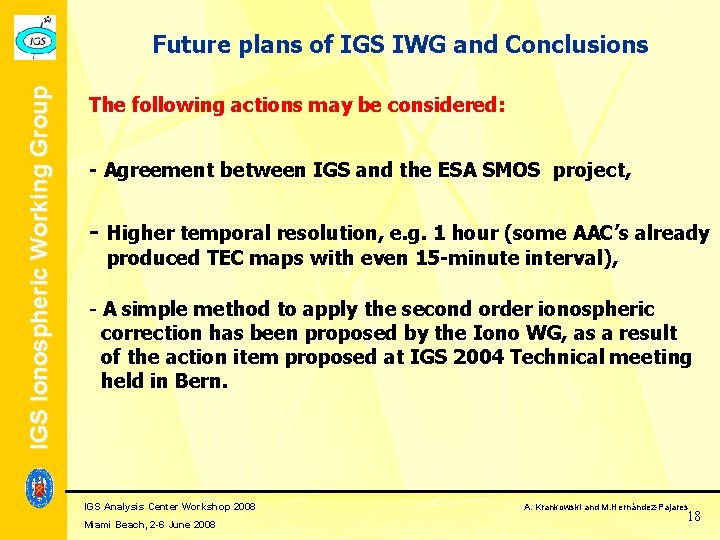
IGS Ionospheric Working Group Future plans of IGS IWG and Conclusions The following actions may be considered: - Agreement between IGS and the ESA SMOS project, - Higher temporal resolution, e. g. 1 hour (some AAC’s already produced TEC maps with even 15 -minute interval), - A simple method to apply the second order ionospheric correction has been proposed by the Iono WG, as a result of the action item proposed at IGS 2004 Technical meeting held in Bern. IGS Analysis Center Workshop 2008 Miami Beach, 2 -6 June 2008 A. Krankowski and M. Hernández-Pajares 18
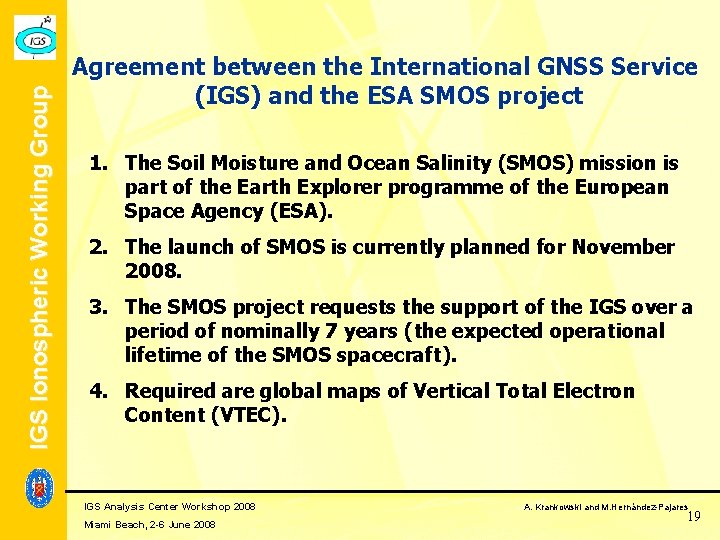
IGS Ionospheric Working Group Agreement between the International GNSS Service (IGS) and the ESA SMOS project 1. The Soil Moisture and Ocean Salinity (SMOS) mission is part of the Earth Explorer programme of the European Space Agency (ESA). 2. The launch of SMOS is currently planned for November 2008. 3. The SMOS project requests the support of the IGS over a period of nominally 7 years (the expected operational lifetime of the SMOS spacecraft). 4. Required are global maps of Vertical Total Electron Content (VTEC). IGS Analysis Center Workshop 2008 Miami Beach, 2 -6 June 2008 A. Krankowski and M. Hernández-Pajares 19
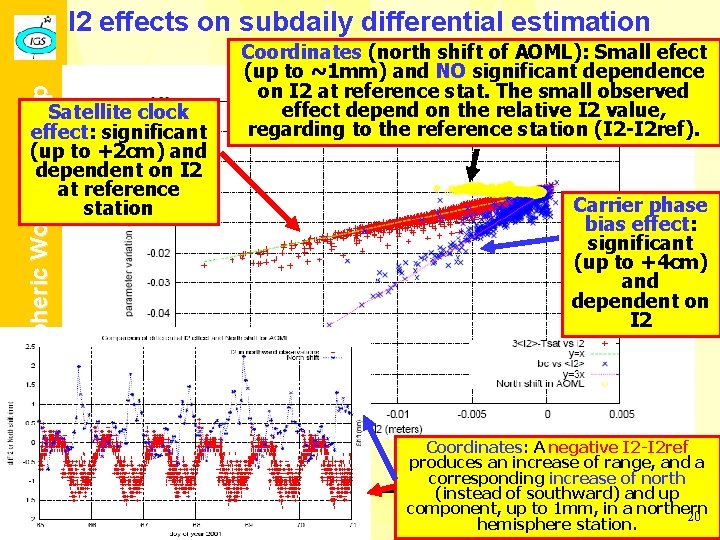
IGS Ionospheric Working Group I 2 effects on subdaily differential estimation Satellite clock effect: significant (up to +2 cm) and dependent on I 2 at reference station Coordinates (north shift of AOML): Small efect (up to ~1 mm) and NO significant dependence on I 2 at reference stat. The small observed effect depend on the relative I 2 value, regarding to the reference station (I 2 -I 2 ref). IGS Analysis Center Workshop 2008 Miami Beach, 2 -6 June 2008 Carrier phase bias effect: significant (up to +4 cm) and dependent on I 2 Coordinates: A negative I 2 -I 2 ref produces an increase of range, and a corresponding increase of north (instead of southward) and up Krankowski and M. Hernández-Pajares component, up. A. to 1 mm, in a northern 20 hemisphere station.
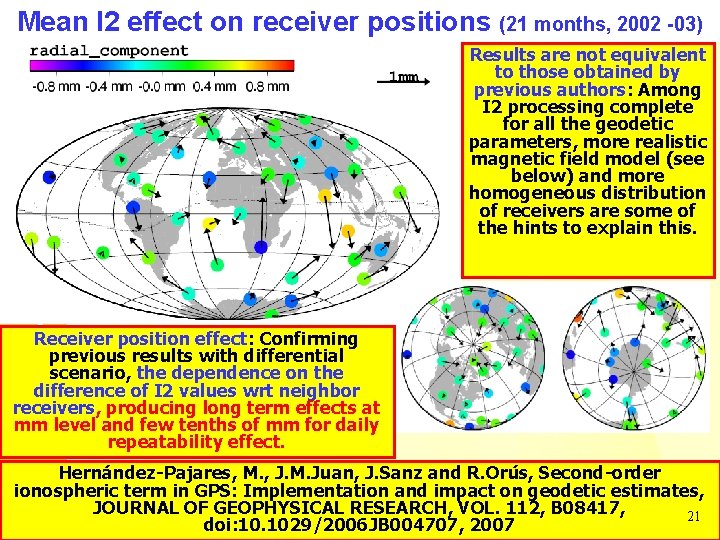
IGS Ionospheric Working Group Mean I 2 effect on receiver positions (21 months, 2002 -03) Results are not equivalent to those obtained by previous authors: Among I 2 processing complete for all the geodetic parameters, more realistic magnetic field model (see below) and more homogeneous distribution of receivers are some of the hints to explain this. Receiver position effect: Confirming previous results with differential scenario, the dependence on the difference of I 2 values wrt neighbor receivers, producing long term effects at mm level and few tenths of mm for daily repeatability effect. Hernández-Pajares, M. , J. M. Juan, J. Sanz and R. Orús, Second-order ionospheric term in GPS: Implementation and impact on geodetic estimates, IGS Analysis Center Workshop 2008 A. Krankowski and M. Hernández-Pajares JOURNAL OF GEOPHYSICAL RESEARCH, VOL. 112, B 08417, 21 Miami Beach, 2 -6 June 2008 doi: 10. 1029/2006 JB 004707, 2007
IGS Ionospheric Working Group Conclusions Long series of IGS VTEC maps offers a very good source with high both spatial and temporal resolution, to get significant spectral results. Future improvements are determined by the users requirements (the number of users has significantly increased during the last years). A good example is the recent interest of SMOS ESA mission on using the IGS VTEC maps, including predicted products. A long time series of accurate global VTEC values are available since 1998, which are freely available for scientific or technical usage, with latencies of about 12 days (final product) or >1 -2 days (rapid product). Thanks to the cooperative effort developed within the IGS framework and the international scientific community this open service will hopefully continue its evolution during the next years, sensitive to both new user needs and scientific achievements. Hernández-Pajares, M. , J. M. Juan, J. Sanz, R. Orús, A. Garcia-Rigo, J. Feltens A. Komjathy, S. C. Schaer, A. Krankowski, The IGS VTEC maps: A reliable source of ionospheric information since 1998, IGS Analysis Center Workshop 2008 A. Krankowski and M. Hernández-Pajares 22 submitted to Journal of Geodesy Miami Beach, 2 -6 June 2008