
Space Weather and ionospheric storms Researchers viewpoint Kirsti


- Slides: 27
Space Weather and ionospheric storms – Researcher’s viewpoint Kirsti Kauristie, Finnish Meteorological Institute Special Thanks: J. Norberg (FMI), A. Aikio and T. Nygren (University of Oulu)
Contents • Space weather: What and why? • Interesting processes and structures in the ionosphere • Probing ionosphere with radio waves • Why forecasting is difficult? 30. 11. 2020 SRAL Syyspäivät 2015 2
Space weather 30. 11. 2020 3
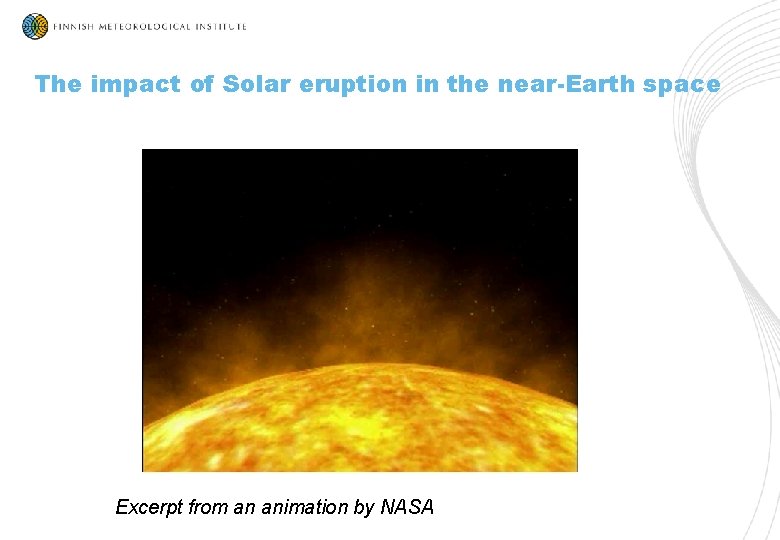
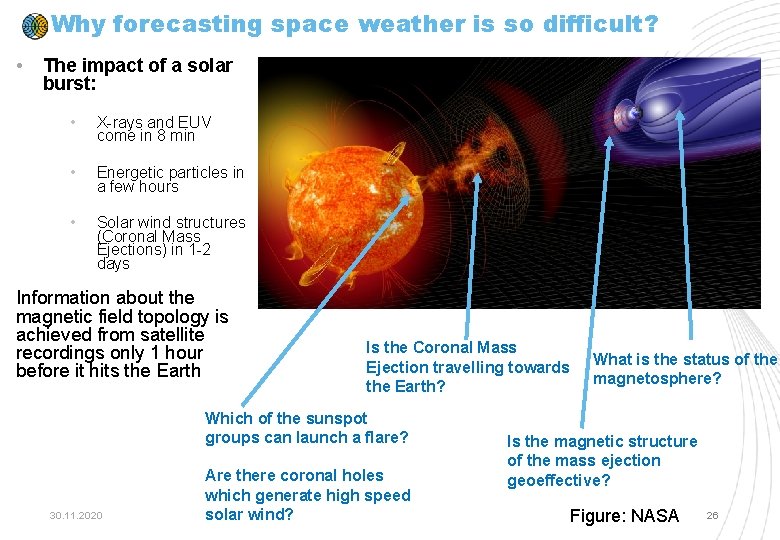
The impact of Solar eruption in the near-Earth space Excerpt from an animation by NASA
Space weather has two faces • Solar eruptions cause rapid variations in the magnetospheric and ionospheric conditions • Geomagnetic field guides processes particularly to the vicinity of magnetic poles • Manifestations: • Beautiful auroras • Potential problems in technology on ground and in space Photo: Jouni Jussila 5
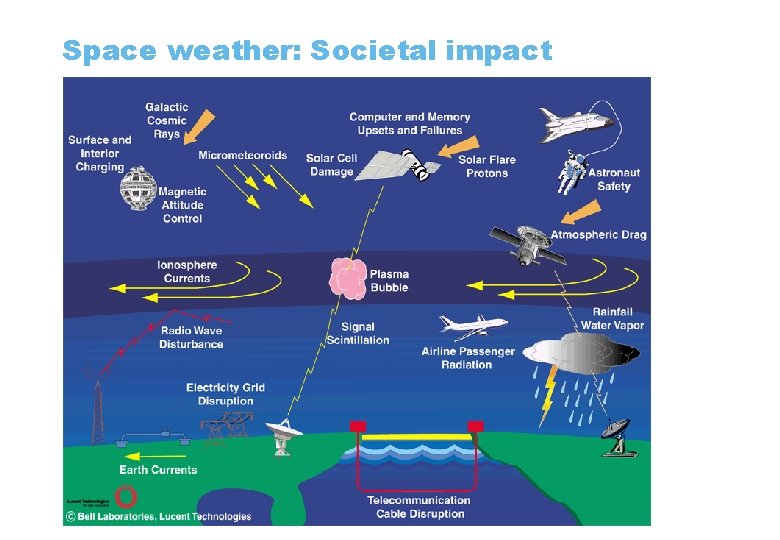
Space weather: Societal impact
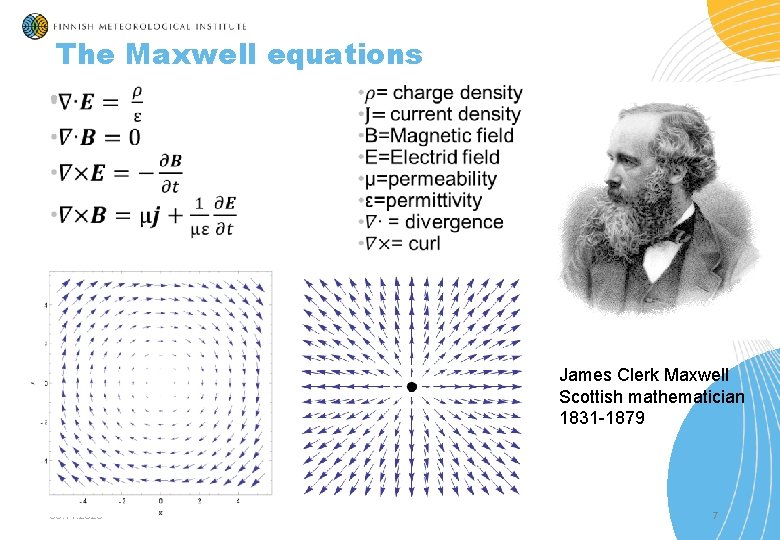
The Maxwell equations • James Clerk Maxwell Scottish mathematician 1831 -1879 30. 11. 2020 7
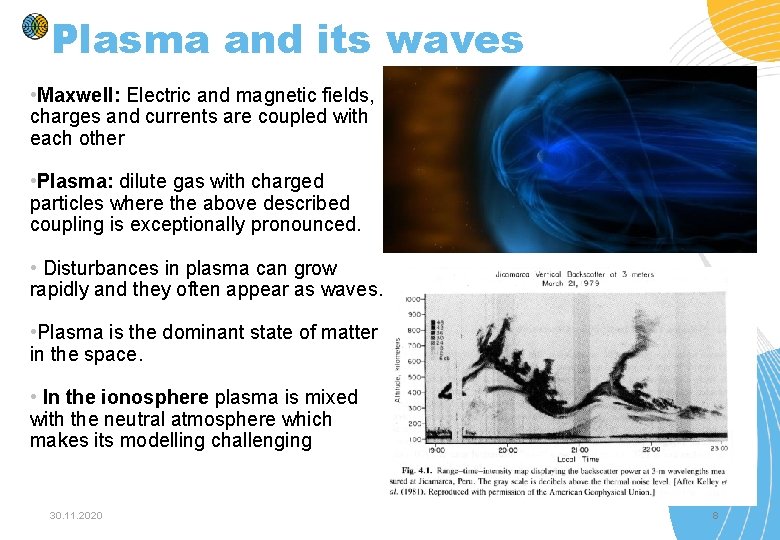
Plasma and its waves • Maxwell: Electric and magnetic fields, charges and currents are coupled with each other • Plasma: dilute gas with charged particles where the above described coupling is exceptionally pronounced. • Disturbances in plasma can grow rapidly and they often appear as waves. • Plasma is the dominant state of matter in the space. • In the ionosphere plasma is mixed with the neutral atmosphere which makes its modelling challenging 30. 11. 2020 8
Ionosphere 30. 11. 2020 9
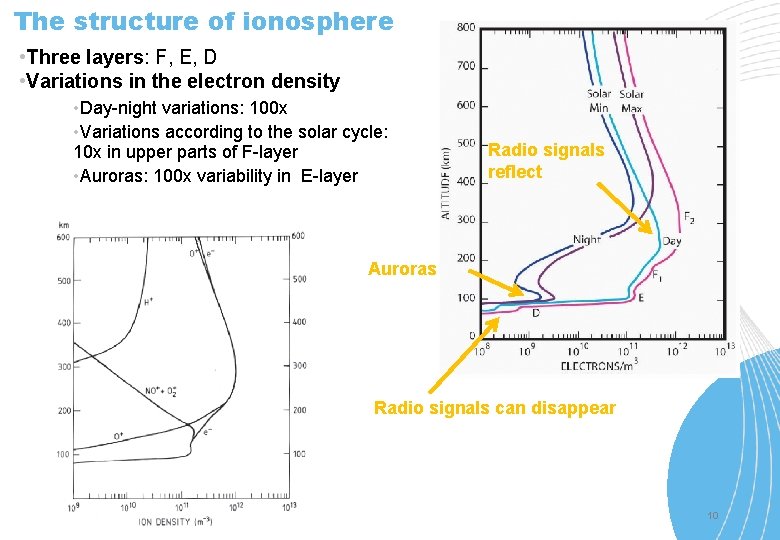
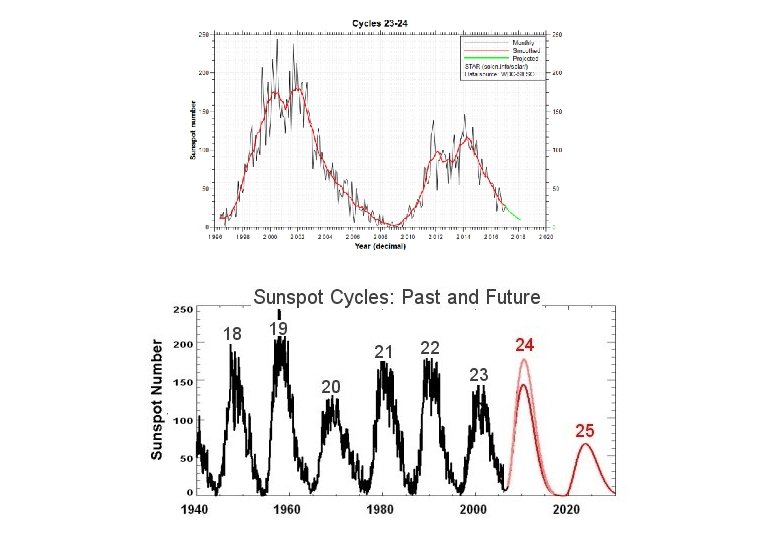
The structure of ionosphere • Three layers: F, E, D • Variations in the electron density • Day-night variations: 100 x • Variations according to the solar cycle: 10 x in upper parts of F-layer • Auroras: 100 x variability in E-layer Radio signals reflect Auroras Radio signals can disappear 30. 11. 2020 10
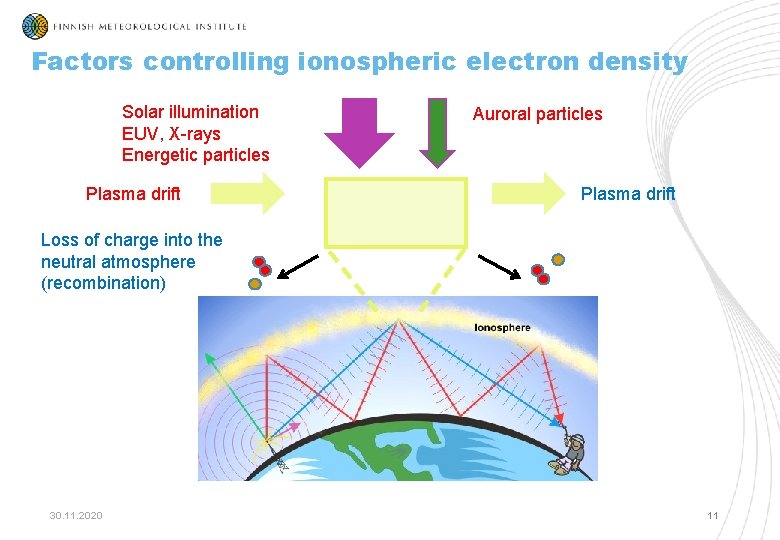
Factors controlling ionospheric electron density Solar illumination EUV, X-rays Energetic particles Plasma drift Auroral particles Plasma drift Loss of charge into the neutral atmosphere (recombination) 30. 11. 2020 11
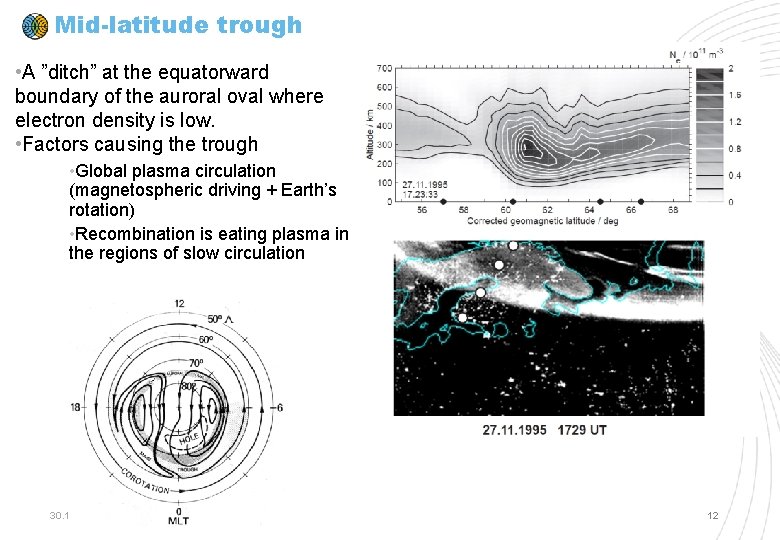
Mid-latitude trough • A ”ditch” at the equatorward boundary of the auroral oval where electron density is low. • Factors causing the trough • Global plasma circulation (magnetospheric driving + Earth’s rotation) • Recombination is eating plasma in the regions of slow circulation 30. 11. 2020 12
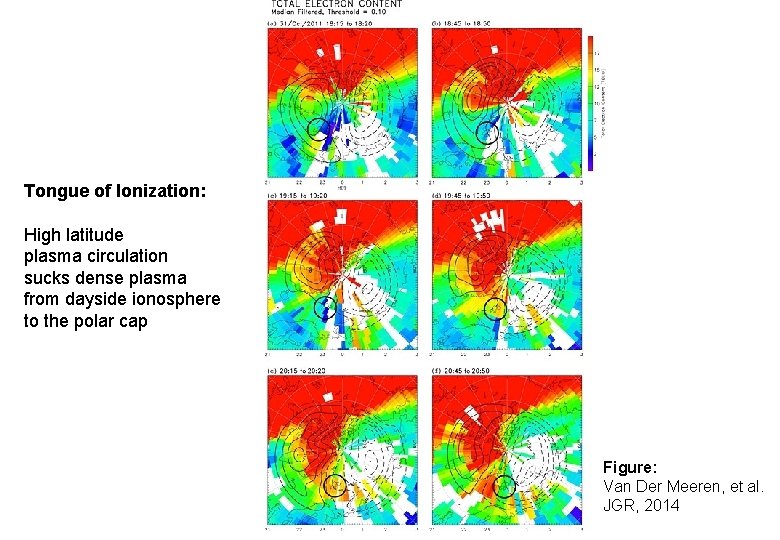
Tongue of Ionization: High latitude plasma circulation sucks dense plasma from dayside ionosphere to the polar cap Figure: Van Der Meeren, et al. JGR, 2014
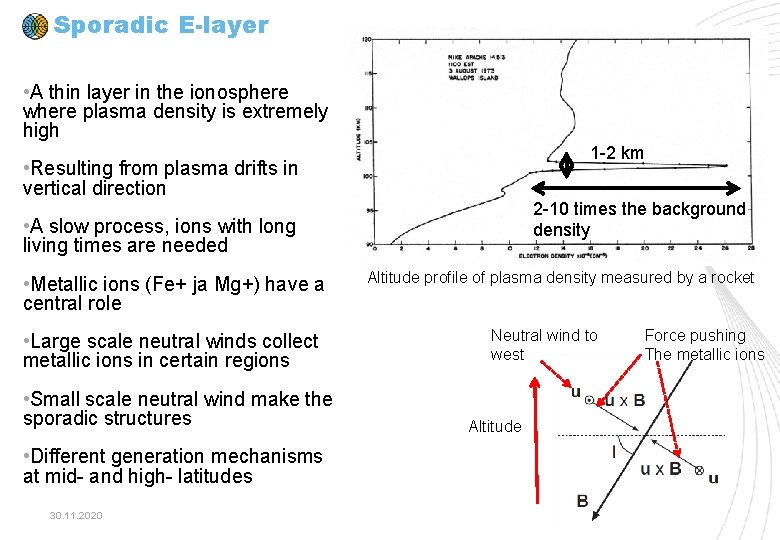
Sporadic E-layer • A thin layer in the ionosphere where plasma density is extremely high 1 -2 km • Resulting from plasma drifts in vertical direction 2 -10 times the background density • A slow process, ions with long living times are needed • Metallic ions (Fe+ ja Mg+) have a central role • Large scale neutral winds collect metallic ions in certain regions • Small scale neutral wind make the sporadic structures Altitude profile of plasma density measured by a rocket Neutral wind to west Force pushing The metallic ions Altitude • Different generation mechanisms at mid- and high- latitudes 30. 11. 2020 14
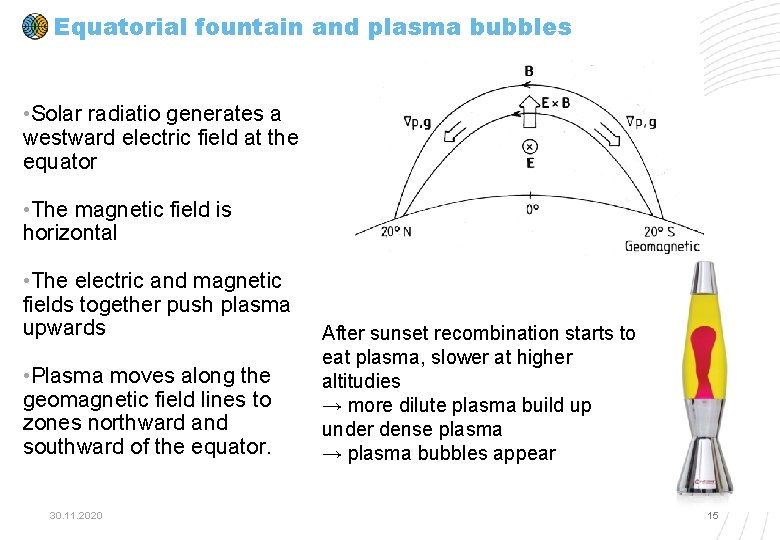
Equatorial fountain and plasma bubbles • Solar radiatio generates a westward electric field at the equator • The magnetic field is horizontal • The electric and magnetic fields together push plasma upwards • Plasma moves along the geomagnetic field lines to zones northward and southward of the equator. 30. 11. 2020 After sunset recombination starts to eat plasma, slower at higher altitudies → more dilute plasma build up under dense plasma → plasma bubbles appear 15
Probing with radio waves 30. 11. 2020 16
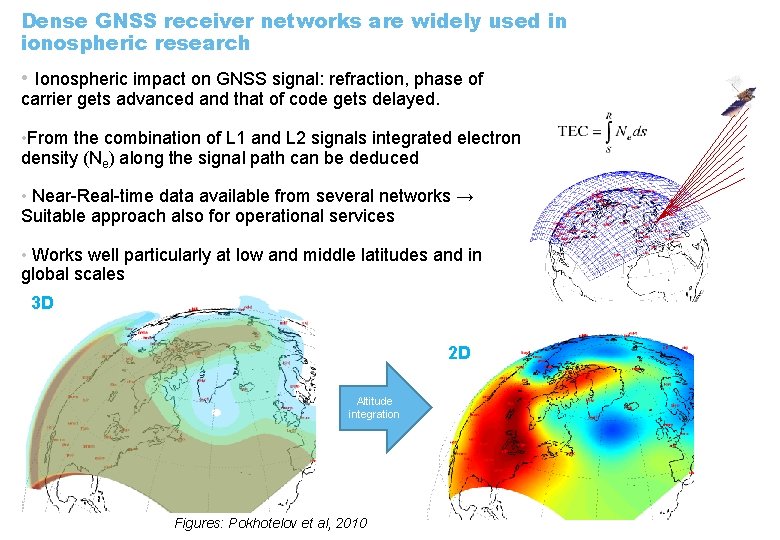
Dense GNSS receiver networks are widely used in ionospheric research • Ionospheric impact on GNSS signal: refraction, phase of carrier gets advanced and that of code gets delayed. • From the combination of L 1 and L 2 signals integrated electron density (Ne) along the signal path can be deduced • Near-Real-time data available from several networks → Suitable approach also for operational services • Works well particularly at low and middle latitudes and in global scales 3 D 2 D Altitude integration Figures: Pokhotelov et al, 2010
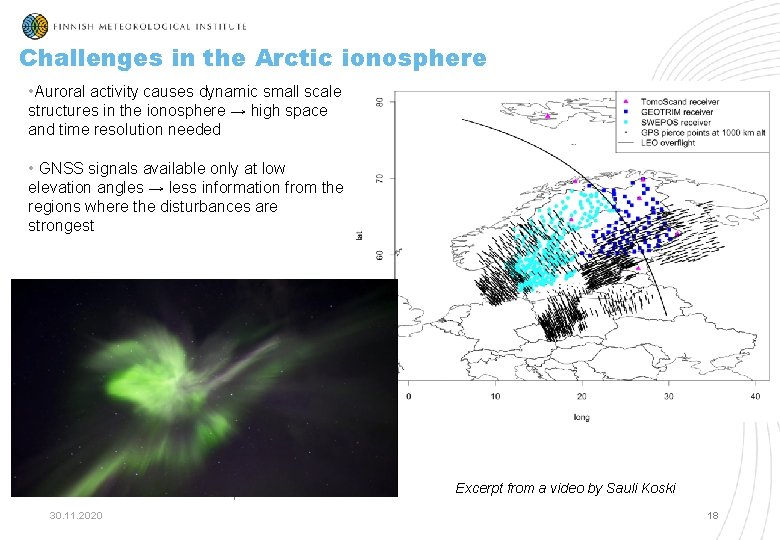
Challenges in the Arctic ionosphere • Auroral activity causes dynamic small scale structures in the ionosphere → high space and time resolution needed • GNSS signals available only at low elevation angles → less information from the regions where the disturbances are strongest Excerpt from a video by Sauli Koski 30. 11. 2020 18
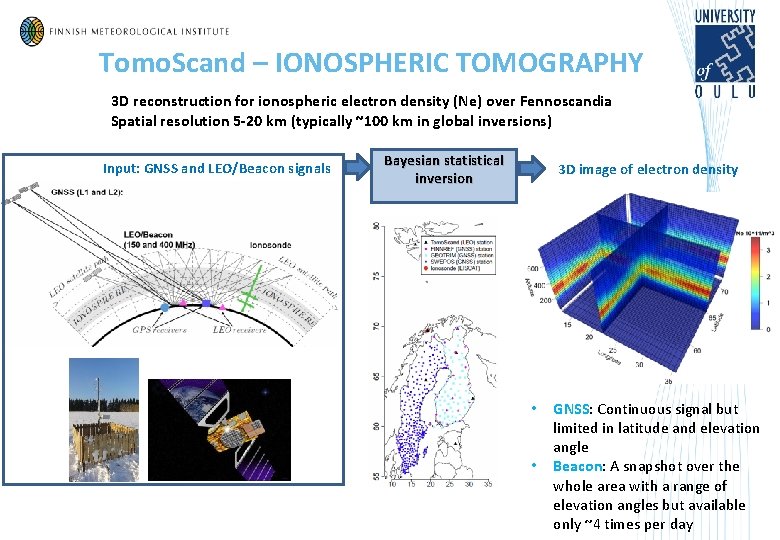
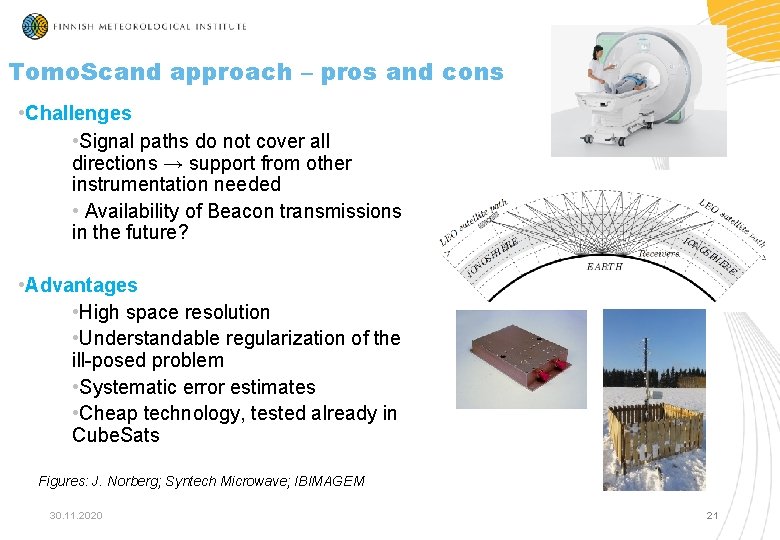
Tomo. Scand – IONOSPHERIC TOMOGRAPHY 3 D reconstruction for ionospheric electron density (Ne) over Fennoscandia Spatial resolution 5 -20 km (typically ~100 km in global inversions) Input: GNSS and LEO/Beacon signals Bayesian statistical inversion 3 D image of electron density • • GNSS: Continuous signal but limited in latitude and elevation angle Beacon: A snapshot over the whole area with a range of elevation angles but available only ~4 times per day
Tomo. Scand approach – pros and cons • Challenges • Signal paths do not cover all directions → support from other instrumentation needed • Availability of Beacon transmissions in the future? • Advantages • High space resolution • Understandable regularization of the ill-posed problem • Systematic error estimates • Cheap technology, tested already in Cube. Sats Figures: J. Norberg; Syntech Microwave; IBIMAGEM 30. 11. 2020 21
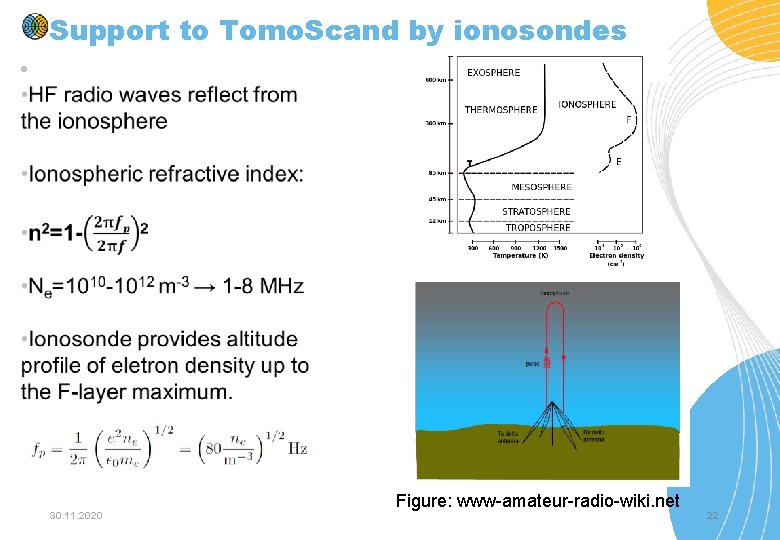
Support to Tomo. Scand by ionosondes • 30. 11. 2020 Figure: www-amateur-radio-wiki. net 22
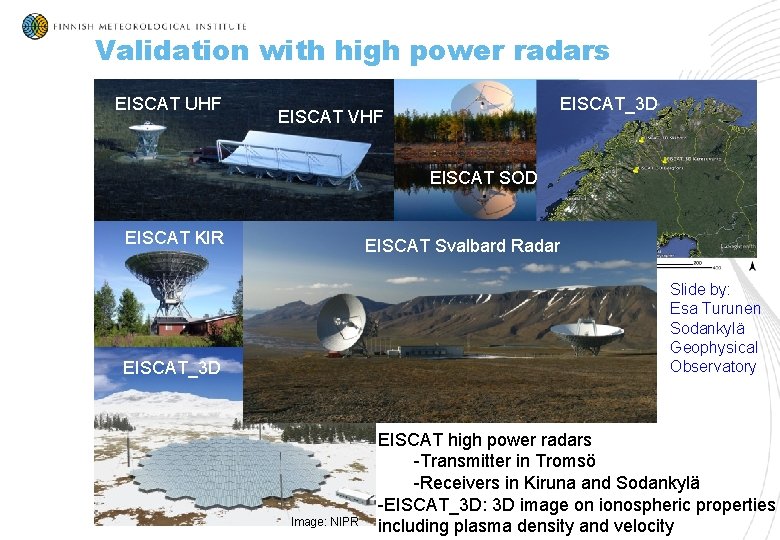
Validation with high power radars EISCAT UHF EISCAT_3 D EISCAT VHF EISCAT SOD EISCAT KIR EISCAT Svalbard Radar Slide by: Esa Turunen Sodankylä Geophysical Observatory EISCAT_3 D Image: NIPR EISCAT high power radars -Transmitter in Tromsö -Receivers in Kiruna and Sodankylä -EISCAT_3 D: 3 D image on ionospheric properties including plasma density and velocity
Societal impact & challenges 30. 11. 2020 24
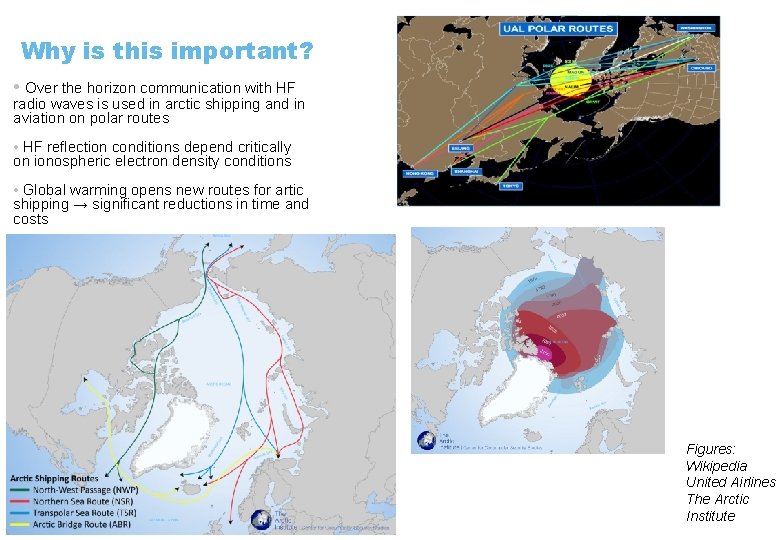
Why is this important? • Over the horizon communication with HF radio waves is used in arctic shipping and in aviation on polar routes • HF reflection conditions depend critically on ionospheric electron density conditions • Global warming opens new routes for artic shipping → significant reductions in time and costs Figures: Wikipedia United Airlines The Arctic Institute
Why forecasting space weather is so difficult? • The impact of a solar burst: • X-rays and EUV come in 8 min • Energetic particles in a few hours • Solar wind structures (Coronal Mass Ejections) in 1 -2 days Information about the magnetic field topology is achieved from satellite recordings only 1 hour before it hits the Earth Is the Coronal Mass Ejection travelling towards the Earth? Which of the sunspot groups can launch a flare? 30. 11. 2020 Are there coronal holes which generate high speed solar wind? What is the status of the magnetosphere? Is the magnetic structure of the mass ejection geoeffective? Figure: NASA 26
Thanks for your attention!