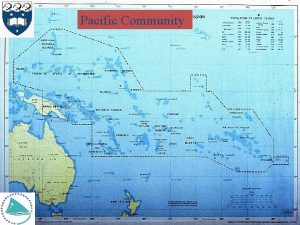
South Pacific Ocean and SPICE Jets around Vanuatu


- Slides: 70

South Pacific Ocean and SPICE: Jets around Vanuatu and New Caledonia from an inverse box model A. Ganachaud JISAO/PMEL/NOAA LEGOS / IRD Nouméa-Toulouse Laboratoire d’Etudes Géophysiques et d’Océanographie Spatiale L. Gourdeau (LEGOS/IRD-Noumea) W. Kessler (PMEL) Black (1851)

Billy Kessler Eddie Bernard Dennis Moore Vallapha, Ansley, Ryan and Tracy, . . . and MANY dear friends and colleagues

1. South Equatorial Current, Outline jets and climate 2. The SECALIS cruise series 3. An inverse model SO L PNG OM Solomon ON Sea IS. 4. SPICE CA LE U N. AT NU VA Coral Sea of SECALIS-2 and SECALIS-3 DO NI A AUSTRALIA Tasman Sea NEW ZEALAND Fiji

The Southwest Pacific Atmosphere SP Tra CZ de win ds A A Trade w inds

Decadal influences: Thermocline water connection between the subduction zone of the South East Pacific and the equator Lines show geostrophic streamlines on the isopycnal (courtesy B. Kessler)

Decadal influences: Thermocline water connection Giese et al. 2002: T on sigma=25 (EUC core) from the Southeast Pacific preceeds Nino-3 by 7 years Giese et al. 2002, Schneider 2004, Luo et al. 2005 TO Izumo et al. , 2002: Origins of Nino 3 waters WBC 8°S, East to West UPWELLING AUSTRALIA A temperature anomaly on sigma=25 SST TO EAST Equator SST

The South Pacific "Thermocline" waters South Equatorial Current Salinity maximum Z=100: 300 m Temperature/salinity diagram

Southwest Pacific Topography SO L PNG OM Solomon ON Sea CA LE U N. AT NU VA Coral Sea IS. DO NI A AUSTRALIA Tasman Sea NEW ZEALAND Fiji

Thermocline water currents: 0 -300 m ~25 Sv

Thermocline water currents 0 -300 m 70 % EUC waters ~15 Sv ~25 Sv

Thermocline water currents 0 -300 m ~15 Sv ~25 Sv ~10 Sv

Jets in numerical models OCCAM model, Webb, JPO, 2000

The South West Pacific Ocean: poorly sampled and poorly understood Sokolov and Rintoul (2000) Qu and Lindstrom (2002) Ridgway and Dunn (2003) Active Argo floats on 08/17/2007 Distribution of the (T, S) casts (Ridgway and Dunn, 2003)

The South West Pacific Ocean: poorly sampled and poorly understood Sokolov and Rintoul (2000) Qu and Lindstrom (2002) Ridgway and Dunn (2003) Active Argo floats on March 4, 2008 Distribution of the (T, S) casts (Ridgway and Dunn, 2003)

The SEC-ALIS cruises VA ? ? NU AT CA NE LE W DO N ? U S E C IA Transport between New Caledonia and Vanuatu: • Andrew and Clegg (1989): southeastward (!) • Sokolov and Rintoul (2000): 41 Sv • Climatology: 10 -12 Sv • Island Rule: 10 -11 Sv • Numerical models: Various • Existence of a boundary current to the northwest? • To the southeast ? RV ALIS

The SEC-ALIS cruises ? ? ? RV ALIS SECALIS-1: Jul 2003 SECALIS-3: Jul 2005 SECALIS-2: Dec 2004 SECALIS-4: Nov 2006

Cruise Secalis-2 • December 2004 : snapshot of the circulation, chasing the jets GUESS • Terrible winch but good mechanics • Closed box, inverse box model by requiring mass, heat and salt conservation within isopycnal layers • 2000 -db reference level

SECALIS-2: Water mass SLW AAIW

South Pacific Tropical Water (SPTW)/ Subtropical Lower Water 200 m In the core of the EUC, in the lower salinity maximum (S=24. 3/24. 5) Warm SPTW (21°C) COLD SLW (16/20°C) S=25. 5

Subantarctic Mode Water (SAMW) 600 m formed north of the ACC (S=27)

Antarctic Intermediate Water (AAIW) northern limit 5. 4°, 800 m salinity minimum formed in the southeast PF (50°S-60°S) (S=27. 2)

"Oxygen minimum" water (Wyrtki 1962) 1500 -2000 m formation ? ? (S=27. 6)

Inverse model formulation

Inverse model formulation Define vertical layers; Write cons. Equation for: • Mass • Heat (anomaly) • Salt (anomaly) Including Ekman transports

North Caledonian JET NCJ GUESS Inverse model estimate for the velocity field: 50 cm/s, 15± 2. 6 Sv, deep shear

Oceanic circulation in Dec 2004 Inverse model Ganachaud, Gourdeau, Kessler, JPO, 2008 OCCAM 1/12° 2004 average above σ=26 below σ=26

Oceanic circulation in Dec 2004 Ganachaud, Gourdeau, Kessler, JPO, 2008 Transport 0 -2000 m 14 Sv 20 Sv 9 above σ=26 below σ=26 6. 5 OCCAM 1/12° 2004 average

Net transports in Dec 2004 and July 2005 Net transports (Sv) December 2004 5 Net transports (Sv) July 2005 19 5 3 20 4 10 5 4 21 5 9 0 39 6 9 14

Upper 300 m transports in Dec 2004 and July 2005 Upper layer transports (Sv) December 2004 4. 5 0 Upper layer transports (Sv) July 2005 1 15 1 8. 5 1 4 above σ=26 below σ=26 . 4 22 2 6. 5 2. 5 1 9. 5 1 1 . 6

Net Heat transports Net transports (Sv) December 2004 0. 7 0 above σ=26 below σ=26 0. 2 Net transports (Sv) July 2005 2. 6 0. 3 PW

Glider measurements, 2005 (Gourdeau, Kessler, Davis, Sherman) U, T and S • Prototype, Scripps OI, San Diego • Dropped July 17 th, 2005 • Recovered october 18 th, 2005 C. Maes, IRD

Glider measurements, 2005 (Gourdeau, Kessler, Davis, Sherman) glider cruise Gourdeau et al. 2007 Transport is similar to CTDLADCP estimate

Conclusions on SECALIS program A regional picture of the SEC splitting and jet formation east of New Caledonia is emerging: • 2004 cruise: NCJ, SCJ characterized • 2005/2006 cruise: NCJ, NVJ and Glider feasibility (July/November) • The NCJ shear is deep (700 m-1500 m) so that XBTs miss it • Ongoing work: – Mean circulation and variability from Secalis, glider surveys and models – XCTD/XBT/Argo monitoring – SPICE

Interests in the Coral and Tasman Sea circulation R/V ORSOM III, 1956 interisland flows Rotschi, Legand, Hamon Cronulla, August 1958 Conference on the Coral and Tasman Sea Oceanography Cairns, August 2005 Workshop on the Southwest Pacific Ocean Circulation and its relation with Climate

Southwest Pac. Ific Ocean Circulation and Climate Experiment: SPICE W. Kessler (PMEL/NOAA) G. Brassington(BOM) R. Mechoso (UCLA) S. Wijffels, K. Ridgway, W. Cai (CSIRO) N. Holbrook (MU) P. Sutton, M. Bowen (NIWA) B. Qiu, A. Timmermann (UH) D. Roemmich, J. Sprintall (SIO), D. Neelin, B. Lintner (UCLA) H. Diamond (NOAA/NCDC) S. Cravatte, L. Gourdeau (LEGOS) P. Eastwood (SOPAC, Fiji) T. Aung (USP/Fiji) Black (1851)

Southwest Pac. Ific Ocean Circulation and Climate Experiment Objectives: 1 -Understand the SW Pacific in climate / CGCM incl. SPCZ 2 -Measure air-sea fluxes and currents in the -Coral, -Solomon -and Tasman seas Objectives: 3 -Combine obs with modeling to elaborate a monitoring plan 4 -Determine local oceanic environment influences

Southwest Pac. Ific Ocean Circulation and Climate Experiment Objectives: 1 -Understand the SW Pacific in climate / CGCM incl. SPCZ 2 -Measure air-sea fluxes and currents in the -Coral, -Solomon -and Tasman seas Objectives: 3 -Combine obs with modeling to elaborate a monitoring plan 4 -Determine local oceanic environment influences

South Pacific Convergence Zone COADS cloudiness 1960 -1970 20 th century climate model High convective activity, precipitation, wind convergence -Dominant convective feature in the Southern Hemisphere -Substantial variability: (intra) seasonal; interannual; Equatorward shift 1976 -Unresolved southward bend, poorly modelled -Strong local effects (SSS, oceanic heat content)

Thermocline water currents 0 -300 m 3 -Solomon Sea 1 -Inflows 2 -Tasman Sea

2 -EAC and EAUC Equatorial Undercurrent Equatorial upwelling South Equatorial Current East Australian Current EAC variability: Tasman Front Relation w/ climate/ENSO Eddy generation Air-Sea fluxes

SWPacific and Climate EAC and the Tasman Front The Southward Pacific WBC which closes the subtropical gyre (Ridgway and Dunn, 2003)

Solomon Sea: A WBC pathway to feed the EUC and ITF Equatorial Undercurrent Equatorial upwelling Solomon Sea South Equatorial Current East Australian Current Tasman Front

VI TI A Z G EO ST R G SO ES LO M O N Solomon Sea: A WBC pathway to feed the EUC and ITF NVJ NCJ CARS dynamic Ht relative to 2000 m (C. W. Kessler) Quasi undocumented circulation WEPOCS cruises, 1985 (Lindstrom et al. , 1987; Tsuchiya et al. , 1989; Fine et al. , 1994)

3 -North Coral Sea: A WBC pathway to feed the EUC and ITF • Narrow straits, difficult to model • Strong WBC, mixing • Strong variability: monsoon, ENSO 0 -200 m SADCP currents, May 1993 Blue: 2007 glider trajectory (C. W. Kessler)

Solwara Pilot study Accomplished: 1. Flusec cruise (inflow) 2. Glider (inflow) To do: 1. Mooring in key straits 2. Glider monitoring 3. Plans in the NQC/Papua Gulf SOLWARA project (IRD-PMEL-SIO-CSIRO, submitted

Ocean and climate impacts on environment in the southwest Pacific Consequences of ocean and climate fluctuations: – Biodiversity, Coral reefs – Freshwater-agriculture and health – Tropical cyclones – Sea surface height Pacific Island Countries: Fragile ecosystems, low-lying populated areas, isolated places Australia and New Zealand: Climate depends on heat content in the Tasman Sea Freshwater resources critical Important changes in biodiversity SST Trend (°C/century) ERSST data (1944 -2005)

Interannual influences: ENSO and cyclones Courtesy J. Salinger La Niña - Tropical Cyclone Density

Downscaling climate and ocean models J. Lefevre, IRD Need to link between large-scale oceanography, coastal island oceanography, and impacts on climate and environment New Caledonia Upwelling (A. Vega, M. Despinoy)

Towards a regional field experiment 2010 2007+ 2005+ 2004+ 2008 2007+ 2008 running TBS

Modelling strategy: regional zooms 1. 2. 3. Help to design observation / monitoring program Sensitivity experiments Regional applications CSIRO/BOM UH/LOCEAN UH/LEGOS IRD/NIWA IRD/CNRS/CNES/IFREMER/METEOFRANCE/SHOM

Towards a regional field experiment: Existing large scale programs UW/CSIRO/IRD SIO/CSIRO/IRD BOM/MF BOM/IRD IMOS/Bluewater and climate


Tentative timetable

Glider measurements, 2005 (Gourdeau, Kessler, Davis, Sherman) 580 CTD profiles down to 600 meters Absolute geostrophic velocity field Temperature NVJ NJC Gourdeau et al. 2007 Salinity

1 -Modeling strategy: regional zooms 1. Help to design observation then monitoring program 2. Sensitivity experiments 3. Regional applications High resolution global/regional ocean, atmosphere and climate models Blue Link (CSIRO/BOM) ROMS/Mercator (IRD Nouméa)

Towards a large scale field experiment Existing observations Sokolov and Rintoul (2000) Qu and Lindstrom (2002) Ridgway and Dunn (2003) Maximenko (2005) Active Argo floats on 08/17/2007 Distribution of the (T, S) casts (Ridgway and Dunn, 2003) Sattelite-derived surface currents

2: EAC and the Tasman Front Interannual Variability (Sea level anomaly) 1996 SST Trend (°C/century) ERSST data (1944 -2005) 2000 Global Climate Model Forecast Mk 3 2070 Surface Temperature O’Farrell, 2005

Interannual influences: thermocline transport modulation Courtesy B. Kessler • Interannual time scale: El Niño influences the SW Pacific Circulation (Delcroix and hénin, 1989; Sprintall et al. , 1995; Gouriou and Delcroix, 2002)

1 -Thermocline water inflow to the Coral Sea 162. 5°E zonal velocity (blue=westward) TO EAC TO NQC NVJ NCJ SCJ Bifurcation: Qu and Lindstrom 2002 1. Formation of 3 "jets" Kessler and Gourdeau 2006, 2007 2. Bifurcation (northward bias in GCM/CGCMs) 3. Outflows and budget

2: EAC and the Tasman Front: Critical issues Need to describe the Tasman Sea variability in the climate system: 1. EAC inflow and outflow component: robust estimates of the mean & seasonal cycle 2. Mechanism of EAC eddy generation 3. Tasman Sea heat balance and effects on air-sea fluxes and regional climate 4. Southward shift of the EAC associated with Global change

3 -North Coral Sea Critical issues Flows in Solomon Sea need explanation from models and observations • Structure of the SEC inflow components • Structure and monitoring of WBCs • Straits transport monitoring and modeling (need ~1/20° resolution). • Dynamical response: WBCs adjustment to meridional and vertical variations Need a pilot study

Downscaling…and upscaling ROMS, 1/12°, nested (Courtesy A. Vega, IRD) J. Lefevre, IRD

SPICE Challenges

SPICE Challenges 1. Modelling strategy 2. Existing programs 3. Ocean field experiment 4. SPCZ process study (? )

Towards a regional field experiment 2005+ 2004+ 2008

Towards a regional field experiment 2010 2007+ 2005+ 2004+ 2008

SPICE and CLIVAR A. Ganachaud, W. Kessler, G. Brassington, S. Wijffels, K. Ridgway, W. Cai, N. Holbrook, M. Bowen, P. Sutton, A. Timmermann, B. Qiu, D. Roemmich, J. Sprintall, H. Diamond, S. Cravatte, L. Gourdeau, T. Aung Relevance 1 -Identify key features and their impact on climate simulation on seasonal to decadal timescales 2 -Understand pertinent air-sea fluxes and oceanic currents (LLWBCs) to improve climate modelling and prediction Legacy 1 - Long term monitoring of selected features (SST, straits…) 2 -Training and transition to local benefits (application of data or operational products) "Add-on" Costs 2008 -2011 1 -Fieldwork: Shiptime: 1. 5 month/yr Wet measurements: $1. 6 M/yr HRXBT, Air-sea fluxes: funded 2 -Modelling: Infrastructures exist Specific analyses costs

Main objectives and timetable A. Ganachaud, W. Kessler, G. Brassington, S. Wijffels, K. Ridgway, W. Cai, N. Holbrook, M. Bowen, P. Sutton, A. Timmermann, B. Qiu, D. Roemmich, J. Sprintall, S. Cravatte, L. Gourdeau, T. Aung Objective 2004 -2007 1 -Role of the southwest Pacific in CGCMS (SPCZ, …) 2008 -2010 -Modelling experiments -Major SPCZ experiments ? SPCZ/ocean Session AGU 2007 2 -Air-sea fluxes and currents -SEC inflow (cruise and glider) -Gyre dynamics and jets -SEC infow monitoring -Solomon Sea exploration (model, cruise, moorings, gliders) -EAC monitoring -VOS with AWS Hull SST 3 -Monitoring key quantities -Experimental monitoring Solomon Sea -Experimental monitoring SEC and Solomon Straits 4 -Local impacts -Model downscaling (ROMS-type) -Operational prototypes -SSS-based analyses -Regionally oriented applications and training

2 -EAC and EAUC Ridgway and Dunn, (2003); Cai et al. (2003); Bowen et al. (2005) Distribution of the (T, S) casts

2 -EAC and EAUC Ridgway and Dunn, (2003); Cai et al. (2003); Bowen et al. (2005) Distribution of the (T, S) casts SSH variability C. Ken Ridgway 1. Variability dominates mean flow Similar SSH variability as other WBCs 2. Highly influenced by: • Non-linear flow instabilities • Upper-ocean topographic coupling 3. Tasman Box: Ocean heat transport changes influence regional climate (Sprintall et al. 1995, Roemmich et al. , 2005
 Spice jets
 Spice jets
 Vanuatu meteo cyclone warning
 Vanuatu coming of age tradition land divers
 Importance of pacific ocean
 Mississippi river
 Pacific ocean facts
 Label the pacific ocean
 Black hole jets
 Jets
Jets Jets
Jets Jets
Jets Jets
Jets Jets
Jets Chapter 15 ocean water and ocean life answer key
 Divergent transform convergent
 Ocean ocean convergent boundary
 Ocean to ocean convergent boundary
 Ocean ocean convergent boundary
 Scrat s continental crack up
 Ocean to ocean convergent boundary
 Blue ocean strategy canvas
 What goes around comes around example
 Goes around comes around meaning
 Amazonia azul
 Old south vs new south streetcar named desire
 What is the difference between a herb and a spice
 Riddles of spices
 Chartch
 University mobility in asia and the pacific
 Statistical institute for asia and the pacific
 Australia the pacific realm and antarctica
 Imperialism in southeast asia and the pacific
 Raguni spice
 Schneider electric spice portal
 Spice t themes
 Mali spice t chart
 Indian spice chart
 Old spice bahamas advert
 Old spice case study
 Everything is poison
 Norma spice
 Spice naif
 Iso 15504 ventajas y desventajas
 Q letter is used in spice in vlsi
 In spice letter q represents vlsi
 Modelo spice
 Q letter is used in spice vlsi
 The rice n spice international ltd
 Spice simulation
 In spice letter q represents vlsi
 Spice vlsi
 Automated spice rack
 What does figurative language mean
 What are addverbs
 Simulation program with integrated circuit emphasis
 Spice-t themes
 Factores criticos de exito
 Spice simulatore
 Frequency sweep analysis
 Song
Song Radical killer life 120
 Posh spice name
 Spice adam
 Spice stands for
 Spice computer program
 Spices and condiments difference
 Modelos spice
 Spice tutorial
 Spice document
 Spice conference


