Soil Organisms What creatures live in soil 22


 Phosphorous")

 Mostly")


 Bacteria 108")


 – Solar energy (photoautotrophs) –")


 Sunlight is limited at")


 Chlorophyll")


")


 (highly permeable)")

 dissolves calcium carbonate Carbonates are made porous by acid dissolution")


 Nitrates do not interact significantly with soil material and")


- Slides: 80
Soil Organisms
What creatures live in soil? 22 species Harvester Ant Colony
Fauna Macro Micro Mammals, reptiles, insects, earthworms Flora Nematodes, Protozoa, Rotifers 20, 000 species Plant roots, algae, fungi, actinomycetes (filamentous bacteria), bacteria unicellular
Macrofauna: Earthworms 1, 000 per acre five pairs of hearts Mostly intestine 22 ft. long (Afr. and Aus. ) Earthworm cast Casts: earthworm’s wastes Eat soil organics: 2 -30 times of their own wt.
Earthworms Abundance of earthworms – 10 -1, 000/m 3 – 3, 000 species Benefits of earthworms - soil fertility by producing cast - aeration & drainage - size & stability of soil aggregates
Soil Fungi Yeasts, molds, mushrooms 10 - 100 billion/m 2 Cell with a nuclear membrane and cell wall Most versatile & most active in acid forest soils Tolerate extremes in p. H (bacteria do not) Mycorrhizae symbiosis Association between fungi & plant root Increased SA (up to 10 times) Increased nutrient uptake, especially P
Mycorrhizae Fungi 1. Ions in solution 2. Movement from solution to root (diffusion) Phosphorous granule Fungal hyphae Root hair
Symbiosis – Fungi provide nutrients – Plant root provides carbon – Ectomycorrhiza Root surfaces and cortex in forest trees – Endomycorrhiza Penetrate root cell walls agronomic cropscorn, cotton, wheat, & rice
Soil Bacteria 10 -100 trillion/m 2 Single-celled organisms Rapid reproduction Small (<5 µm) Mostly heterotrophic Autotrophic Bacteria Impact the availability of soil nutrients (N, S)
Quantification of Soil Organisms
Quantification of Soil Organisms Three Criteria Numbers of organisms – Extremely numerous – 1, 000 -1, 000, 000 /g soil – 10, 000 species /g soil Biomass – 1 -8% of total soil organic matter Metabolic activity – Respiration: CO 2 – Proportional to # & biomass
Soil Organisms in Surface Soils Organisms #/g soil Microflora Biomass (g/m 2) Bacteria 108 -109 Actinomycetes 107 -108 Fungi 105 -106 Algae 104 -105 40 -500 100 -1, 500 1 -50 Fauna Protozoa 104 -105 Nematodes 10 -102 Mites 1 -10 Earthworms 1 -10 Note those in White 2 -20 1 -2 10 -150 1 -15
Basic Classification of Organisms Food Oxygen Energy Source
Based on food: live or dead Herbivores – Eat live plants Insects, mammals, reptiles Detritivores • Eat dead tissues: • Fungi, bacteria Predators – Eat other animals Insects, mammals, reptiles
Based on O 2 demand Aerobic – Active in O 2 rich environment – Use free oxygen for metabolism Anaerobic – Active in O 2 poor environment – Use combined oxygen (NO 3 - , SO 4 -2)
Based on energy & C source Autotrophic (CO 2) – Solar energy (photoautotrophs) – Chemical reaction w/inorganic elements N, S, & Fe (chemoautotrophs) Heterotrophic § Energy from breakdown of organic matter Most Numerous
Organisms are Major Determinants of Water Quality and the Impact or Availability of Water Pollutants Metals (Hg, Pb, As) Nutrients (N, P) Organic Chemicals (PCBs, Dioxins)
The Earliest Organisms Autotrophic: produce complex organic compounds from simple inorganic molecules and an external source of energy. Organic = Carbon-containing Chemoautotrophs, Cyanobacteria, Plants 3. 5 bya
Autotrophs – Plants, Algae, Cyanobacteria Produce complex organic compounds from carbon dioxide using energy from light. energy light 6 CO 2 + 6 H 2 O simple inorganic molecule C 6 H 12 O 6 + 6 O 2 complex organic compound Primary producers – base of the food chain
Heterotrophs Derive energy from consumption of complex organic compounds produced by autotrophs Autotrophs store energy from the sun in carbon compounds (C 6 H 12 O 6) Heterotrophs consume these complex carbon compounds for energy autotrophs carbon compounds (C 6 H 12 O 6) Heterotrophs
Organisms Heterotrophs: use carbon compounds for energy - consumers Heterotrophs Anaerobic Aerobic live in low-oxygen environments live in high oxygen environments Aerobic heterotrophs Anaerobic heterotrophs
Aerobic Heterotrophs and Anaerobic Heterotrophs
Aerobic Heterotrophs Live in high-oxygen environments Consume organic compounds for energy Obtain the energy stored in complex organic compounds by combining them with oxygen C 6 H 12 O 6 + Oxygen = energy
Aerobic Respiration C 6 H 12 O 6 + 6 O 2 → 6 CO 2 + 6 H 2 O + energy
The energy is obtained by exchanging electrons during chemical reactions. Electron poor Electron rich C 6 H 12 O 6 + 6 O 2 → 6 CO 2 + 6 H 2 O Electron rich Electron poor 2880 k. J of energy is produced Aerobic respiration is very efficient, yielding high amounts of energy
Anaerobic Heterotrophic Organisms Live in low-oxygen environments Consume organic compounds for energy Can use energy stored in complex carbon compounds in the absence of free oxygen The energy is obtained by exchanging electrons with elements other than oxygen. Nitrogen (NO 3) Sulfur (SO 4) Iron (Fe 3+)
Aerobic Respiration Electron poor Electron rich C 6 H 12 O 6 + 6 O 2 → 6 CO 2 + 6 H 2 O Electron poor Electron rich Anaerobic respiration Electron poor Electron rich C 6 H 12 O 6 + 3 NO 3 - + 3 H 2 O = 6 HCO 3 - + 3 NH 4+ Electron rich Electron poor
Anaerobic respiration is less efficient and produces less energy. C 6 H 12 O 6 + 6 O 2 → 6 CO 2 + 6 H 2 O C 6 H 12 O 6 + 3 NO 3 - + 3 H 2 O = 6 HCO 3 - + 3 NH 4+ C 6 H 12 O 6 + 3 SO 42 - + 3 H+ = 6 HCO 3 - + 3 HS- 2880 k. J 1796 k. J 453 k. J
The oxygen status of soil/water determines the type of organisms aerobic or anaerobic High-oxygen Low-oxygen Oxygen status impacts availability of nutrients as well As the availability and toxicity of some pollutants
Example: Eutrophication Nutrient Additions Nutrient addition increases primary productivity (algae) Sunlight is limited at greater depth Photosynthetic life O 2 bacteria Photoautotrophs die and become food for aerobic heterotrophs Aerobic autotrophs consume oxygen Oxygen content in water is reduced If oxygen is reduced sufficiently, aerobic microbes cannot survive, and anaerobic microbes take over
Respiration and Still Ponds O 2 NO 3 - Aerobic heterotrophs consume oxygen Heterotrophic Organisms Anaerobic heterotrophs Use nitrate instead of O 2 oxygen SO 4 -2 Anaerobic heterotrophs Use sulfate instead of O 2 HS- C 6 H 12 O 6 + 3 SO 42 - + 3 H+ = 6 HCO 3 - + 3 HS-
Organisms and Nutrients
Nitrogen
Nitrogen and Soil The most limiting essential element in the environment Surface soil range: 0. 02 to 0. 5% 0. 15% is representative 1 hectare = 3. 3 Mg
Biological/Plant Nitrogen Component of living systems Amino acids Proteins Enzymes Nucleic acids (DNA) Chlorophyll Strongly limiting in the Environment
Deficiency Chlorosis – pale, yellow-green appearance primarily in older tissues.
Excess Enhanced vegetative growth – lodging Over production of foliage high in N Delayed maturity Degraded fruit quality
N Distribution/Cycling N 2, NO, N 2 O Atmosphere Soil / soil O. M. NH 4+, NO 3 -, R – NH 2 Plants, animals Proteins, amino acids Organic Nitrogen (plant tissue, Soil Organic Matter): R – NH 2 During organic decomposition, R – NH 2 is usually broken down to NH 4+ is converted to NO 3 - by soil microorganisms
Forms: mineral and organic Organic: plant/tissue N R-NH 2 Mineral: soil N NH 4+, NO 3 - Cycling in the Environment Mineralization: Decomposition of organic forms releasing nitrogen into the soil, generally as NH 4+ Immobilization: Plant uptake of mineral nitrogen, removing it from the soil and incorporating into plant tissue.
Ammonium and Nitrate Mineralization R – NH 2 NH 4+ organic mineral Immobilization NH 4+ or NO 3 - R – NH 2
Cycling of Nitrogen R-NH 2 is organically bound form of nitrogen N 2 X R-NH 2 Decomposition Of O. M. NH 4+ Uptake by plant nitrosomonas NO 2 - Uptake by plant nitrobacter NH 4+ is exchangeable, NO 3 - is not NO 3 -
Atmospheric Nitrogen Fixation
Forms of Nitrogen R-NH 2 is organically bound form of nitrogen N 2 X R-NH 2 Decomposition Of O. M. NH 4+ Uptake by plant nitrosomonas NO 2 - Uptake by plant nitrobacter NH 4+ is exchangeable, NO 3 - is not NO 3 -
Symbiotic Biological Nitrogen Fixation Symbiosis between plant roots and rhizobium bacteria Rhizobium N 2 NH 4+ Nodules are packed with Rhizobium
Nitrogen and Legumes Residue from legume crops is usually high in N when compared with residue from other crops and can be a major source of N for crops that follow legumes in rotation. Most of the N contained in crop residue is not available to plants until microbes decompose the plant material. N Contributions alfalfa range from 100 to 150 lb. N/acre Soybeans range from 20 -40 lb/acre
Nitrogen Fixation is Difficult and Specialized N 2 + 6 H 2 2 NH 3 Fixing N 2 is energetically “expensive” N N Triple bond – Must use energy to break these bonds
Artificial Nitrogen Fixation Haber - Bosch Process - Artificial Fixation of Nitrogen Gas: – 200 atm – 400 -500 o. C yield of 10 -20% – no oxygen Produces 500 million tons of artificial N fertilizer per year. 1% of the world's energy supply is used for it Sustains roughly 40% of the world’s population
Nitrogen and Food production has grown with population Crop Varieties Fertilizers 70% of water used Irrigated land expected to expand by 23% in 25 years
Nitrogen Fertilization NH 4+ NO 3 - NO 3 Negative Exchange sites Loss of Productivity Leaching to groundwater, surface water
Some Areas of Florida are Susceptible
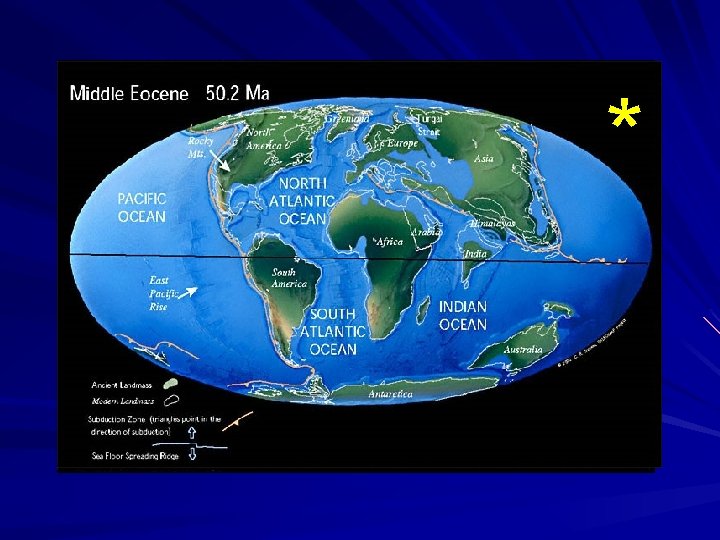
Approximately 250 million years ago
Approximately 150 - 200 million years ago Late Jurassic Flooded, stable platform Subject to marine sedimentation FL platform/plateau For the next several million years the platform was dominated by carbonate sedimentation Sedimentation: settling of particles from a fluid due to gravity
Carbonate Deposition/Sedimentation Marine Calcium and Magnesium Carbonate Ca. CO 3 Mg. CO 3
Between about 150 Mya and 25 Mya Florida platform was a flooded, submarine plateau dominated by carbonate deposition Ca. CO 3 FL platform
The Eocene and Oligocene Limestone The Eocene and Oligocene limestone forms the principal fresh water-bearing unit of the Floridan Aquifer, one of the most productive aquifer systems in the world Eocene: 55 – 34 million years ago Oligocene: 34 – 24 million years ago
Marine Carbonates carbonates Prior to 24 Mya Between 150 and 25 Mya, Florida was dominated by carbonate deposition
Continental Influences highlands Sediments
Isolation of the Florida Peninsula Sediments Georgia Channel Suwannee Current
Events of the Late Oligocene Epoch, approximately 25 Mya Raising of the Florida Platform Lowering of Sea Levels, Interruption of Suwannee Current
Exposure of Limestone The Oligocene marked the beginning of a world wide cooling trend and lower sea Levels. Erosion cavities Due to acidity
Miocene Epoch: began approximately 24 Mya sediments Rejuvenation of Appalachians, weathering, increased sediment load Sediments were sands, silts, clays
Filling in the Georgia Channel Sediments Early Miocene (~ 24 Mya)
Sediments Rising sea levels allow sediments to become suspended in water and drift over the platform
Siliciclastics Covered the Peninsula Sands And Clays
Summary 1. 2. 3. 4. 5. 6. 7. 8. Deposition of Eocene/Oligocene Limestone (55 – 24 Mya) Raising of the Florida platform Lowering of sea levels, interruption of the Suwannee Current Infilling of the Georgia Channel with sediments derived from Appalachian/continental erosion Sea level rise, lack of Suwannee current. Suspended siliciclastic sediments settle over the peninsula These sediments blanket the underlying limestone forming the upper confining layer for the Floridan Aquifer.
Permeability: the ease with which water moves through material Surface Siliciclastics (sandy) (highly permeable) Clays and Sands (low permeability) 55 – 24 million years ago Unconfined aquifer is extensive throughout the state of Florida Low Permeability Confining Unit (poor water movement) The Floridan aquifer is a confined aquifer. The water-bearing unit is permeable limestone. Low permeability rock (confining)
The Water-bearing Unit is Extremely Productive Calcium Carbonate Ca. CO 3 Magnesium Carbonate Mg. CO 3 limestone How does this material hold and deliver water?
Carbonate Dissolution Acid (H+) dissolves calcium carbonate Carbonates are made porous by acid dissolution
Rainfall is naturally acidic Carbon dioxide dissolved in water produces carbonic acid CO 2 + H 2 O = H 2 CO 3 (carbonic acid) H 2 CO 3 => H+ + HCO 3 Acid
Acidity from rainfall reacts with Ca. CO 3 and dissolves the carbonate rock. CO 2 + H 2 O = H 2 CO 3 => H+ + HCO 3 Ca. CO 3 + H+ = HCO 3 - + Ca 2+ (solid) (acid) (solution) Dissolution Cavities Dissolution Cave
Acid dissolves calcium carbonate Caves and Solution Cavities Ca. CO 3 + H+ = HCO 3 - + Ca 2+ Clayey Deposits Carbonates Channels and Caves
Karst Topography Characterized by sinkholes, springs, depressions, lakes
Sinkhole Lakes Florida is Dominated by Karst Topography
Sinkhole formation depends on the material overlying the carbonate water-bearing unit Very thick clays > 200 ft. Thin, sandy covering Cohesive clays up to 200 ft Thick sands up to 200 ft thick and some clays Miocene clays have been eroded and shaped throughout their history resulting in extreme variability in thickness across the state.
The Importance of Sinkholes and Sinkhole Lakes Hydrologic connections between the surface and the underlying limestone are maintained.
Florida: Nitrates (NO 3 -) Nitrates do not interact significantly with soil material and can move rapidly to groundwater. What areas are particularly vulnerable? The unconfined, surficial aquifer Areas where natural groundwater recharge occurs Areas where the aquifer confining unit is thin are also particularly vulnerable.
Lower Suwannee River Watershed • residential and commercial septic systems in rural areas • about 300 row crop and vegetable farms • 44 dairies with more than 25, 000 animals • 150 poultry operations with more than 38 million birds Nitrates NO 3 Drinking water standard: 10 ppm
Groundwater Nitrate Discharge to Rivers Possible sources of nitrate in the ground water in the vicinity of the river include fertilizer, animal wastes from dairy and poultry operations, and septic-tank effluent. Flow Nitrate concentrations were higher in the measured springs than in the river.
Next: Phosphorus