Social Determinants of Health and Health Data Panel


 Douglas")


 among Non-Hispanic Blacks in Douglas County")


 10%")

: “Health is a state of complete physical, mental and")
. A conceptual framework")


, ACS 2011 -15 www. communitycommons. org")


. A framework for public health action:")


- Slides: 58
Social Determinants of Health and Health Data Panel 28 th Annual Nebraska Data Users Conference, 9: 00 -10: 00 A. M. , August 16, 2017 David Drozd, UNO Center for Public Affairs Research 402 -554 -2132 ddrozd@unomaha. edu Carol Gilbert, City. Mat. CH 402 -552 -9589 cgilbert@unmc. edu Tom Rauner, NE Department of Health and Human Services 402 -471 -0148 thomas. rauner@nebraska. gov Athena Ramos, UNMC 402 -559 -2095 aramos@unmc. edu
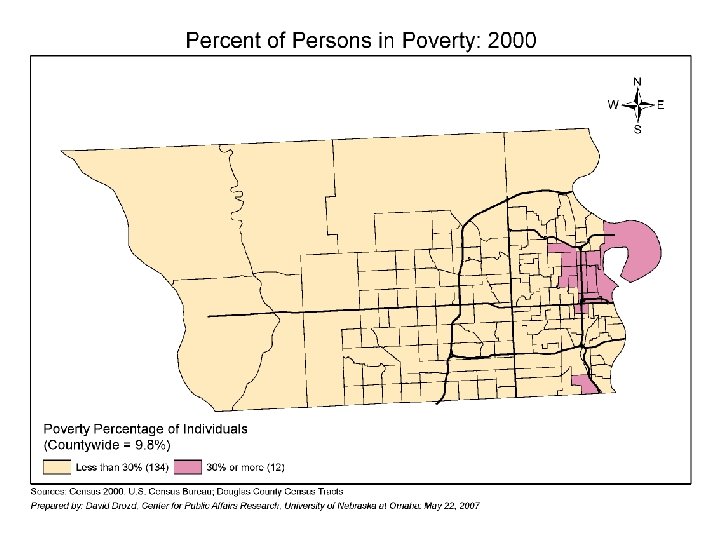
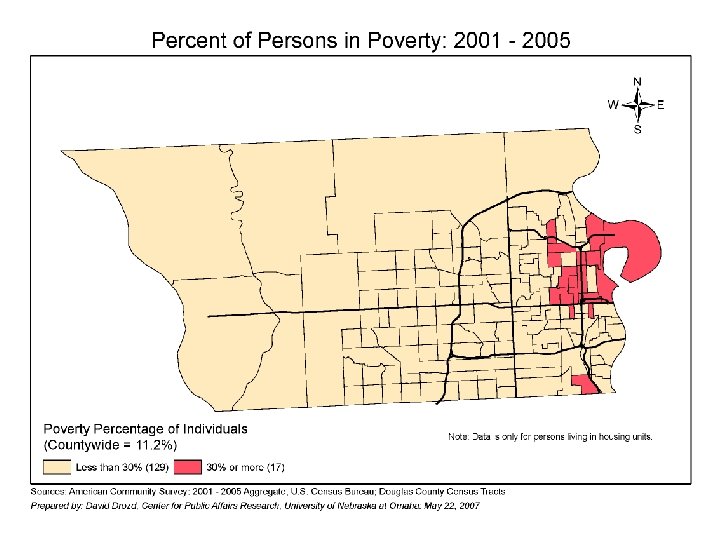
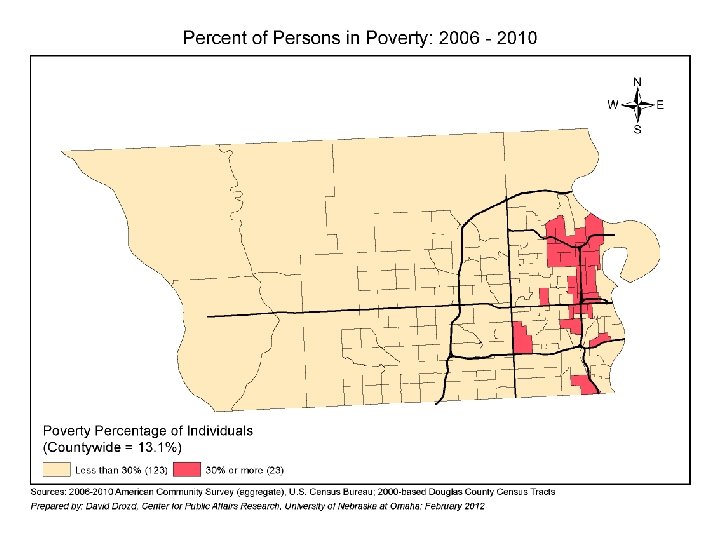
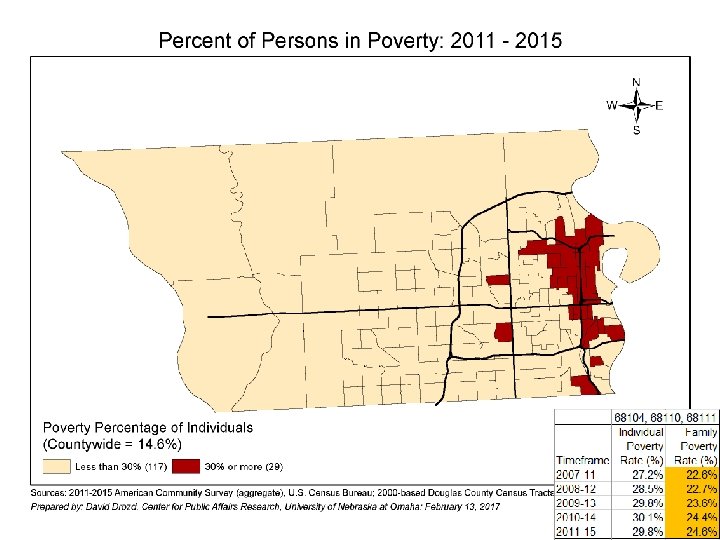
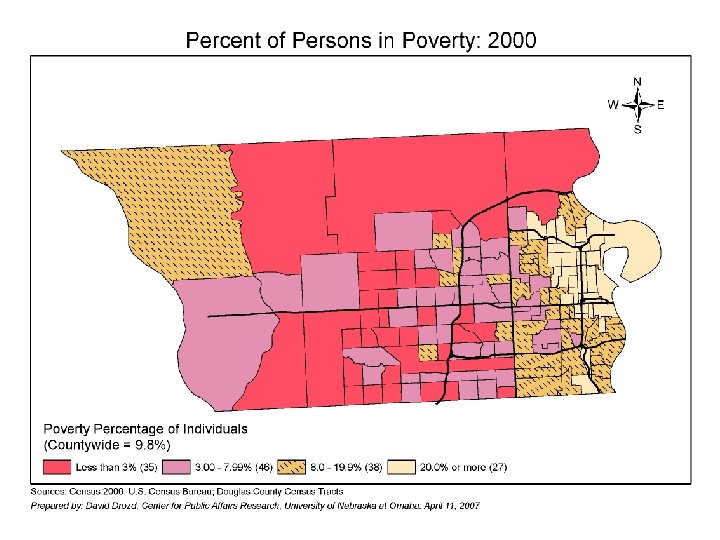
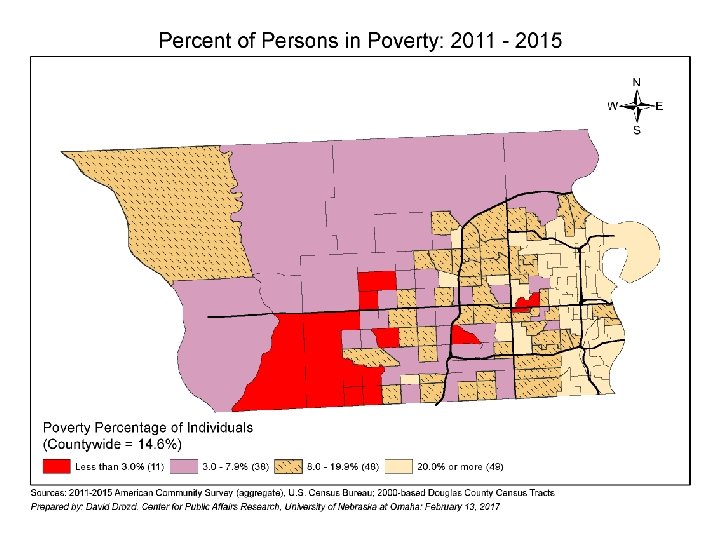
Census data can help determine and explain health outcomes
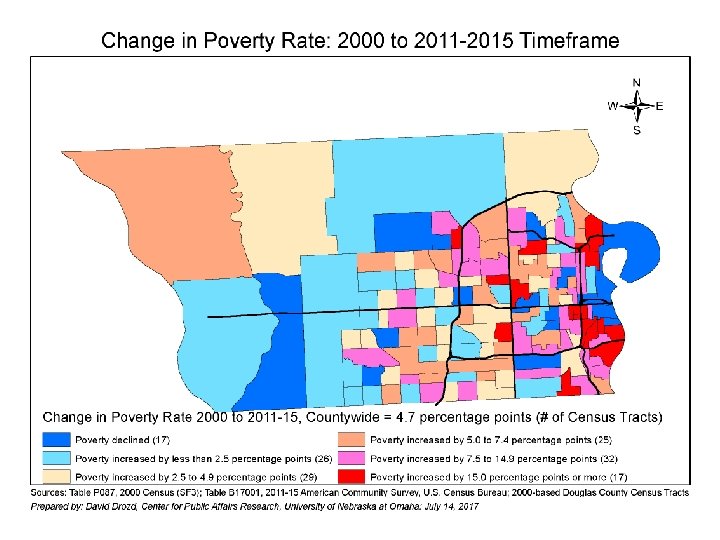
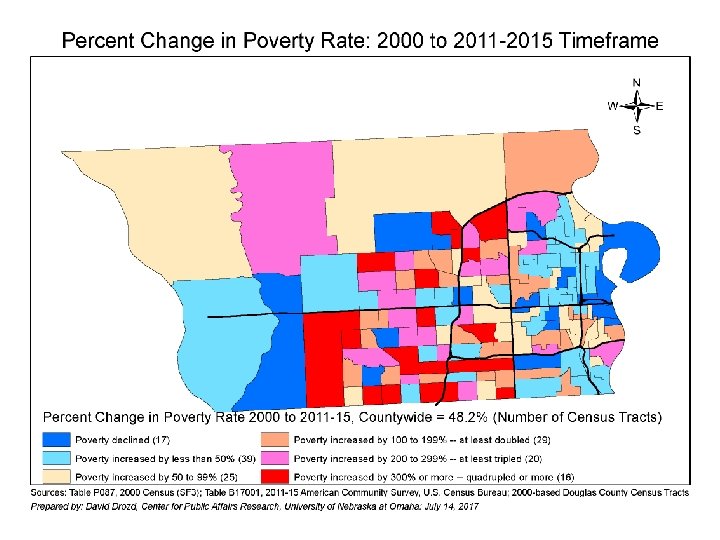
A look at some determinant related maps 3
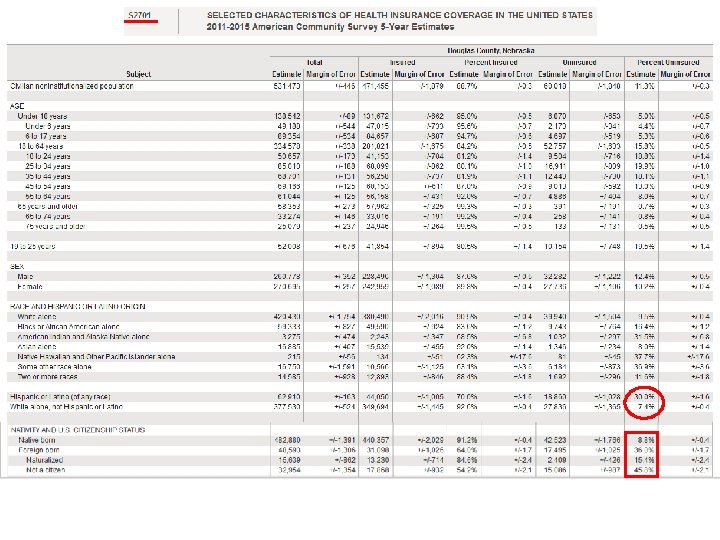
Data on Health Topics from Census • Disability – ACS asks about 6 different types of difficulties and having one or more creates a “has disability or not” variable – Vision, Hearing, Cognitive, Ambulatory (walking/climbing stairs), self-care (dressing/bathing), and independent living (shopping, visiting a doctor) • Health Insurance Coverage – ACS and CPS define the “uninsured” – ACS asks about 7 specific different types of coverage • Private: employer/union, direct purchase, TRICARE or military • Public: Medicare, Medicaid, VA, CHIP, etc. • ACS questions on disability were redesigned in 2008; it asked the first health insurance questions in 2008 (CPS from 1999) • Fertility – birth in the past year for women aged 15 -50 – Annual data on ACS; bi-annual from CPS June supplement • Much of the Census data’s “power” is from cross-tabulation by other characteristics (education level, income, age, LF status)
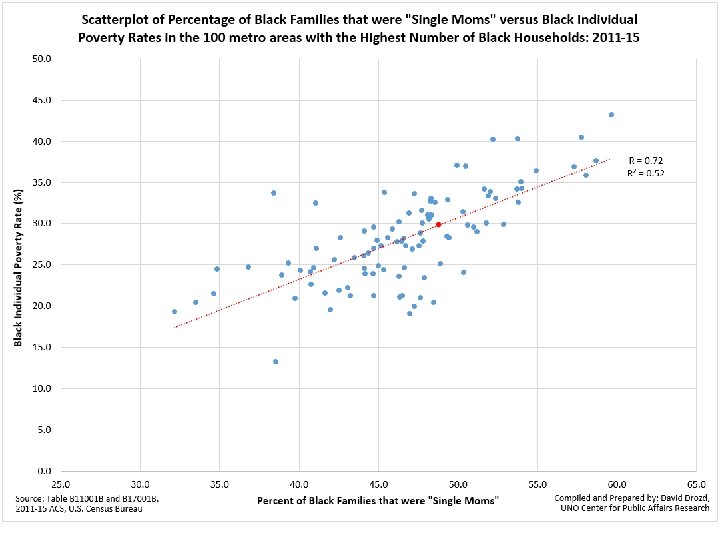
Census Variables on Health Determinants • Many socio-economic characteristics might relate to a person’s or household’s health status – Education level – Employment/Unemployment – Income/Poverty/Food Stamp (SNAP) recipiency – Home ownership (vs. renting) – Home occupancy/vacancy in neighborhood – Moves in the last year/when person moved into unit (residential turnover) – Language spoken/Foreign born (new immigrants) – Age of housing stock – Household/Family type • Persons living alone; “single parents”; grandparents responsible for grandchildren – Demographics: Age, Gender, Race/Ethnicity
So if you know or can find out where your foreign born population is…
You can target programs where health insurance might be needed… Note: the correlation coefficient between the foreign born % and the uninsured % for the 156 Douglas County tracts in the 2011 -15 ACS was 0. 74 (highly correlated).
UPDATE WITH 2017 DATA “Those in the lowest income group were less likely to have none or only one of the chronic conditions compared with those in the highest income group. ” “lowest income group also more likely to have 4 or more conditions than those in the highest income group (21% vs. 12%)” https: //www. cdc. gov/mmwr/volumes/66/wr/mm 6607 a 6. htm
https: //www. cdc. gov/mmwr/volumes/66/wr/mm 6627 a 3. htm
CAROL GILBERT CITYMATCH
Social determinants in Maternal and Child Health Carol Gilbert, MS Senior Health Data Analyst cgilbert@unmc. edu n 15
Maternal and Child Health • History: high infant mortality rate due primarily to infectious disease, associated with poverty • Vital records system modified to better track infant deaths n 16
Maternal and Child Health • MCH takes a population perspective. Everybody is born, everybody dies. • Modern MCH focuses on disparities: – We value justice – Impact on overall n 17
Douglas County Infant Mortality Rates 25 All White NH Black NH 20 15 10 5 0 1994 1999 2004 2009 2014 n 18
What causes infant death? What causes the persistent gap between whites and African-American infant mortality rates?
Why babies die in Douglas County Nebraska Infant deaths from births during 2007 -2013 (7 years) White Douglas County, NE deaths #Congenital malformations, deformations and chromosomal abnormalities (Q 00 -Q 99) Black deaths #Sudden infant death syndrome (R 95) 40 23 13 16 #Disorders related to short gestation and low birth weight, not elsewhere classified (P 07) 19 17 #Newborn affected by maternal complications of pregnancy (P 01) 14 20 National Center for Health Statistics (NCHS), Division of Vital Statistics (DVS). Linked Birth / Infant Death Records 2007 -2013 n 20
Mortality RATES allow comparisons Infant deaths from births during 2007 -2013 (7 years) Douglas County, NE Congenital malformations, deformations and chromosomal abnormalities (Q 00 -Q 99) White deaths Black deaths Rate Difference Sudden infant death syndrome (R 95) 1. 1 0. 6 1. 5 1. 8 . 4 1. 2 Disorders related to short gestation and low birth weight, not elsewhere classified (P 07) 0. 5 1. 9 1. 4 Newborn affected by maternal complications of pregnancy (P 01) 0. 4 2. 2 1. 9 Total 2. 6 7. 4 4. 8 National Center for Health Statistics (NCHS), Division of Vital Statistics (DVS). Linked Birth / Infant Death Records 2007 -2013 n 21
Further analysis n Perinatal Periods of Risk analysis showed that nearly half of preventable Black fetal and infant deaths were among those born at very low birth weight <3. 3 pounds n Further analysis shows that premature black babies were at least as likely to survive as premature white babies n In other words, nearly half of the Black/White disparity was due to extreme prematurity in the Black population.
Factors often associated with very preterm, birth, measured on birth certificate and PRAMS survey • Early prenatal care • Adequate time between births • Previous preterm birth • Overweight/obesity • Diabetes • Hypertension • Smoking • Teen mom • Twins/triplets etc • Sexually transmitted infections • Maternal educational attainment • Maternal marital status • Maternal stress
Population Attributable Risk Percent Exposed Unexposed All “Disease” a c a+c Not b d b+d All n 1 n 2 n 0 p 2=c/n 2 (rate of disease in low risk group) p 0=(a+c)/n 0 (rate of disease in whole population) Levin’s PAF = (p 0 - p 2)/p 0
Risk factors for very low birth weight (VLBW) among Non-Hispanic Blacks in Douglas County % VLBW if YES %VLBW if NO PAR Late entry into prenatal care 2. 2% 2. 4% -4. 2% Teen birth vs all other 1. 7% 2. 8% -4. 2% Diabetes 2. 1% 2. 7% -1. 1% Tobacco use 3. 2% 2. 6% 2. 8% HS or less education 2. 8% 2. 6% 3. 4% Hypertension 8. 1% 2. 3% 5. 0% Pregnancy hypertension 6. 5% 2. 5% 7. 0% Unmarried 2. 6% 2. 2% 11. 0% Twins triplets etc 12. 8% 2. 0% 16. 8% Source: CDC Wonder 2011 -2015 (rare factors used 2007 -2015)
Factors with largest impact on very low birth weight PRAMS data are from 2008 -2011, Douglas County estimates Prevalence among Ref Group Income below $15, 000 per year (PRAMS) Stress: separation or divorce (PRAMS) Prevalence among Black PAR among Black 9% 63% 21% 3% 10% Interpretation of PAR: if we could reduce the risk of low income moms by to the same low risk as higher income moms, the very low birth weight rate would decrease by 21%. What is the meaning of these factors of these social factors having a large impact?
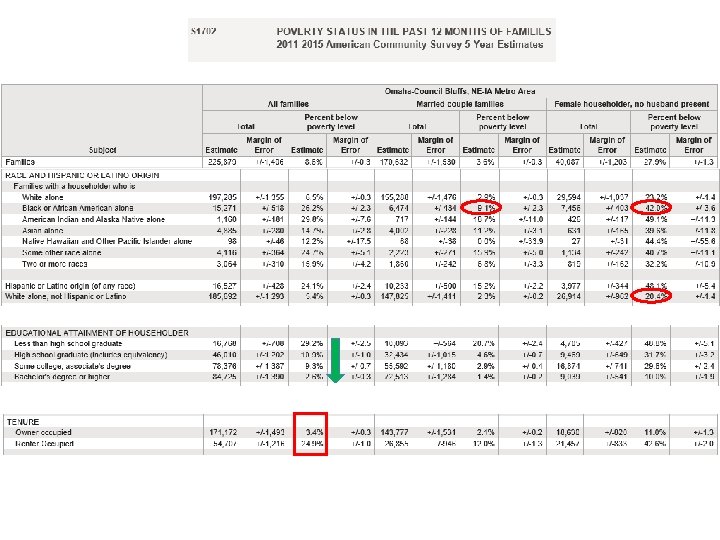
Census data can help us explore further, to determine more specifically what the high risk groups are coping with: -poverty, -employment, -educational attainment -health insurance and it can be broken down -by neighborhood -by presence of children -by having given birth in the past year n 27
TOM RAUNER NEBRASKA DEPARTMENT OF HEALTH AND HUMAN SERVICES
Health Access • Safety Net Sites • The Triple Aim • Social Determinates of Health
• • • Well care replacing sick care Value replacing volume Community participation Individual participation Integrated health care participation Chronic health care management
Roughly 20% Of the population Accounts for 80% Of health care costs Reducing or delaying Chronic conditions is A very cost effective Measure, but it is not Immediate.
We can address 70% of factors affecting longevity and how well we live • Livable communities – opportunity and encouragement around health behaviors • Stress reduction (food, clothing, shelter, health care access) • Quality and affordable healthy food resources • Balanced lifestyle and regular exercise Simplify and easy understanding
Total Health: How Long and How Well We Live Health Care Delivery (procedures) 10% Behaviors (tobacco, diet, exercise, alcohol, life style) 40% Environment, Public Health 20% Genetics 30% Mc. Ginnis JM & Foege WH. Actual Causes of Death in the United States. JAMA 1993; 270(18): 220712 (Nov 10). Mc. Ginnis JM, Williams-Russo P, Knickman JR. The case for more active policy attention to health promotion. Health Affairs 2002, 20(2): 78 -93 (Mar).
ATHENA RAMOS UNMC
Definitions World Health Organization (WHO): “Health is a state of complete physical, mental and social well-being and not merely the absence of disease or infirmity. ” “The social determinants of health (SDOH) are the conditions in which people are born, grow, live, work and age. These circumstances are shaped by the distribution of money, power and resources at global, national and local levels. ”
Social Determinants of Health Commission on Social Determinants of Health. (2010). A conceptual framework for action on the social determinants of health. Geneva: World Health Organization.
Healthy People 2020 Approach to Social Determinants of Health Economic Stability • Poverty • Employment • Food Insecurity • Housing Instability Education • High School Graduation • Enrollment in Higher Education • Language & Literacy • Early Childhood Education Social and Community Context • Social Cohesion • Civic Participation • Discrimination • Incarceration Health and Health Care • Access to Primary Care • Health Literacy Neighborhood and Built Environment • Access to Foods that Support Healthy Eating Patterns • Quality of Housing • Crime and Violence • Environmental Conditions
Social Determinants of Health
Data Can Improve Health Equity Efforts We need to track data on the social determinants of health. DATA CAN… • Drive better decision-making at the local, state, and national levels • Enhance the quality, efficacy, and accessibility of services provided by community organizations, healthcare organizations, and other stakeholders • Be used to assess community progress and continued areas for improvement
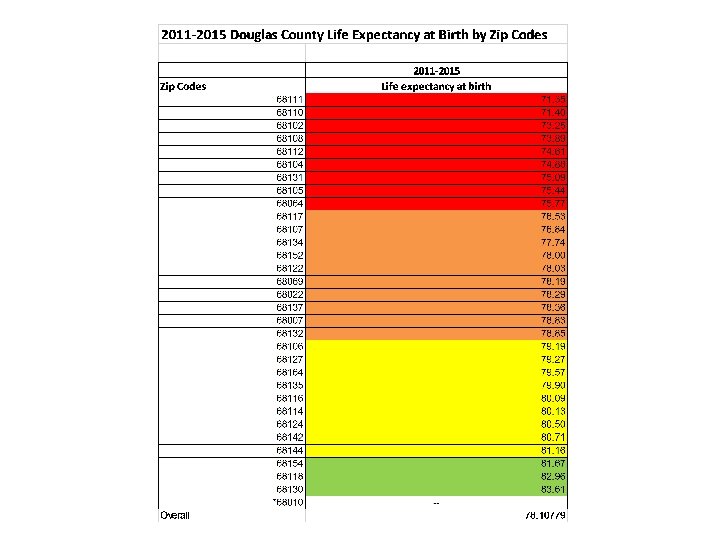
More than 12 years difference in life expectancy in Douglas County!
Community Commons Vulnerable Populations Footprint www. communitycommons. org
Community Commons Income Inequality (GINI), ACS 2011 -15 www. communitycommons. org
Douglas County Health Department Community Indicators http: //www. douglascohealth. org/
Public Health Data Recommendations 1. Analyze mortality and morbidity data to show health disparities, identify causes of death attributable to social and economic factors, and prioritize places and populations for further public health surveillance, intervention, and evaluation. 2. Track morbidity and mortality data in priority places and populations over time to measure progress in affecting the SDOH indicators attributable to these health disparities. 3. Identify the Census tracts in your jurisdiction with a high prevalence of people living below 100% or 200% federal poverty level. 4. Collect, analyze, and interpret indicators including: income distribution, unemployment, housing cost burden, living wage, food insecurity, foregoing health care, violent crime, educational attainment, voter participation, social capital/social support, English language learners, air contamination, access to public transportation, alcohol access, and food access. 5. Track SDOH indicators over time to show improvement, decline, or stagnation in the totality of policies, programs, and procedures related to that indicator for a geography and population over time. 6. Use SDOH data to write competitive funding applications and mobilize community partnerships with organizations traditionally outside health and/or human services. Bay Area Regional Health Inequities Initiative (BARHII) Data Committee. (2015). http: //barhii. org/resources/sdoh-indicator-guide/
Practice Implications • Engage community members, staff, and other stakeholders in developing your metrics/ indicators • Develop standard protocols that incorporate SDOH data collection from clients/patients • Example PRAPARE: http: //www. healthcarecommunitie s. org/Desktop. Modules/Bring 2 mind/ DMX/Download. aspx? portalid=3&E ntry. Id=98561 USE DATA TO MAKE MEANINGFUL CHANGES TO FOSTER HEALTH AND SOCIAL EQUITY Foden-Vencil, K. (2017, August 4). Your ZIP code might be as important to health as your genetic code. http: //www. npr. org/sections/healthshots/2017/08/04/539757759/your-zip-code-can-be-as-important-to-health-as-your-genetic-code
Improving Public Health Initiatives Frieden, T. R. (2010). A framework for public health action: The health impact pyramid. American Journal of Public Health, 100(4), 590– 595.
Social Determinants of Health and Health Data Panel 28 th Annual Nebraska Data Users Conference, 9: 00 -10: 00 A. M. , August 16, 2017 David Drozd, UNO Center for Public Affairs Research 402 -554 -2132 ddrozd@unomaha. edu Carol Gilbert, City. Mat. CH 402 -552 -9589 cgilbert@unmc. edu Tom Rauner, NE Department of Health and Human Services 402 -471 -0148 thomas. rauner@nebraska. gov Athena Ramos, UNMC 402 -559 -2095 aramos@unmc. edu
EXTRA SLIDES IF NEEDED FOR TIME