Topic 3 Demand Supply and Prices Price changes


 Substitution effect takes place when a consumer reacts")


- Slides: 41
Topic 3: Demand, Supply, and Prices
Price changes always affect the quantity demanded because people buy less of a good when it goes up in price.
Demand is the desire to own something and the ability to pay for it Law of Demand is when a good’s price is lower, consumers will buy more of it When the price is higher, consumers will buy less of it
Look at this demand curve. What happens to quantity purchased as the price rises?
Why do we purchase more when items are on sale?
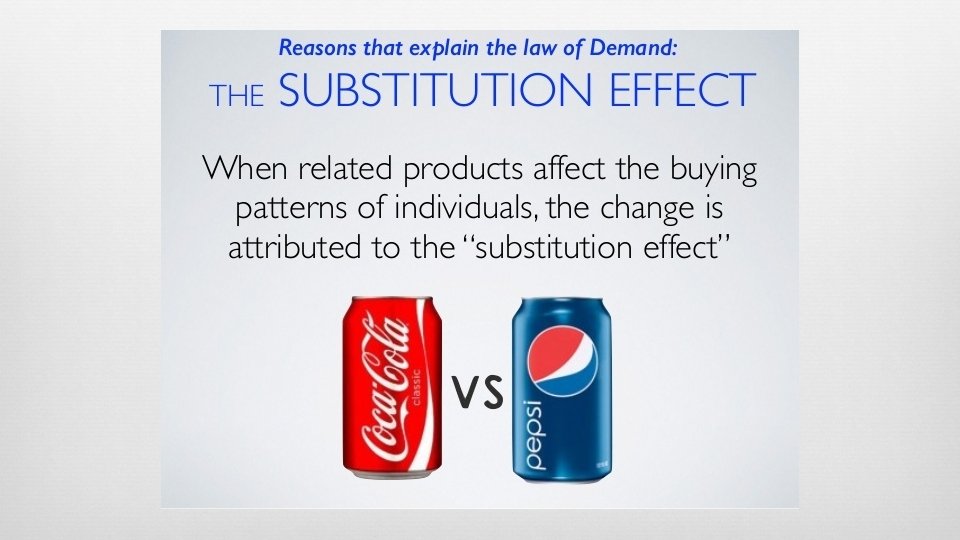
Two Behavior Patterns (Law of Demand) Substitution effect takes place when a consumer reacts to a rise in the price of one good by consuming less of that good and more of a substituted good Can also occur when price drops occur Example: When the price of orange juice rises, consumers substitute cheaper apple juice for orange juice. Income effect is the change in consumption that results when a price increase causes real income to decline In other words, when prices rise, your money buys less.
Income Effect
Consumption Remember: economists measure consumption in the amount of a good bought, not the amount of money spent to buy it Example: When the price goes up, consumers spend more money on their pizza, but they may demand less of it The income effect has led to a decrease in the quantity demanded The income effect works the opposite way as well
Lower prices allow consumers to increase demand. Lower prices increase consumers’ purchasing power. E. Napp
The Demand Schedule The law of demand, along with concepts such as the substitution effect and income effect, explains how the price of any item affects the quantity demand of that item
Demand Curve A graphic representation of a demand schedule All demand graphs show that each pair of price and quantity demanded numbers on the demand schedule can be plotted on the graph. The graph can only show the relationship between the price of the good and the quantity consumers are willing to purchase at that price The demand curve slopes downward to the right As price decreases, quantity demanded increases
Demand Curve
Demand Schedule and Demand Curve Both demand schedule and demand curves reflect the law of demand which states that higher prices will always lead to lower quantities of demand The market demand curve is only accurate for one very specific set of market conditions Cannot predict changing market conditions
Section 2: Shifts in Demand
Ceteris Paribus is Latin for “all other things held constant” The demand schedule only took into account changes in the price. The demand schedule does not consider the effects of news reports or any of thousands of other factors that change from day to day A demand curve is only accurate as long as there are no changes other than the price that has influenced the consumers decisions When we drop ceteris paribus and allow factors to change, we no longer move along the demand curve The demand curve shifts
The Non-Price Determinants of Demand Non-price determinants- they are factors that can lead to the shifting of demand up or down (but they are not linked to price) These determinants include: Income Consumer expectations Population demographics Consumer tastes Advertising
Non-Price Determinants: Income A consumer’ income affects his or her demand for most goods Normal goods- goods that consumers demand more of when their income increases Shift to the right= increase in demand Shift to the left= decrease in demand Inferior goods- goods that you would buy in smaller quantities, or not at all, if your income were to rise and you could afford something better
Non-Price Determinants: Consumer Expectations Our expectations about the future can affect our demand for certain goods today If you except the price to rise, your current demand will rise, which means you will buy the good sooner If you expect the price to drop, your current demand will fall and you will wait for lower prices
Non-Price Determinants: Demographics- the statistical characteristics of populations, such as age, race, gender, occupation, and income level Businesses use demographics to identify potential customers
Non-Price Determinants: Change in Population Size Change in population size A growing population leads to more houses and people to feed Rise in population will increase demand for houses, food, and many other goods and services
Non-Price Determinants: Consumer Taste People buy what they find comfortable and useful Advertisers must get buyers to feel confident and comfortable with their products Businesses are constantly using new forms of advertisements to gain buyers attention
Section 3: Elasticity of Demand
Elasticity of Demand Elasticity of demand is what economist use to describe the way consumers respond to price changes Elasticity measures how drastically buyers will cut back or increase their demand for a good when the price rises or falls The law of demand implies that the result will always be negative An increase in the price of a good will always decrease the quantity demanded, and a decrease in the price of a good will always increase the quantity demanded
Factors Affecting Elasticity Why is the demand for some goods so much less elastic than for other goods? Several different factors impact elasticity including: Non-price determinants Availability of substitutes
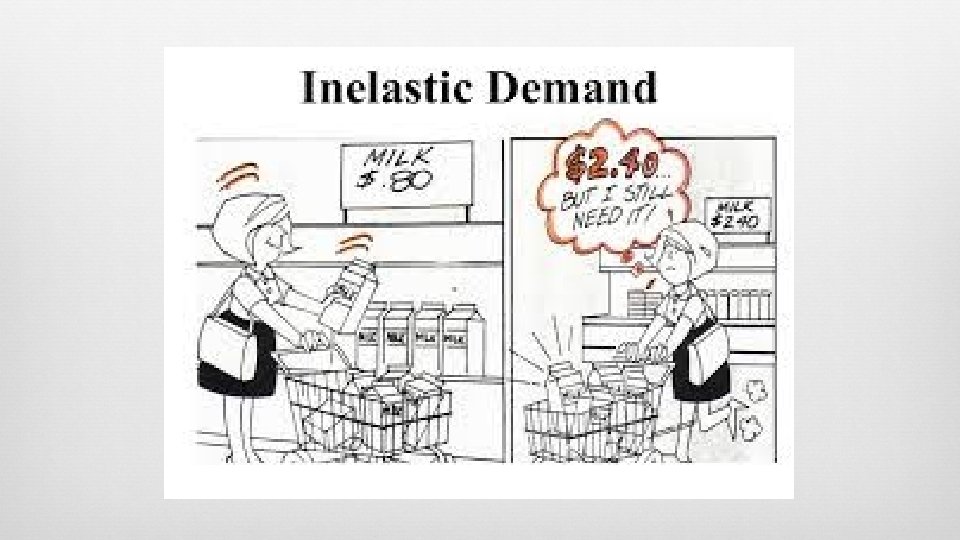
Substitutes are goods that can be used in place of another If there are few substitutions for a good, then even when its prices rise greatly, people still buy it Lack of substitutes can make a good inelastic
Elasticity and Change When a price changes, consumers often need time to change their spending habits Consumers do not always react quickly to a price increase because it takes time to find substitutes Example: gasoline prices
Elasticity and Revenue Total revenue- the amount of money the company receives by selling its goods 2 factors: 1. The price of the goods 2. The quantity sold
Elasticity and Pricing Businesses must know the demand for their products. This knowledge helps the business make pricing decisions that lead to the greatest revenue
Section 4: Fundamentals of Supply
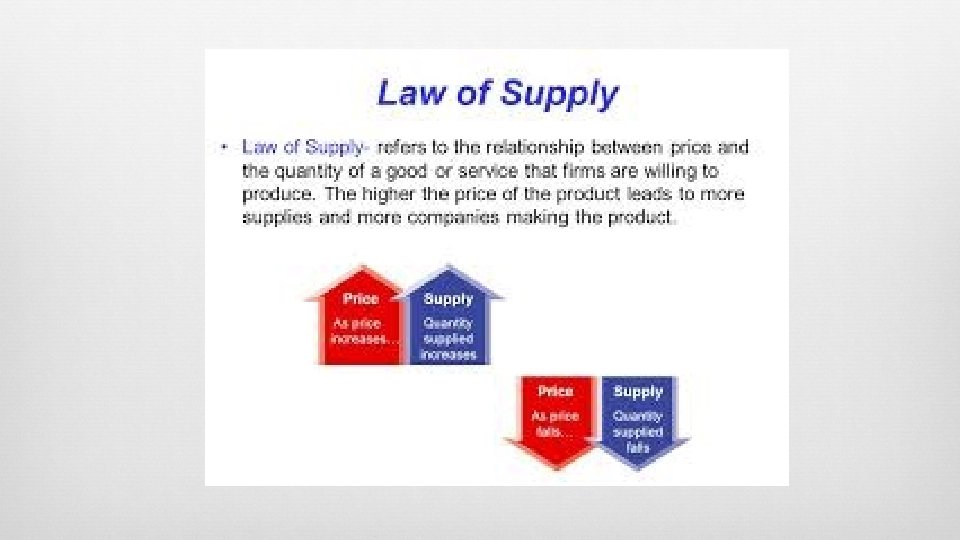
Supply is the amount of a good or service that is available How do producers decide how much to supply? Law of supply- producers offer more of a good or service as its price increases and less as its price falls
Production and Supply Quantity supplied describes how much of a good or service a producer is willing and able to sell at a specific price A producer may also be called a supplier, a company, or an ownerwhoever supplies a produce to the market
The Law of Supply The law of supply develops from the choices of both current and new products of a good or service As prices rise, firms will produce more to earn additional revenues As price increase is also an incentive for new firms to enter the market to earn their own profits The price of a good or service falls, some firms will produce less and others might drop out of the market
The Effect of Price on Supply If a business is already earning a profit by selling a good or service, then an increase in the price- ceteris paribus- will increase the businesses profits
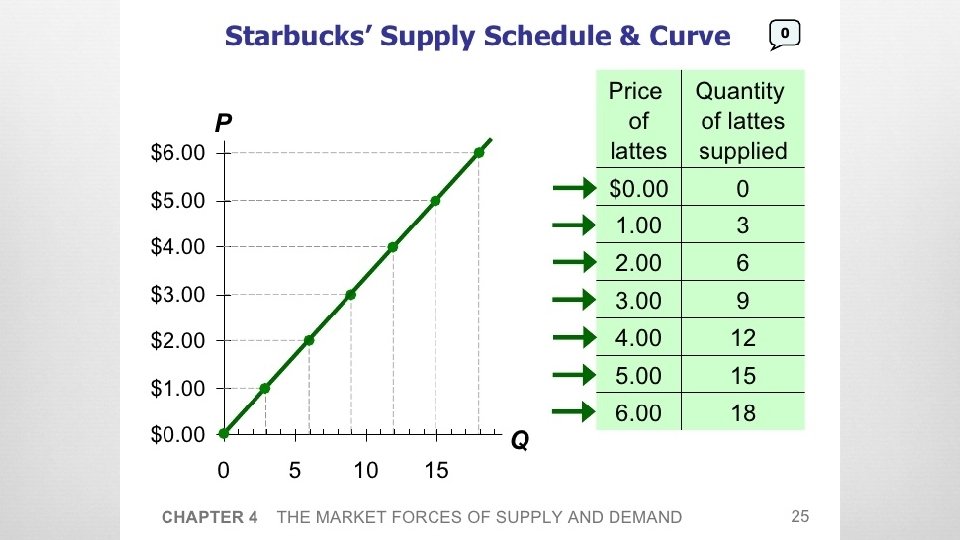
Supply Schedule Supply schedules show the relationship between price and quantity supplied for a specific good or service, or how much of a good or service a supplier will offer as various prices Supply curve- a graphic representation of a supply schedule
Section 5: Costs of Production
Production of Goods Producers think about the cost of making one more unit of a good when deciding how to maximize their profits Operating costs- the cost of operating a facility