Session 9 1011 Ashish Pandey Major adjustments 1


 Horizontal analysis (two years) Trend")


 Net working capital")
 Accounts receivable turnover Average collection period or days")

 How Expressed Meaning Percentage Measures")


- Slides: 55
Session 9, 10&11 Ashish Pandey
Major adjustments 1. 2. 3. 4. 5. 6. 7. 8. 9. Depreciation on fixed assets Closing inventory Expenses due but not paid Prepaid expenses Bad debts Income accrued but not received Write off of preliminary expenses Provision for doubtful debts Bills receivable dishonoured
Major adjustments 10. Loss due to fire 11. Correction in classification of capital expenditure as revenue expense 12. Deferment of revenue expenditure 13. Amortisation of intangible assets 14. Managerial remuneration 15. Provision for income tax 16. Proposed dividend 17. Transfer to general reserve
Minimum questions to be solved • Page 101 -127 of FA book by Ambrish gupta – 3 solved questions (page no 101 to 117) • Mamta fashions (done in the class) • Shashank • Itpl – 5 unsolved questions (page no 120 -127) • Sanjay (done in the class), sangeeta, pushpa, mahesh & hindustan textiles
And. . • • Ind AS 2 Inventory valuation AS 10 Fixed assets Ind AS 16 Depreciation Working understanding of DTA & DTL
Group exercise
Group exercise 1. Go through the financial statements of company B and give your comments 2. Can financial statements of company B be compared with company T? How? 3. Who all will find your comments useful?
Group exercise 4. Do you want strengthen your comments? 5. Will you like to seek more info, what is the kind of info that you will like to collect
Financial statement Analysis
Key questions 1. 2. 3. 4. Why analyse company/ies? Who analysis with what objectives? How do they analyse? What are the sources of information?
Why Analyse 1. Assessment of Past Performance/position 2. Assessment of current performance/ position 3. Prediction of profitability and growth prospects 4. Prediction of bankruptcy and failure 5. Assessment of the operational efficiency 6. To ascertain the investment value of the firm
Who analysis & Why?
To start the process… 1. Gather reliable information. Sources include – – Company reports Stock exchanges Business periodicals & television Information services 2. Consider off-balance sheet items – leases, policies, contingent liabilities, guarantees given by the company, revaluation etc. 3. Re-arrange financial statements in a comparable form
Other Qualitative Data 1. 2. 3. 4. 5. 6. 7. 8. 9. Chairperson’s letter to the stockholders Other information is available from third-parties. Credit reporting services such as CRISIL, CARE etc. News articles, TVs On-line sources… http: //in. finance. yahoo. com/ www. nseindia. com www. bse. com http: //www. sebi. gov. in/sebiweb/edifar. jsp (Electronic Data Information Filing and Retrieval System – edifar)
How to analyse? Techniques of analysis
Techniques of analysis • • Vertical analysis (common-size statements) Horizontal analysis (two years) Trend analysis (more than two years) Ratio analysis
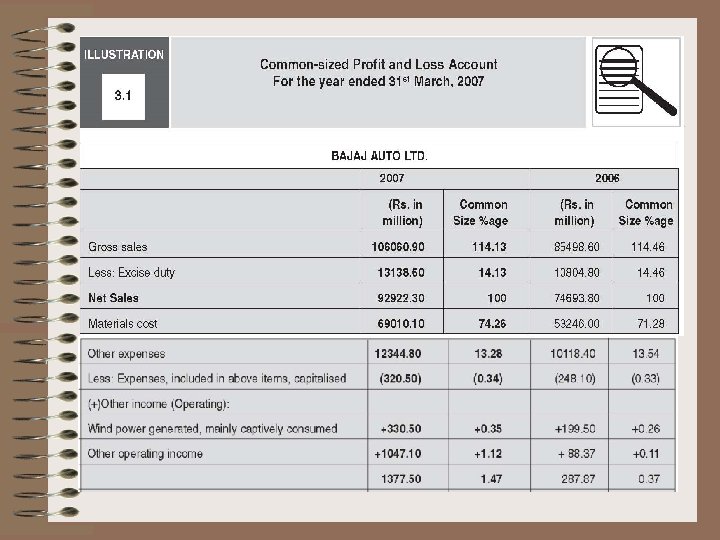
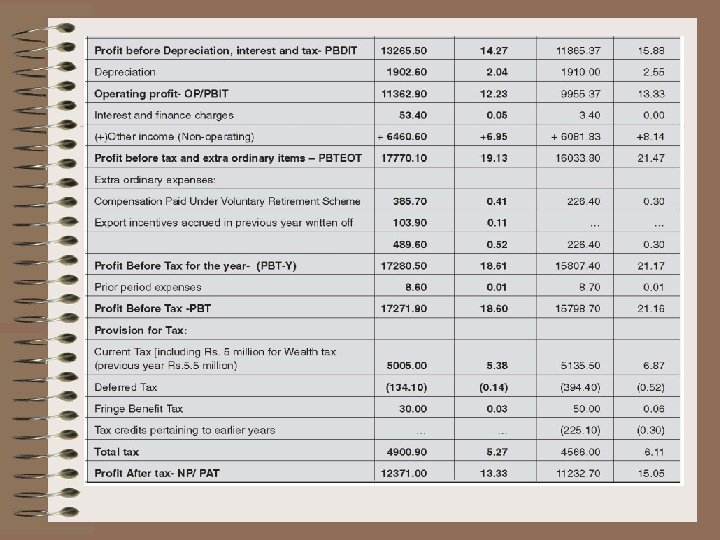
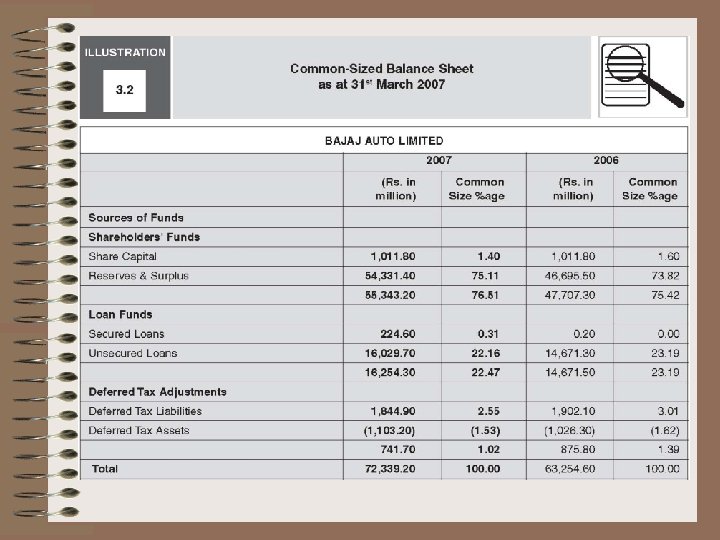
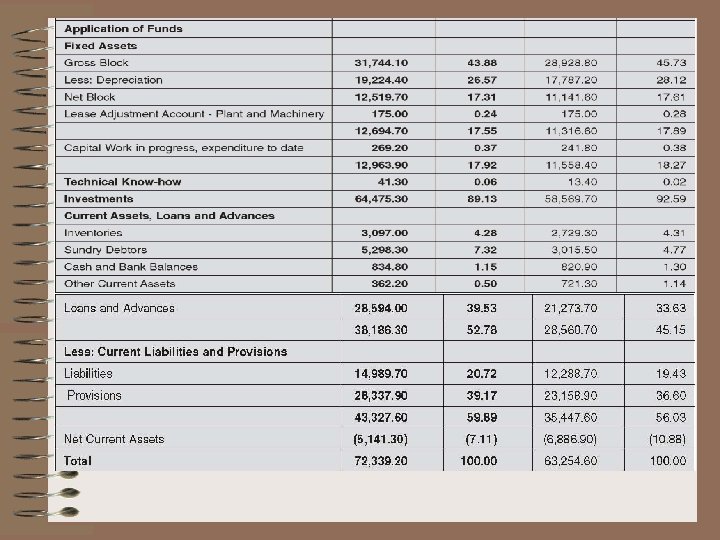
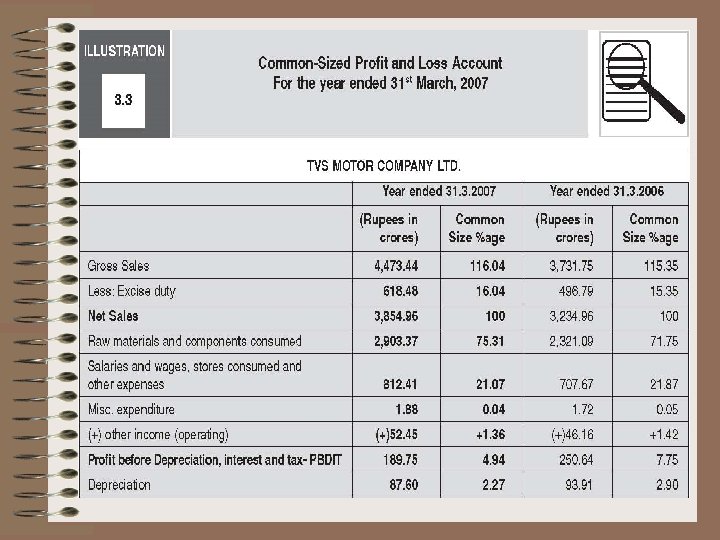
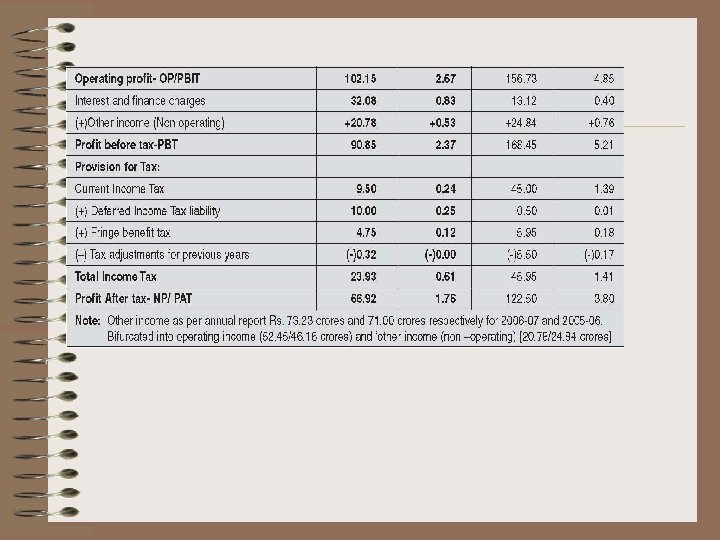
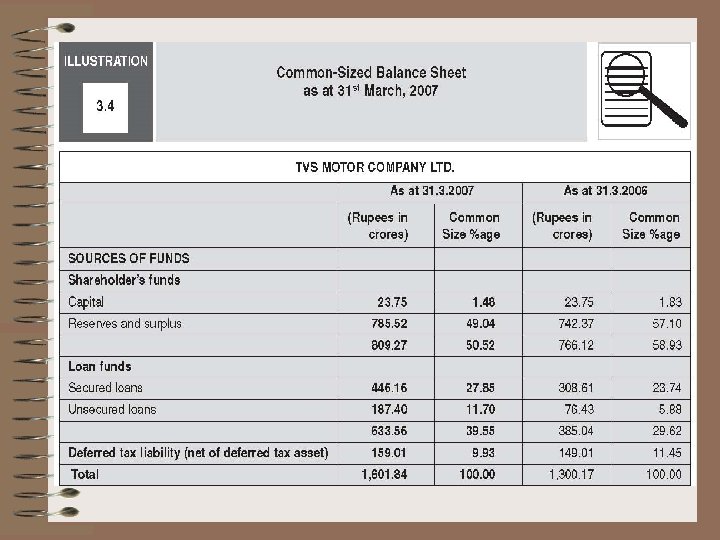
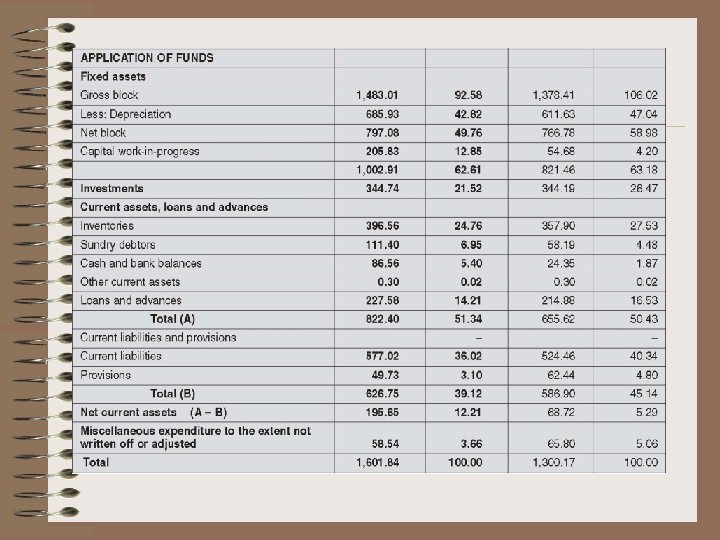
Technique no 1: VERTICAL ANALYSIS/ COMMON-SIZE STATEMENTS
Common-size statements • A common size balance sheet expresses each item on the balance sheet as a percentage of total assets • A common size statement of profit & loss expresses each item in the category as a percentage of total sales revenues
Technique no 2 Horizontal analysis
Horizontal analysis • It is a financial statement analysis technique that shows changes in the amounts of corresponding financial statement items over a period of time. • The statements for two or more periods are used in horizontal analysis. The earliest period is usually used as the base period and the items on the statements for all later periods are compared with items on the statements of the base period. The changes are generally shown both in amount and percentage.
Lincoln Company Comparative Balance Sheet December 31, 2013 and 2012 Assets Current assets Long-term investments Fixed assets (net) Intangible assets Total assets Liabilities Current liabilities Long-term liabilities Total liabilities Stockholders’ Equity Preferred 6% stock, Rs. 100 par equity stock, Rs. 10 par Retained earnings Total stockholders’ equity Total liab. & SE Increase (Decrease) 2013 2012 Amount Percent 550, 000 533, 000 17, 000 3. 2 95, 000 177, 500 (82, 500)(46. 5) 444, 500 470, 000 (25, 500)(5. 4) 50, 000 — 1, 139, 500 1, 230, 500 (91, 000)(7. 4) 210, 000 100, 000 310, 000 243, 000 200, 000 443, 000 150, 000 500, 000 179, 500 137, 500 829, 500 787, 500 1, 139, 5001230, 500 (33, 000)(13. 6) (100, 000)(50. 0) (133, 000)(30. 0) — — 42, 000 30. 5 42, 000 5. 3 (91, 000)(7. 4)
Lincoln Company Comparative Income Statement December 31, 2013 and 2012 Sales returns Net sales Cost of goods sold Gross profit Selling expenses Administrative expenses Total operating expenses Operating income Other income (22. 7%) Other expense (50. 0%) Income before income tax Income tax Net income Increase (Decrease) 2013 2012 Amount Percent 1, 530, 500 1, 234, 000 296, 500 24. 0% 32, 500 34, 000 (1, 500)(4. 4%) 1, 498, 000 1, 200, 000 298, 000 24. 8% 1, 043, 000 820, 000 223, 000 27. 2% 455, 000 380, 000 75, 000 19. 7% 191, 000 147, 000 44, 000 29. 9% 104, 000 97, 400 6, 600 6. 8% 295, 000 244, 400 50, 600 20. 7% 160, 000 135, 600 24, 400 18. 0% 8, 500 11, 000 (2, 500) 168, 500 6, 000 146, 600 12, 000 21, 900 14. 9% (6, 000) 162, 500 71, 500 91, 000 134, 600 58, 100 76, 500 27, 900 20. 7% 13, 400 23. 1% 14, 500 19. 0%
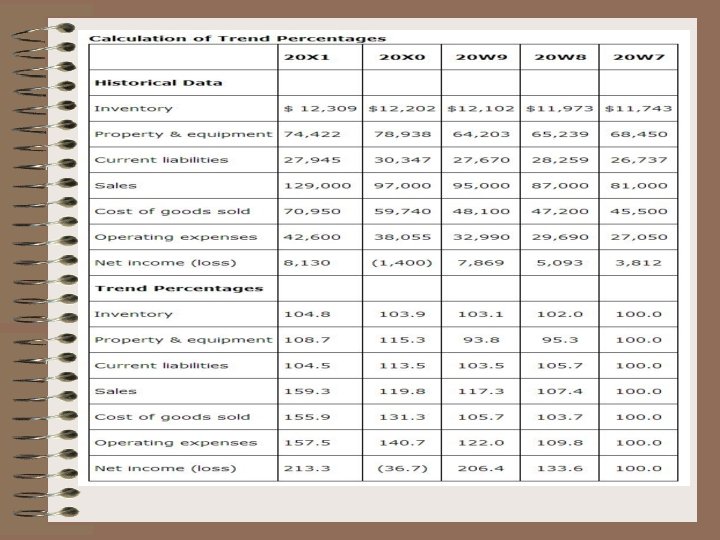
Technique no 3 Trend analysis
Trend analysis • Trend analysis evaluates an organization’s financial information over a period of time. Periods may be measured in months, quarters, or years, depending on the circumstances. The goal is to calculate and analyze the amount change and percent change from one period to the next.
Technique no 4 Ratio analysis
Ratio Analysis Categories 1. 2. 3. 4. 5. 6. Profitability Resources Efficiency or Turnover Ratios Returns Liquidity Leverage/Solvency Capital Market Dupont analysis
Profitability ratios • Profitability measures look at how much profit the firm generates from sales • Measures degree of operating success of a company • Different measures of profit – – – Gross profit Cash operating profit (EBITDA) Operating profit (EBIT) PBTor EBT Net Profit or EAT
Various measures of profit Sales Less cost of goods sold Gross profit Less operating expenses EBITDA (Cash operating profit) Less non cash expenses (Depreciation & Amortisation) EBIT (Operating profit) Less Interest & finance charges PBT Taxes PAT (Net Profit)
Profitability Ratios Net profit margin Formula Net profit after taxes Net sales Gross profit margin Sales – Cost of goods sold Net sales Various measures of profit to sales Ratio of individual costs to sales Ratios of other income, extraordinary items, etc to sales How Expressed Meaning Percentage Shows how much after-tax profits are generated by each dollar of sales. Percentage Indicates the total margin available to cover other expenses beyond cost of goods sold, and still yield a profit.
Resources Efficiency or Turnover Ratios • Measures firm’s efficiency in utilising its assets/liabilities/capital
Resources Efficiency or Turnover Ratios Inventory turnover Days of inventory (LIQUIDITY) Net working capital turnover Formula How Expressed Meaning times Measures the number of times that average inventory of finished goods was turned over or sold during a period of time, usually a year. Days Measures the number of one day’s worth of inventory that a company has on hand at any given times Measures how effectively the net working capital is used to generate sales. times Measures the utilization of all the company’s assets; measures how many sales are generated by each dollar of assets. Times Measures the utilization of the company’s fixed assets (i. e. , plant and equipment); measures how many sales are generated by each dollar of fixed assets. Net sales or cogs Average Inventory Cost of goods sold ÷ 365 Or 365/ITR Net sales Net working capital Asset turnover Sales Average Total assets Fixed asset turnover Sales Fixed assets
Resources Efficiency or Turnover Ratios (con’t) Accounts receivable turnover Average collection period or days sales outstanding (LIQUIDITY) Accounts payable turnover Suppliers credit (LIQUIDITY) Formula How Expressed Meaning times Indicates the number of times that accounts receivable are cycled during the period (usually a year). Days Indicates the average length of time in days that a company must wait to collect a sale after making it; may be compared to the credit terms offered by the company to its customers. times Indicates the average length of time in days that the company takes to pay its credit purchases. days Indicates average credit period availed by a company from its suppliers Days Indicates the number of days of cash on hand, at present sales levels. Annual credit sales Average Accounts receivable Sales for year ÷ 365 Or 365/ART Annual credit purchases Average accounts payable Average Accounts payable Purchases for year ÷ 365 Or 365/APT Days of cash Cash Net sales for the year ÷ 365
Returns Ratios • Another variant of Profitability ratios, here the denominator is the amount invested. • Ultimate objective of the company management is to maximise ROI
Return on investment Ratios Formula Return on investment (ROI) How Expressed Meaning Percentage Measures the rate of return on the total assets utilized in the company; a measure of management’s efficiency, it shows the return on all the assets under its control regardless of source of financing. Percentage Measures the rate of return on the book value of shareholders’ total investment in the company. Percentage Measures the overall profitability after discharging cost of borrowed funds & taxes Net profit after taxes Long term investment Return on equity (ROE) ROE Earnings per share (EPS) CEPS Net profit after taxes- pref div Shareholders’ equity Net profit after taxes-pref div Shareholders’ equity+ Reserves & Surplus Net profit after taxes – Preferred Dollars per share stock dividends Average number of common shares PAT-PD+non cash charges Average number of common shares Shows the after-tax earnings generated for each share of common stock.
Liquidity Ratios • Ability of a business to meet its short-term obligations when they fall due.
Liquidity Ratios Formula Current ratio How Expressed times A short-term indicator of the company’s ability to pay its shortterm liabilities from short-term assets; how much of current assets are available to cover each dollar of current liabilities times Measures the company’s ability to pay off its short-term obligations from current assets, excluding inventories. times Measures the extent to which the company’s capital is in cash or cash equivalents; shows how much of the current obligations can be paid from cash or near-cash assets. Current assets (CA) Current liabilities (CL) Quick (acid-test) ratio CA – Inventory-Prepaid expenses Current liabilities Cash ratio Cash + Cash equivalents Current liabilities Receivable turnover Inventory turnover Operating cycle Meaning
Solvency/Leverage ratios • Extent of debt used to finance assets • Capacity of company to discharge its obligations towards long term lenders indicates its financial strength and ensures its long term survival
Leverage Ratios Formula Debt to asset ratio How Expressed Meaning Percentage Measures the extent to which borrowed funds have been used to finance the company’s assets. Percentage Measures the funds provided by creditors versus the funds provided by owners. Percentage Measures the long-term component of capital structure. times Indicates the ability of the company to meet its annual interest costs. times A measure of the company’s ability to meet all of its fixed charge obligations. Total debt Total assets Debt to equity ratio Long-term debt to capital structure Interest coverage Debt service coverage ratio Total debt Shareholders’ equity Long-term debt Shareholders’ equity Profit before taxes + Interest charges + non cash charges Interest charges+Instalments of Principal due
Valuation or Capital market standing • As the equity is traded in the stock market, the investors both current & prospective would be interested in assessing the performance of the stock in the market
Valuation or capital market Ratios Formula How Expressed Meaning Decimal Shows the current market’s evaluation of a stock, based on its earnings; shows how much the investor is willing to pay for each dollar of earnings. rs Nw or nav per equity share Percentage Indicates the percentage of profit that is paid out as dividends. Percentage Indicates the dividend rate of return to common shareholders at the current market price. EPS Price/earning ratio Market price per share Earnings per share NAV Equity shareholders funds No. of equity shares o/s Dividend payout ratio Annual dividends per share Annual earnings per share Dividend yield on common stock. Annual dividends per share Current market price per share
Du pont analysis It is a useful technique to break down the ROE into its constituent elements. It helps to understand the reasons for inc or dec in ROE by identifying the underlying variables ROE= net margin ratio X total assets turnover ratio X Financial leverage = PAT X Sales X total assets Sales total assets Shareholders funds
Basic Financial Analysis 1. Scrutinize historical income statements and balance sheets. Statements of cash flow may also be useful. 2. Compare historical statements over time. 3. Calculate changes that occur in individual categories from year to year, as well as the cumulative total change. 4. Determine the change as a percentage as well as the absolute amount. 5. Adjust for inflation if it was a significant factor Trends are key to managerial decision making.
ANNUAL REPORT
Annual Report • An annual report is a comprehensive report on a company's activities throughout the preceding year. Annual reports are intended to give shareholders and other interested people information about the company's activities and financial performance.
Constituents of an annual report • • • Chairman’s letter Financial Highlights Letter to the Shareholders Narrative Text, Graphics and Photos Management's Discussion and Analysis Financial Statements Notes to Financial Statements Auditor's Report Directors report Corporate Governance report Summary Financial Data Corporate Information
Management Discussion and analysis 1. Discusses different aspects of the business. – – new hires or appointments, new product introductions, updates on the progress of business acquisitions, other information management believes to be important to investors. 2. overview of the previous year's developments and how the company performed over that period. 3. good starting point for a new investor who wants to understand a business' fundamentals.