Remarks on Model Misspecification in Revenue Management and



- Slides: 70
Remarks on Model Misspecification in Revenue Management and Pricing Optimization Rice University, November 12, 2012 Darius Walczak PROS Inc. , Houston, TX © 2012 PROS Inc. All rights reserved.
Agenda § Introduction § Basic Concepts of Revenue Management § PROS timeline § Three main mathematical themes § Spiral-down example § Pricing optimization § Other industries © 2012 PROS Inc. All rights reserved. 2
About PROS We help companies use their data to make better sales decisions. Unlock your data. Unleash your sales.
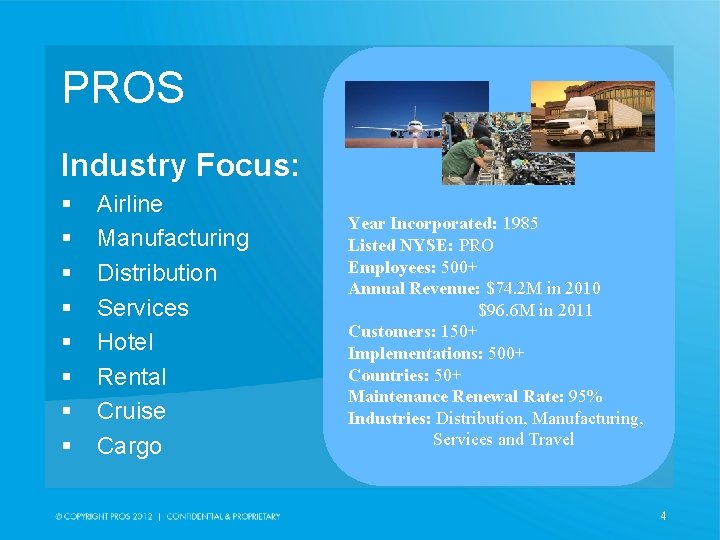
PROS Industry Focus: § § § § Airline Manufacturing Distribution Services Hotel Rental Cruise Cargo Year Incorporated: 1985 Listed NYSE: PRO Employees: 500+ Annual Revenue: $74. 2 M in 2010 $96. 6 M in 2011 Customers: 150+ Implementations: 500+ Countries: 50+ Maintenance Renewal Rate: 95% Industries: Distribution, Manufacturing, Services and Travel 4
Basic Concepts of Revenue Management © 2012 PROS Inc. All rights reserved.
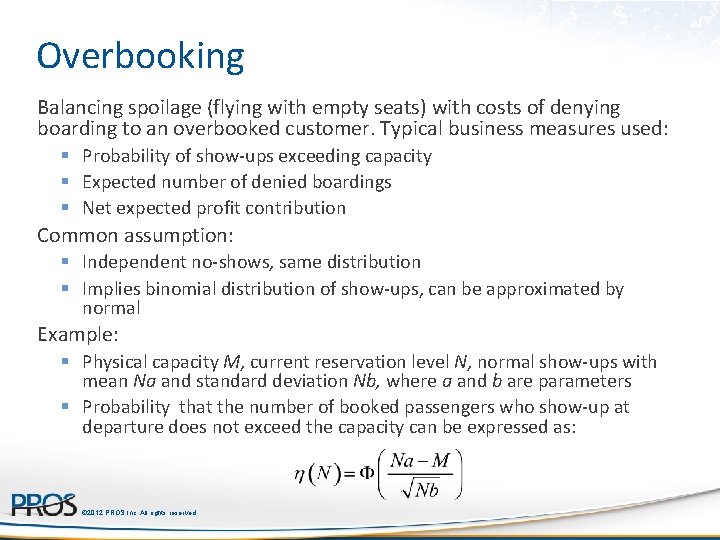
Overbooking Balancing spoilage (flying with empty seats) with costs of denying boarding to an overbooked customer. Typical business measures used: § Probability of show-ups exceeding capacity § Expected number of denied boardings § Net expected profit contribution Common assumption: § Independent no-shows, same distribution § Implies binomial distribution of show-ups, can be approximated by normal Example: § Physical capacity M, current reservation level N, normal show-ups with mean Na and standard deviation Nb, where a and b are parameters § Probability that the number of booked passengers who show-up at departure does not exceed the capacity can be expressed as: © 2012 PROS Inc. All rights reserved.
Overbooking Actually the first application YM/RM application (1960 s) Colorful history § Wikipedia: “[Julian] Simon was also the first to suggest that airlines should provide rewards for travelers to give up their seats on overbooked flights, rather than arbitrarily taking random passengers off the plane (a practice known as "bumping"). [3] Although the airline industry initially rejected it, his plan was later implemented with resounding success, as recounted by Milton Friedman in the foreword to The Ultimate Resource II. Economist James Heins said in 2009 that the practice had added $100 billion to the United States economy in the last 30 years. [7] Simon gave away his idea to federal de-regulators and never received any personal profit from his solution. [7]” © 2012 PROS Inc. All rights reserved.
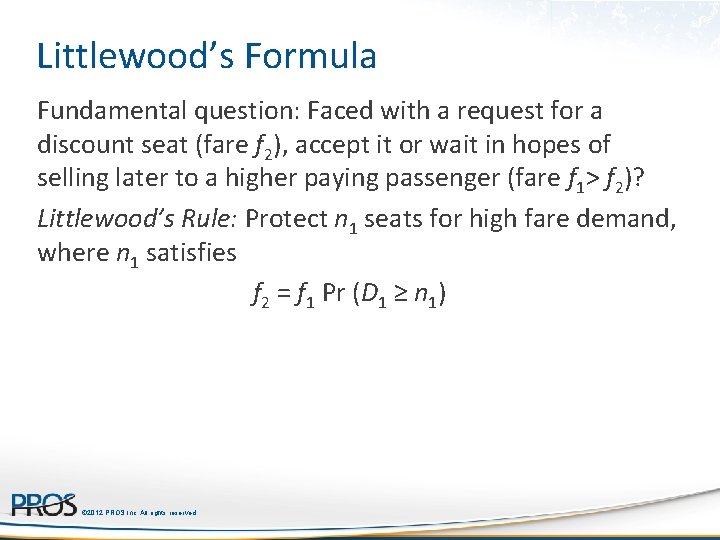
Littlewood’s Formula Fundamental question: Faced with a request for a discount seat (fare f 2), accept it or wait in hopes of selling later to a higher paying passenger (fare f 1> f 2)? Littlewood’s Rule: Protect n 1 seats for high fare demand, where n 1 satisfies f 2 = f 1 Pr (D 1 ≥ n 1) © 2012 PROS Inc. All rights reserved.
Discount allocation First recorded: capacity controlled ‘Earlybird’ discounts at BOAC (later BA), 1972: § Experiment: differentiated fares for essentially the same seats § Stimulate demand for seats that would otherwise fly empty Most famous: Yield Management at American Airlines (AA), 1976/1977 § Planes flying half full---“Super Saver Fares” to fill them, capacity controlled (e. g. 30% of seats) + advance purchase, 1970 s § Realization: Not a cost problem but a revenue problem § Name: Yield Management (Bob Crandall) YM as a competitive weapon, 1985: § Low price entrant People Express Airlines threatens AA § AA responds with (even lower) “Ultimate Super Saver Fares” that carefully control when to undercut “Using the tools of revenue management, Crandall could nominally offer competitive fares, yet hold back inventory to sell at a higher price after People Express sold out at a low price. He ultimately drove People Express out of business (Cross 1997) with better management of seat inventory and better service. ” Other carriers and other industries follow (Delta, Marriott …) © 2012 PROS Inc. All rights reserved.
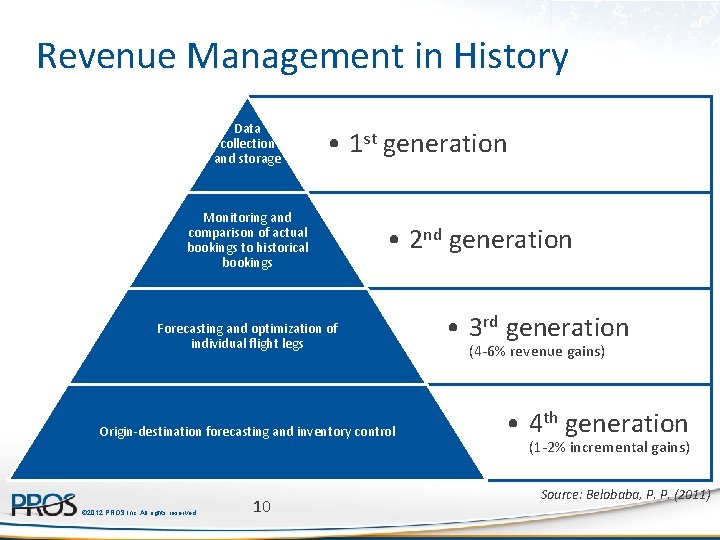
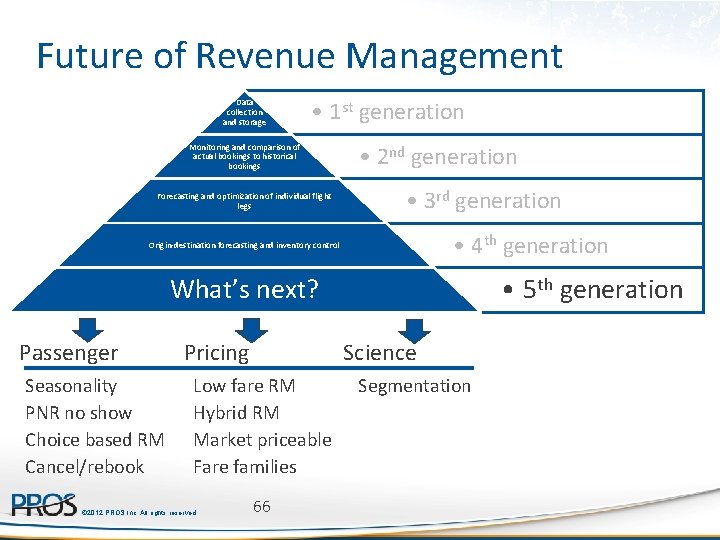
Revenue Management in History Data collection and storage • 1 st generation Monitoring and comparison of actual bookings to historical bookings • 2 nd generation Forecasting and optimization of individual flight legs Origin-destination forecasting and inventory control © 2012 PROS Inc. All rights reserved. 10 • 3 rd generation (4 -6% revenue gains) • 4 th generation (1 -2% incremental gains) Source: Belobaba, P. P. (2011)
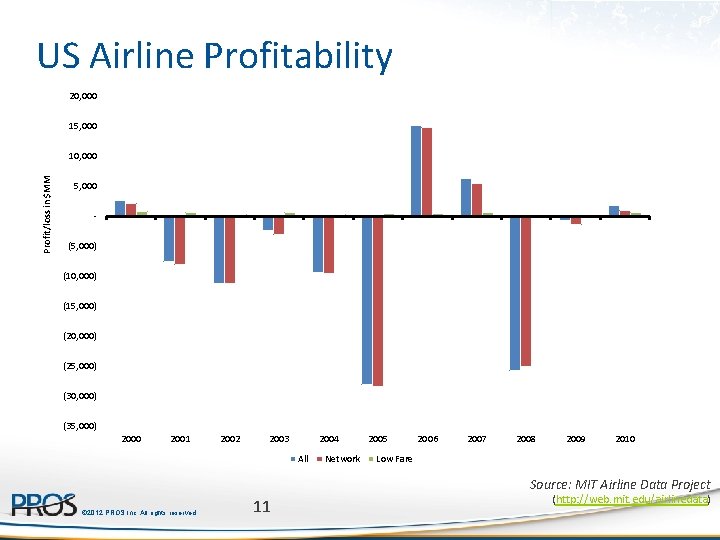
US Airline Profitability 20, 000 15, 000 Profit/loss in $MM 10, 000 5, 000 (5, 000) (10, 000) (15, 000) (20, 000) (25, 000) (30, 000) (35, 000) 2000 2001 2002 2003 2004 All Network 2005 2006 2007 2008 2009 2010 Low Fare Source: MIT Airline Data Project © 2012 PROS Inc. All rights reserved. 11 (http: //web. mit. edu/airlinedata)
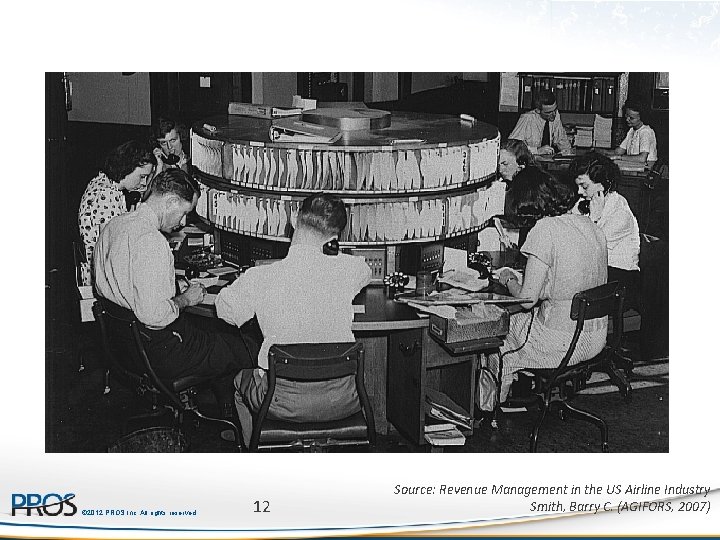
© 2012 PROS Inc. All rights reserved. 12 Source: Revenue Management in the US Airline Industry Smith, Barry C. (AGIFORS, 2007)
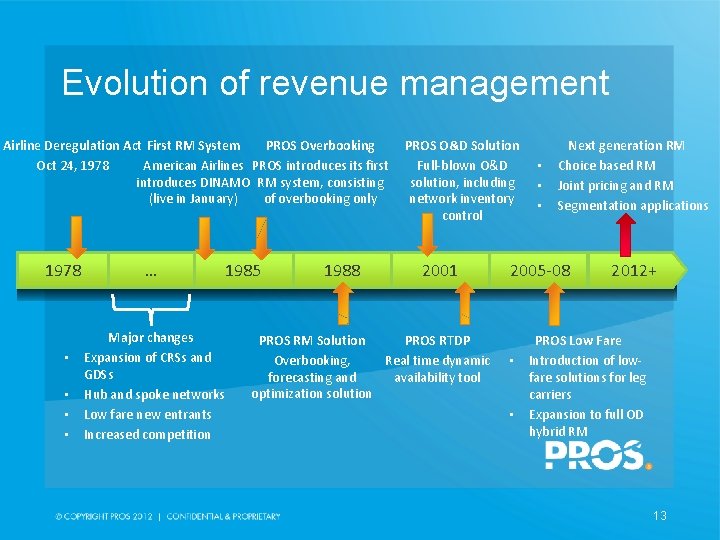
Evolution of revenue management PROS O&D Solution PROS Overbooking Airline Deregulation Act First RM System American Airlines PROS introduces its first Full-blown O&D Oct 24, 1978 introduces DINAMO RM system, consisting solution, including (live in January) network inventory of overbooking only control 1978 • • … Major changes Expansion of CRSs and GDSs Hub and spoke networks Low fare new entrants Increased competition 1985 1988 2001 PROS RM Solution PROS RTDP Overbooking, Real time dynamic forecasting and availability tool optimization solution • • • Next generation RM Choice based RM Joint pricing and RM Segmentation applications 2005 -08 • • 2012+ PROS Low Fare Introduction of lowfare solutions for leg carriers Expansion to full OD hybrid RM 13
Three Main Mathematical Themes Stochastic and dynamic demand Network effects Choice behavior © 2012 PROS Inc. All rights reserved.
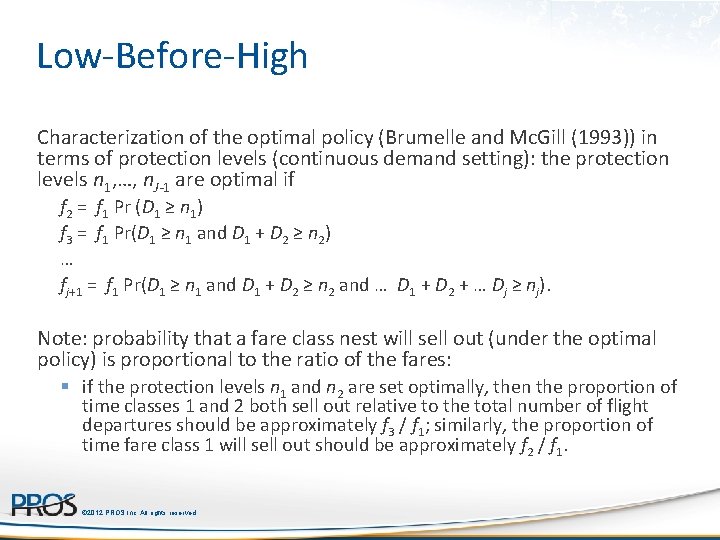
Low-Before-High Characterization of the optimal policy (Brumelle and Mc. Gill (1993)) in terms of protection levels (continuous demand setting): the protection levels n 1, …, n. J-1 are optimal if f 2 = f 1 Pr (D 1 ≥ n 1) f 3 = f 1 Pr(D 1 ≥ n 1 and D 1 + D 2 ≥ n 2) … fj+1 = f 1 Pr(D 1 ≥ n 1 and D 1 + D 2 ≥ n 2 and … D 1 + D 2 + … Dj ≥ nj). Note: probability that a fare class nest will sell out (under the optimal policy) is proportional to the ratio of the fares: § if the protection levels n 1 and n 2 are set optimally, then the proportion of time classes 1 and 2 both sell out relative to the total number of flight departures should be approximately f 3 / f 1; similarly, the proportion of time fare class 1 will sell out should be approximately f 2 / f 1. © 2012 PROS Inc. All rights reserved.
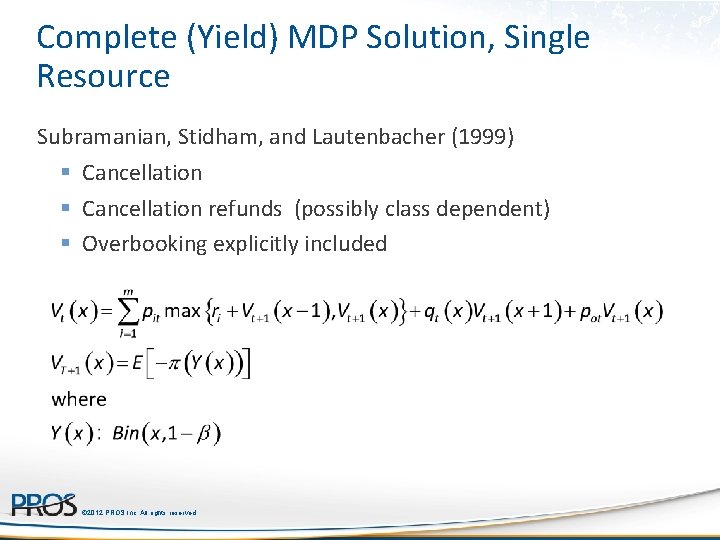
Complete (Yield) MDP Solution, Single Resource Subramanian, Stidham, and Lautenbacher (1999) § Cancellation refunds (possibly class dependent) § Overbooking explicitly included © 2012 PROS Inc. All rights reserved.
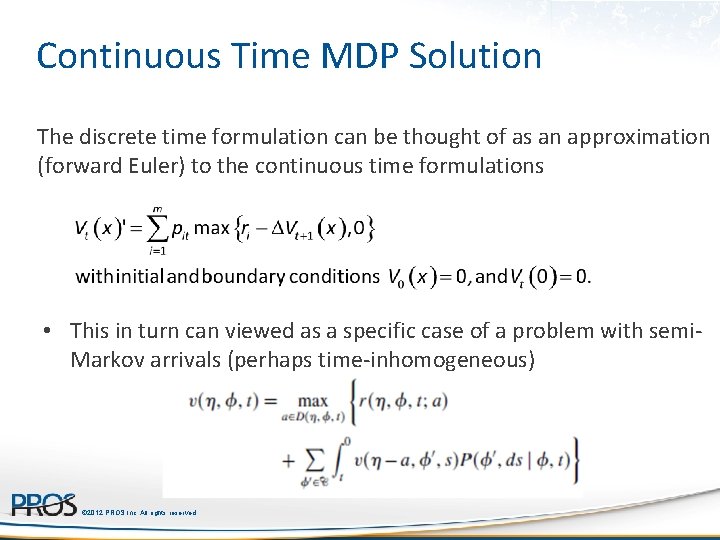
Continuous Time MDP Solution The discrete time formulation can be thought of as an approximation (forward Euler) to the continuous time formulations • This in turn can viewed as a specific case of a problem with semi. Markov arrivals (perhaps time-inhomogeneous) © 2012 PROS Inc. All rights reserved.
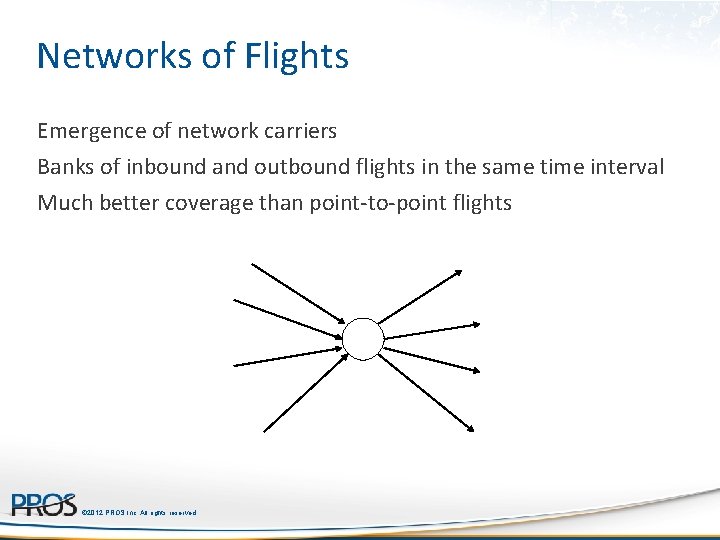
Networks of Flights Emergence of network carriers Banks of inbound and outbound flights in the same time interval Much better coverage than point-to-point flights © 2012 PROS Inc. All rights reserved.
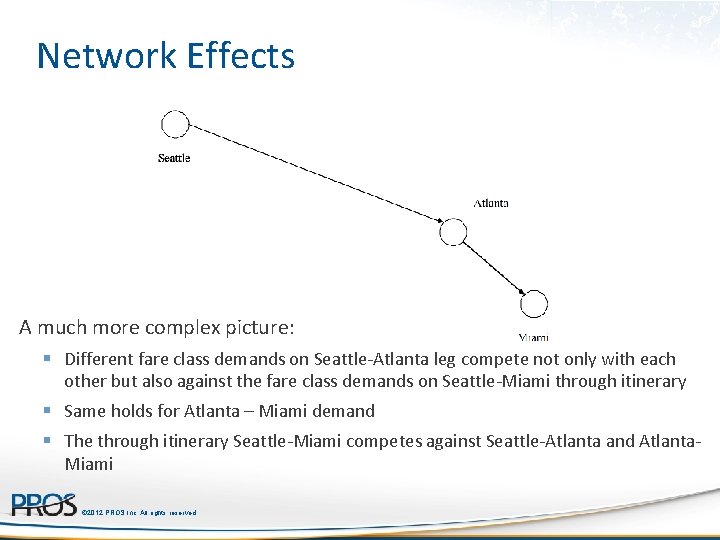
Network Effects A much more complex picture: § Different fare class demands on Seattle-Atlanta leg compete not only with each other but also against the fare class demands on Seattle-Miami through itinerary § Same holds for Atlanta – Miami demand § The through itinerary Seattle-Miami competes against Seattle-Atlanta and Atlanta. Miami © 2012 PROS Inc. All rights reserved.
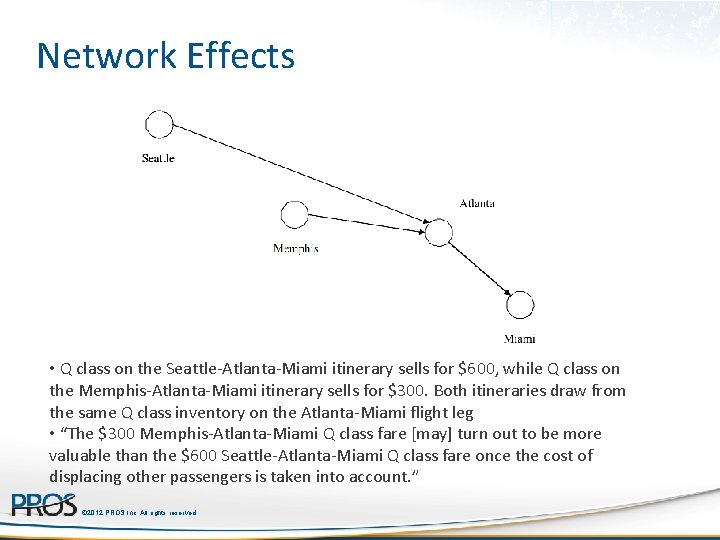
Network Effects • Q class on the Seattle-Atlanta-Miami itinerary sells for $600, while Q class on the Memphis-Atlanta-Miami itinerary sells for $300. Both itineraries draw from the same Q class inventory on the Atlanta-Miami flight leg • “The $300 Memphis-Atlanta-Miami Q class fare [may] turn out to be more valuable than the $600 Seattle-Atlanta-Miami Q class fare once the cost of displacing other passengers is taken into account. ” © 2012 PROS Inc. All rights reserved.
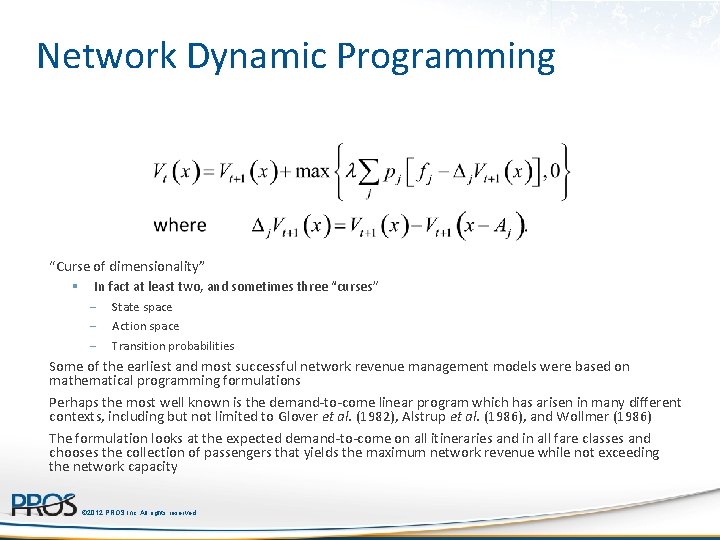
Network Dynamic Programming “Curse of dimensionality” § In fact at least two, and sometimes three “curses” - State space - Action space - Transition probabilities Some of the earliest and most successful network revenue management models were based on mathematical programming formulations Perhaps the most well known is the demand-to-come linear program which has arisen in many different contexts, including but not limited to Glover et al. (1982), Alstrup et al. (1986), and Wollmer (1986) The formulation looks at the expected demand-to-come on all itineraries and in all fare classes and chooses the collection of passengers that yields the maximum network revenue while not exceeding the network capacity © 2012 PROS Inc. All rights reserved.
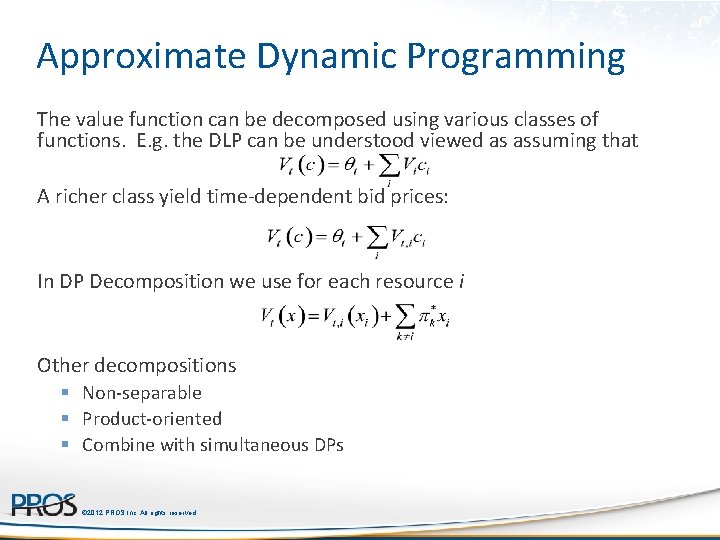
Approximate Dynamic Programming The value function can be decomposed using various classes of functions. E. g. the DLP can be understood viewed as assuming that A richer class yield time-dependent bid prices: In DP Decomposition we use for each resource i Other decompositions § Non-separable § Product-oriented § Combine with simultaneous DPs © 2012 PROS Inc. All rights reserved.
Changing Business Environment While the late 1990 s and early 2000 s saw a push, led by academia, for more and more sophisticated algorithms the focus has since shifted mainly due to business considerations: § Competition from a new generation of low fare carriers (LCCs) § Growth of internet ticket sales Simplified fare structure: § Few or no ticketing restrictions, § Legacy carriers in many cases reacting by emulating LCC practices. Competitive fares becoming transparent Ease of search Traditional RM algorithms called into question © 2012 PROS Inc. All rights reserved.
Spiral-down Example Source: The Spiral-down effect in Revenue Management (or the Importance of a Good Demand Model) William L. Cooper, Tito Homem-de-Mello, Anton J. Kleywegt (2010) © 2012 PROS Inc. All rights reserved.
What is Spiral Down? Airline estimates high-fare demand using historical data, without properly accounting for customer behavior. Availability of low-fare tickets reduces sales of high-fare tickets. New data begins to reflect lower demand for high-fare tickets. © 2012 PROS Inc. All rights reserved. Source: The Spiral-down effect in Revenue Management (or the Importance of a Good Demand Model) William L. Cooper, Tito Homem-de-Mello, Anton J. Kleywegt (2010) 30
What is Spiral Down? Protection levels are set lower on subsequent flights, making more seats available at the low fare. Even fewer high-fare tickets are sold. The process continues, so protection levels, high-fare ticket sales, and revenues spiral down. © 2012 PROS Inc. All rights reserved. Source: The Spiral-down effect in Revenue Management (or the Importance of a Good Demand Model) William L. Cooper, Tito Homem-de-Mello, Anton J. Kleywegt (2010) 31
Related Phenomena Inventory-dependent demand § Balakrishnan, et al. , Mgmt. Sci. , 2004. Newsvendor salvage values that depend upon end-ofseason inventory § Cachon and Kok, 2003 Response-time spiral in manufacturing planning § Suri, 1998 © 2012 PROS Inc. All rights reserved. Source: The Spiral-down effect in Revenue Management (or the Importance of a Good Demand Model) William L. Cooper, Tito Homem-de-Mello, Anton J. Kleywegt (2010) 32
The Framework Repeated instances of some flight: § 8 AM Monday flight between Minneapolis and San Diego. § Same flight on April 25, May 2, May 9, May 16, May 23, May 30, etc. © 2012 PROS Inc. All rights reserved. Source: The Spiral-down effect in Revenue Management (or the Importance of a Good Demand Model) William L. Cooper, Tito Homem-de-Mello, Anton J. Kleywegt (2010) 33
What are the long-term effects of using a “slightly” flawed model? The interplay between forecasting and optimization is a key aspect of RM---and of OR in general. Mathematical models are only an approximation to reality. Many models have assumptions that are clearly incorrect. © 2012 PROS Inc. All rights reserved. Source: The Spiral-down effect in Revenue Management (or the Importance of a Good Demand Model) William L. Cooper, Tito Homem-de-Mello, Anton J. Kleywegt (2010) 34
The Littlewood Rule There is distinct demand for fare class 1 and fare class 2. Class 2 customers arrive before class 1 customers. Demand is exogenous. That is, the protection level does not affect the demand distribution. Demands for fare class 1 and fare class 2 are stochastically independent. © 2012 PROS Inc. All rights reserved. Source: The Spiral-down effect in Revenue Management (or the Importance of a Good Demand Model) William L. Cooper, Tito Homem-de-Mello, Anton J. Kleywegt (2010) 35
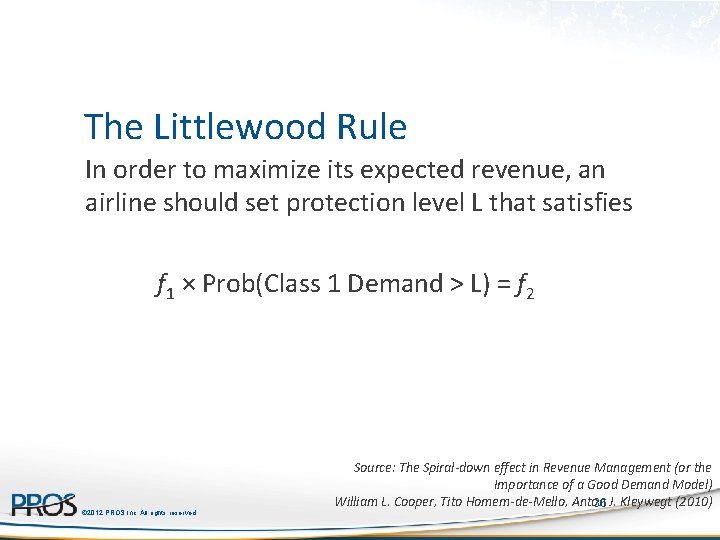
The Littlewood Rule In order to maximize its expected revenue, an airline should set protection level L that satisfies f 1 × Prob(Class 1 Demand > L) = f 2 © 2012 PROS Inc. All rights reserved. Source: The Spiral-down effect in Revenue Management (or the Importance of a Good Demand Model) William L. Cooper, Tito Homem-de-Mello, Anton 36 J. Kleywegt (2010)
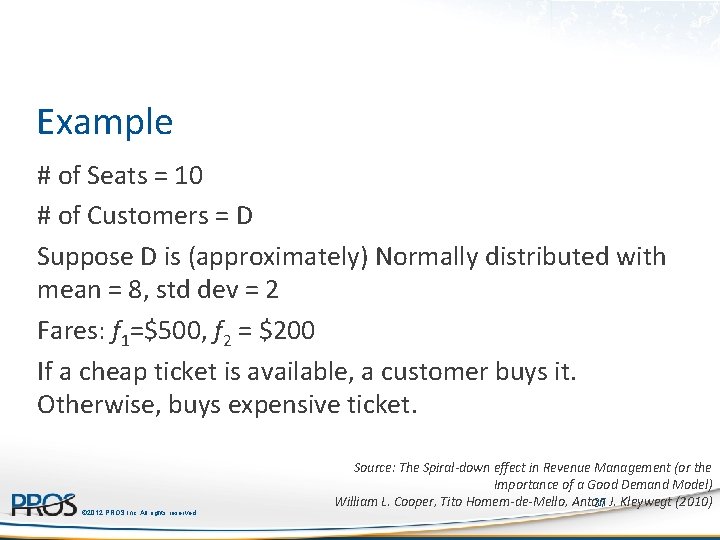
Example # of Seats = 10 # of Customers = D Suppose D is (approximately) Normally distributed with mean = 8, std dev = 2 Fares: f 1=$500, f 2 = $200 If a cheap ticket is available, a customer buys it. Otherwise, buys expensive ticket. © 2012 PROS Inc. All rights reserved. Source: The Spiral-down effect in Revenue Management (or the Importance of a Good Demand Model) William L. Cooper, Tito Homem-de-Mello, Anton 37 J. Kleywegt (2010)
How might a revenue manager actually choose L? The revenue manager does not know the information on the previous slide. © 2012 PROS Inc. All rights reserved. Source: The Spiral-down effect in Revenue Management (or the Importance of a Good Demand Model) William L. Cooper, Tito Homem-de-Mello, Anton 38 J. Kleywegt (2010)
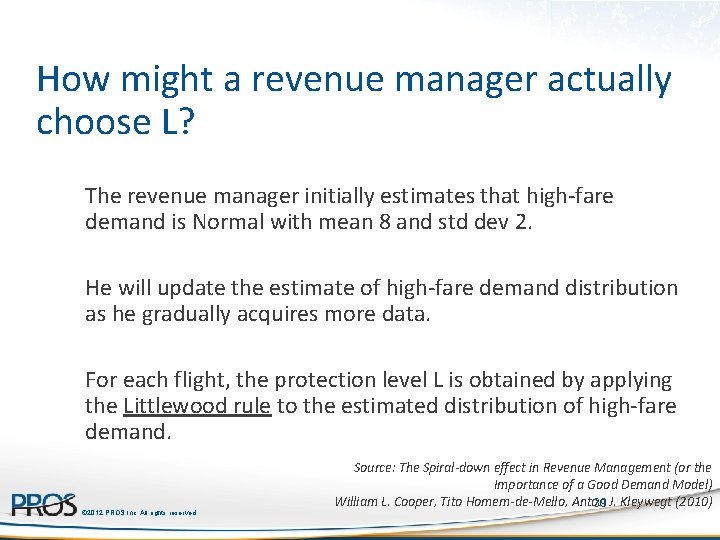
How might a revenue manager actually choose L? The revenue manager initially estimates that high-fare demand is Normal with mean 8 and std dev 2. He will update the estimate of high-fare demand distribution as he gradually acquires more data. For each flight, the protection level L is obtained by applying the Littlewood rule to the estimated distribution of high-fare demand. © 2012 PROS Inc. All rights reserved. Source: The Spiral-down effect in Revenue Management (or the Importance of a Good Demand Model) William L. Cooper, Tito Homem-de-Mello, Anton 39 J. Kleywegt (2010)
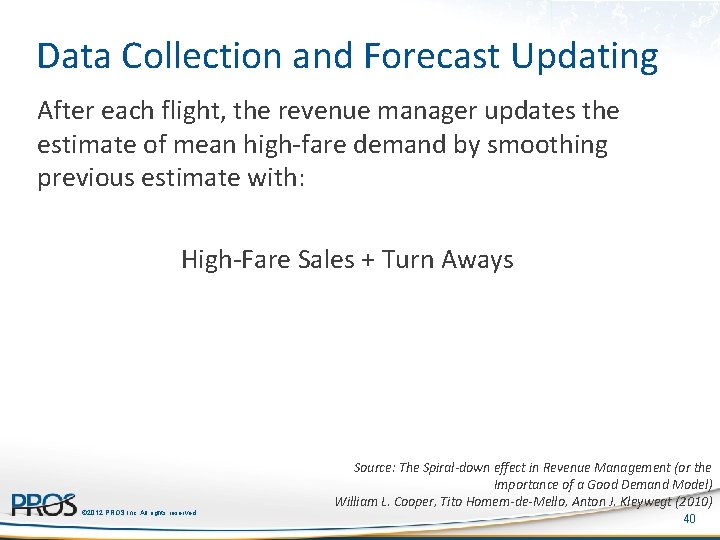
Data Collection and Forecast Updating After each flight, the revenue manager updates the estimate of mean high-fare demand by smoothing previous estimate with: High-Fare Sales + Turn Aways © 2012 PROS Inc. All rights reserved. Source: The Spiral-down effect in Revenue Management (or the Importance of a Good Demand Model) William L. Cooper, Tito Homem-de-Mello, Anton J. Kleywegt (2010) 40
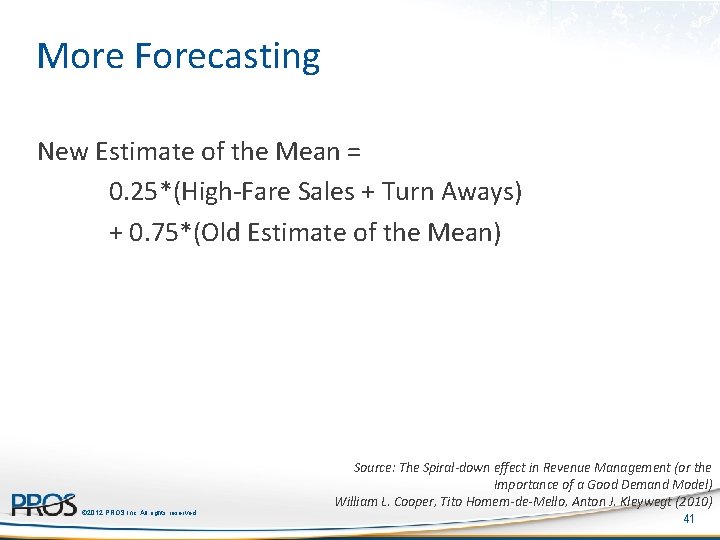
More Forecasting New Estimate of the Mean = 0. 25*(High-Fare Sales + Turn Aways) + 0. 75*(Old Estimate of the Mean) © 2012 PROS Inc. All rights reserved. Source: The Spiral-down effect in Revenue Management (or the Importance of a Good Demand Model) William L. Cooper, Tito Homem-de-Mello, Anton J. Kleywegt (2010) 41
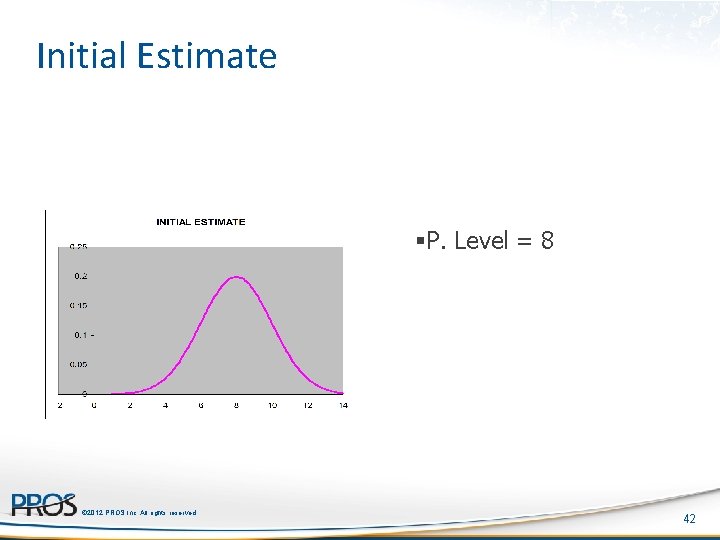
Initial Estimate §P. Level = 8 © 2012 PROS Inc. All rights reserved. 42
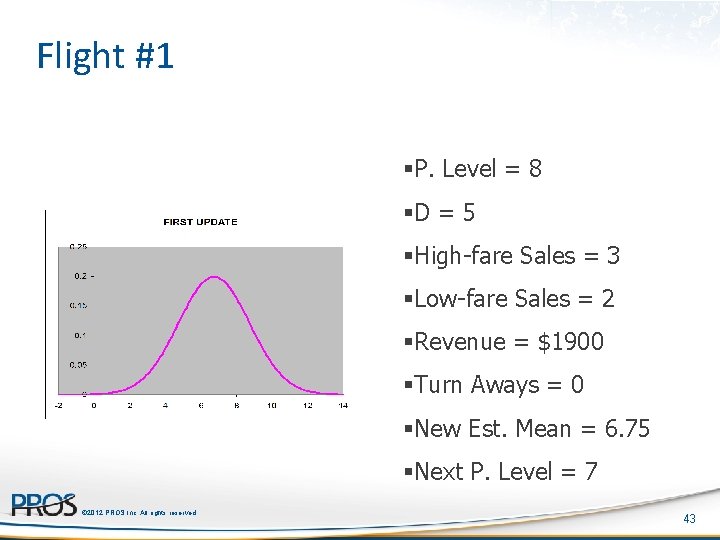
Flight #1 §P. Level = 8 §D = 5 §High-fare Sales = 3 §Low-fare Sales = 2 §Revenue = $1900 §Turn Aways = 0 §New Est. Mean = 6. 75 §Next P. Level = 7 © 2012 PROS Inc. All rights reserved. 43
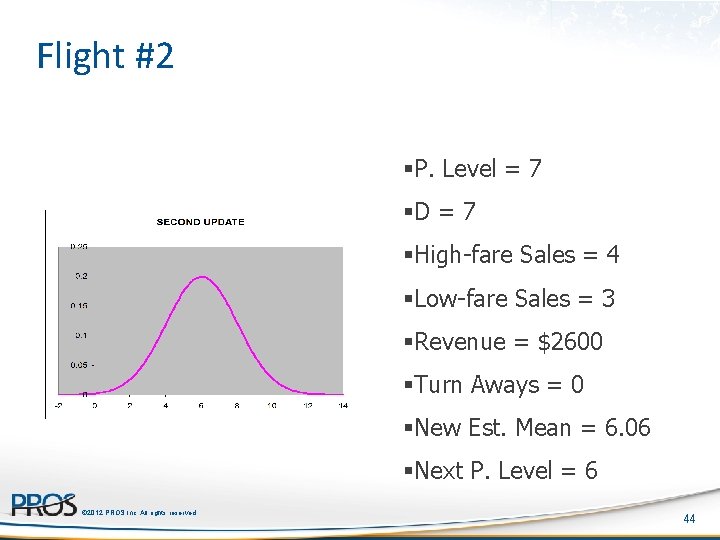
Flight #2 §P. Level = 7 §D = 7 §High-fare Sales = 4 §Low-fare Sales = 3 §Revenue = $2600 §Turn Aways = 0 §New Est. Mean = 6. 06 §Next P. Level = 6 © 2012 PROS Inc. All rights reserved. 44
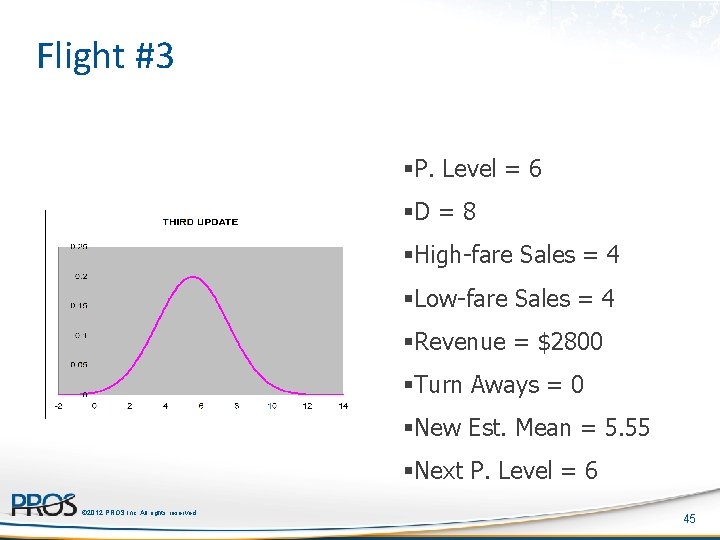
Flight #3 §P. Level = 6 §D = 8 §High-fare Sales = 4 §Low-fare Sales = 4 §Revenue = $2800 §Turn Aways = 0 §New Est. Mean = 5. 55 §Next P. Level = 6 © 2012 PROS Inc. All rights reserved. 45
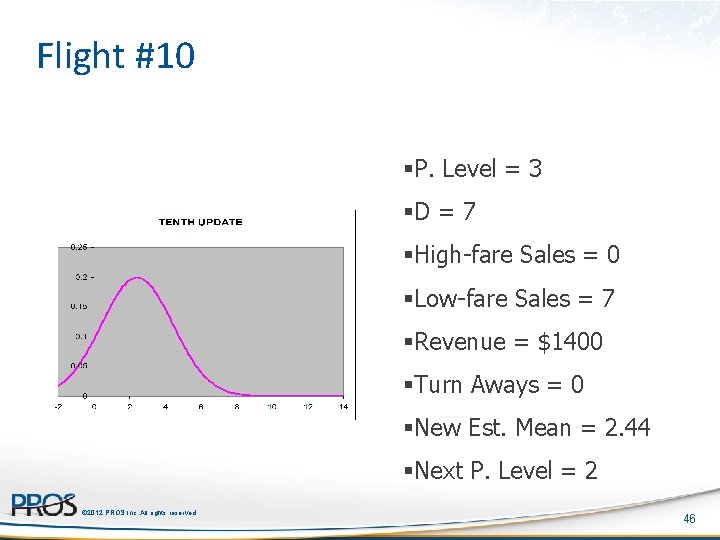
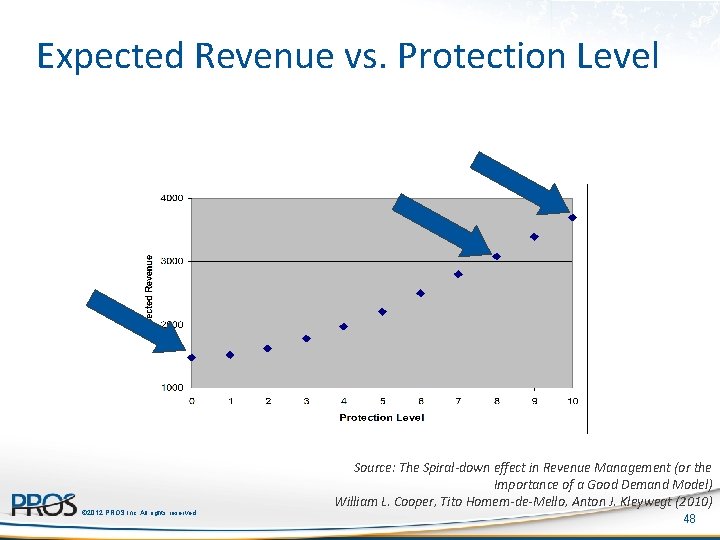
Flight #10 §P. Level = 3 §D = 7 §High-fare Sales = 0 §Low-fare Sales = 7 §Revenue = $1400 §Turn Aways = 0 §New Est. Mean = 2. 44 §Next P. Level = 2 © 2012 PROS Inc. All rights reserved. 46
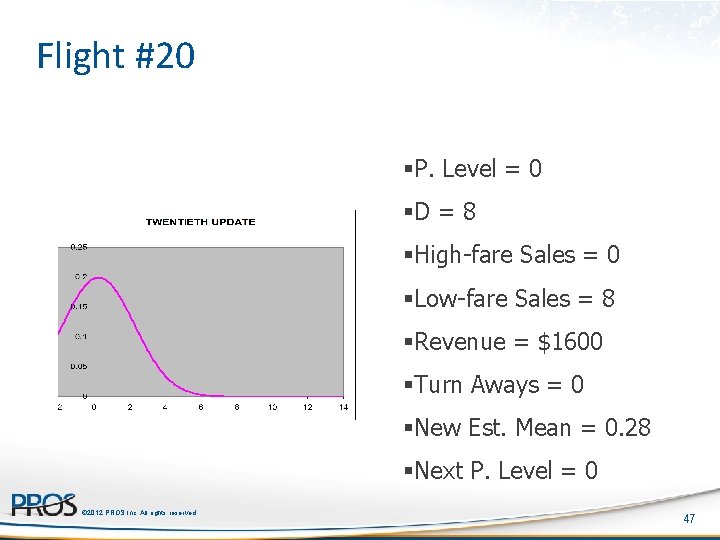
Flight #20 §P. Level = 0 §D = 8 §High-fare Sales = 0 §Low-fare Sales = 8 §Revenue = $1600 §Turn Aways = 0 §New Est. Mean = 0. 28 §Next P. Level = 0 © 2012 PROS Inc. All rights reserved. 47
Expected Revenue vs. Protection Level © 2012 PROS Inc. All rights reserved. Source: The Spiral-down effect in Revenue Management (or the Importance of a Good Demand Model) William L. Cooper, Tito Homem-de-Mello, Anton J. Kleywegt (2010) 48
Is this a problem with unconstraining? The problem is not unconstraining; the revenue manager saw every customer. Rather, the fundamental problem is that the revenue manager was using an incorrect demand model. © 2012 PROS Inc. All rights reserved. Source: The Spiral-down effect in Revenue Management (or the Importance of a Good Demand Model) William L. Cooper, Tito Homem-de-Mello, Anton J. Kleywegt (2010) 49
Conclusions (for RM) When availability decisions of the airline affect data used to estimate the “high-fare demand distribution, ” then the performance of the RMS can become progressively worse, rather than progressively better. © 2012 PROS Inc. All rights reserved. Source: The Spiral-down effect in Revenue Management (or the Importance of a Good Demand Model) William L. Cooper, Tito Homem-de-Mello, Anton J. Kleywegt (2010) 50
Conclusions (for RM) This can be a particular problem if the airline is using a demand model that does not accurately reflect how consumers choose among the available ticket classes. There is more work to be done to understand what types of models and methods best avoid spiral down. © 2012 PROS Inc. All rights reserved. Source: The Spiral-down effect in Revenue Management (or the Importance of a Good Demand Model) William L. Cooper, Tito Homem-de-Mello, Anton J. Kleywegt (2010) 51
Conclusions (in General) It is known and accepted that answers arising from simplified models can produce suboptimal results. What is less understood is how the use of such models interacts over time with forecasting. If assumptions may be flawed, it is important to test for robustness within a framework that captures the sequential interaction of forecasting and optimization. © 2012 PROS Inc. All rights reserved. Source: The Spiral-down effect in Revenue Management (or the Importance of a Good Demand Model) William L. Cooper, Tito Homem-de-Mello, Anton J. Kleywegt (2010) 52
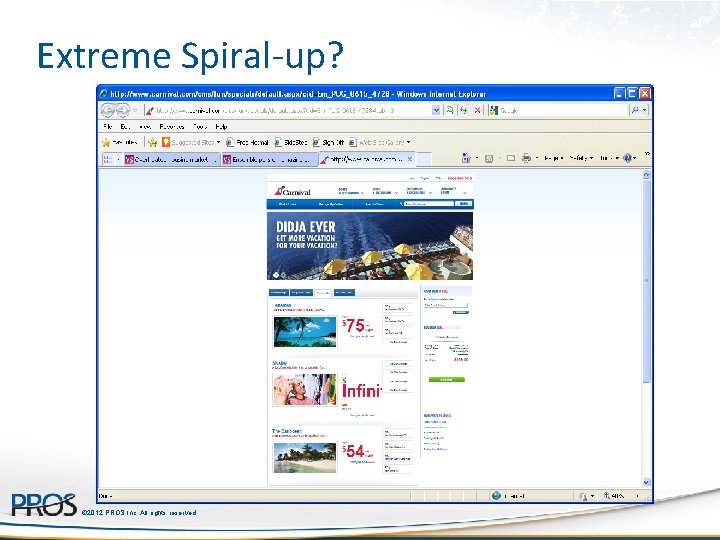
Extreme Spiral-up? © 2012 PROS Inc. All rights reserved.
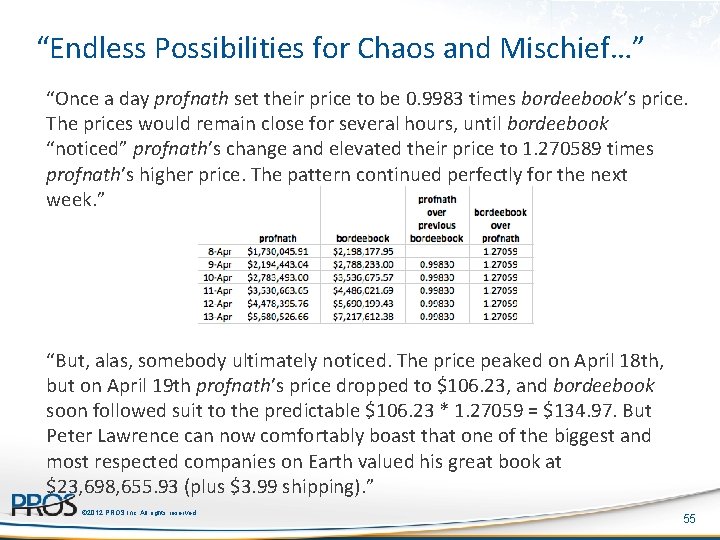
Rules are not enough: Amazon’s $23, 698, 655. 93 book about flies From http: //www. michaeleisen. org/blog/? attachment_id=368 © 2012 PROS Inc. All rights reserved. 54
“Endless Possibilities for Chaos and Mischief…” “Once a day profnath set their price to be 0. 9983 times bordeebook’s price. The prices would remain close for several hours, until bordeebook “noticed” profnath’s change and elevated their price to 1. 270589 times profnath’s higher price. The pattern continued perfectly for the next week. ” “But, alas, somebody ultimately noticed. The price peaked on April 18 th, but on April 19 th profnath’s price dropped to $106. 23, and bordeebook soon followed suit to the predictable $106. 23 * 1. 27059 = $134. 97. But Peter Lawrence can now comfortably boast that one of the biggest and most respected companies on Earth valued his great book at $23, 698, 655. 93 (plus $3. 99 shipping). ” © 2012 PROS Inc. All rights reserved. 55
Some better demand models Models with “sell-up” § Brumelle, Mc. Gill, et al. , Trans. Sci. , 1990 Hybrid Model § Walczak et al. , JRPM 2010 Consumer choice models § Talluri and van Ryzin, Mgmt. Sci. , 2004 © 2012 PROS Inc. All rights reserved. 56
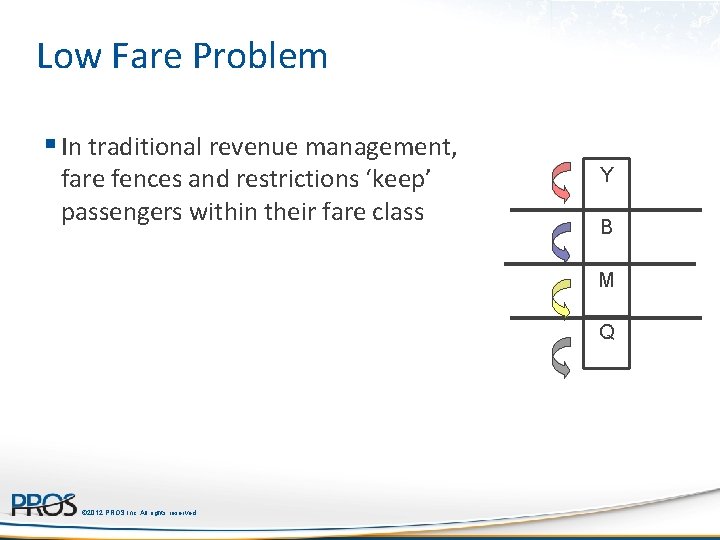
Low Fare Problem § In traditional revenue management, fare fences and restrictions ‘keep’ passengers within their fare class Y B M Q © 2012 PROS Inc. All rights reserved.
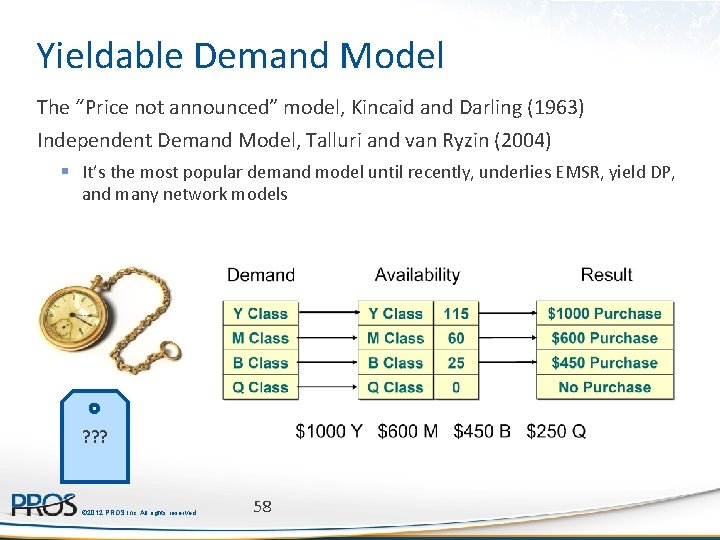
Yieldable Demand Model The “Price not announced” model, Kincaid and Darling (1963) Independent Demand Model, Talluri and van Ryzin (2004) § It’s the most popular demand model until recently, underlies EMSR, yield DP, and many network models ? ? ? © 2012 PROS Inc. All rights reserved. 58
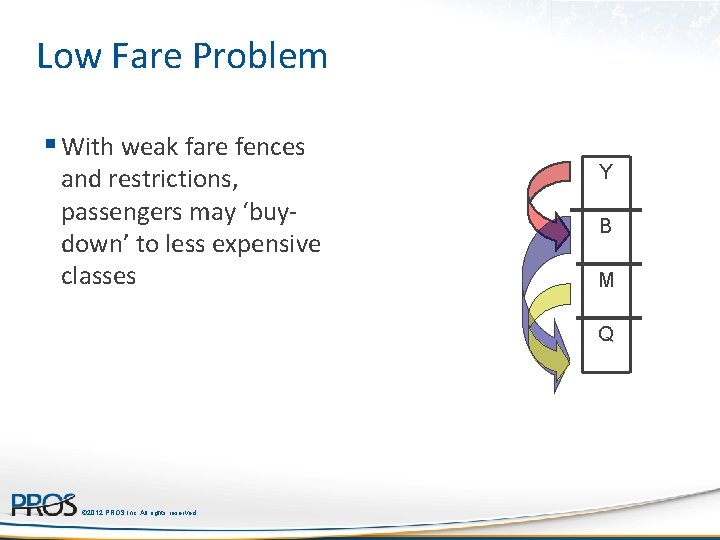
Low Fare Problem § With weak fare fences and restrictions, passengers may ‘buydown’ to less expensive classes Y B M Q © 2012 PROS Inc. All rights reserved.
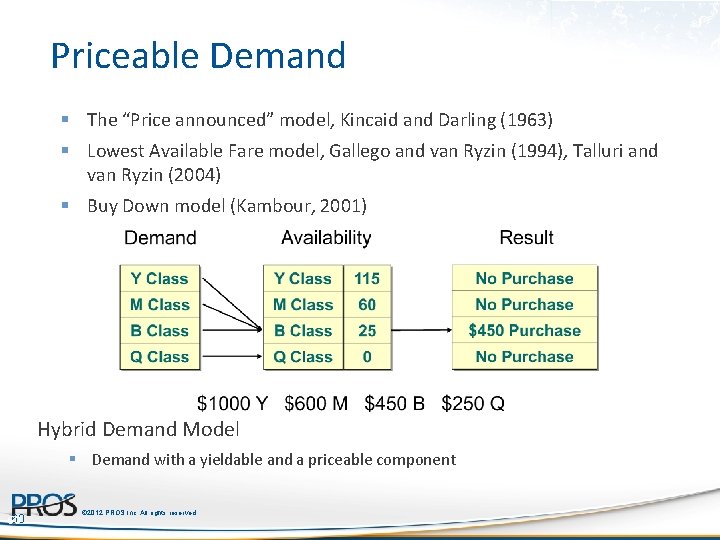
Priceable Demand § The “Price announced” model, Kincaid and Darling (1963) § Lowest Available Fare model, Gallego and van Ryzin (1994), Talluri and van Ryzin (2004) § Buy Down model (Kambour, 2001) Hybrid Demand Model § Demand with a yieldable and a priceable component 60 60 © 2012 PROS Inc. All rights reserved.
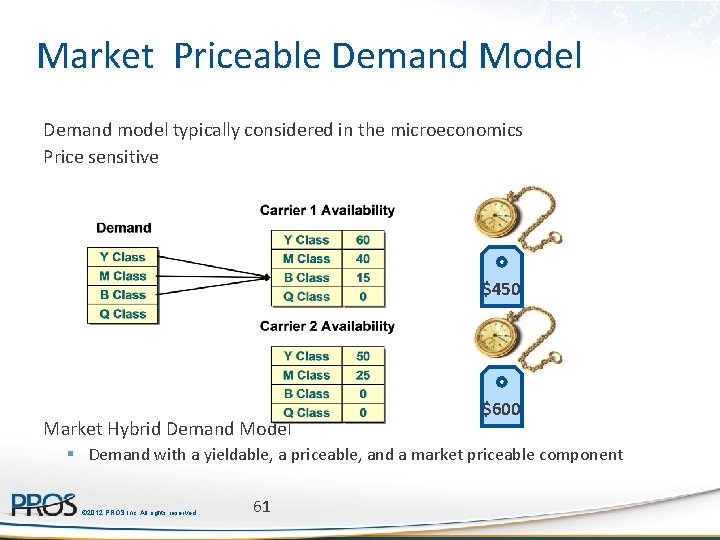
Market Priceable Demand Model Demand model typically considered in the microeconomics Price sensitive $450 Market Hybrid Demand Model $600 § Demand with a yieldable, a priceable, and a market priceable component © 2012 PROS Inc. All rights reserved. 61
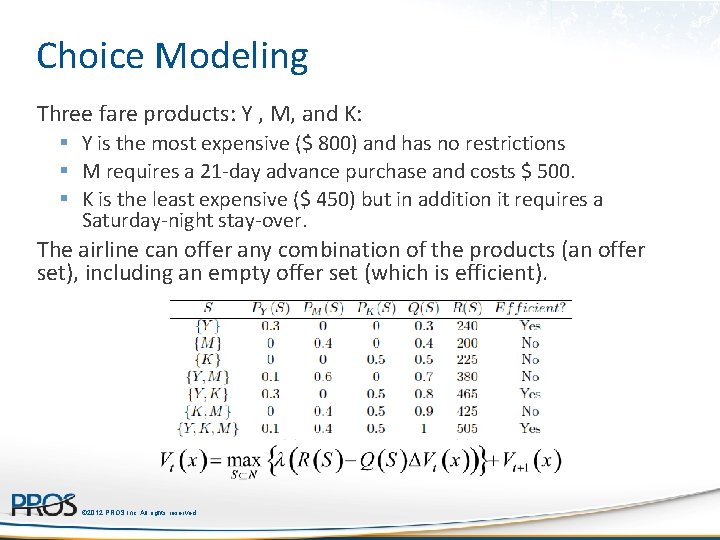
Choice Modeling Three fare products: Y , M, and K: § Y is the most expensive ($ 800) and has no restrictions § M requires a 21 -day advance purchase and costs $ 500. § K is the least expensive ($ 450) but in addition it requires a Saturday-night stay-over. The airline can offer any combination of the products (an offer set), including an empty offer set (which is efficient). © 2012 PROS Inc. All rights reserved.
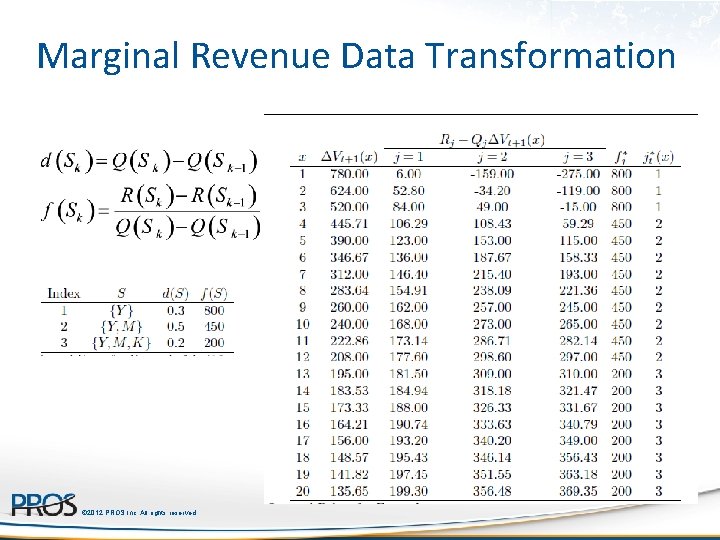
Marginal Revenue Data Transformation © 2012 PROS Inc. All rights reserved.
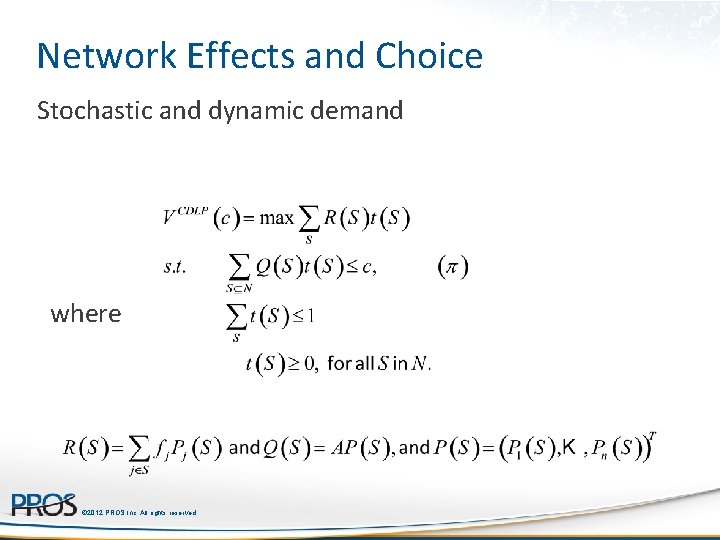
Network Effects and Choice Stochastic and dynamic demand where © 2012 PROS Inc. All rights reserved.
Future of Revenue Management Data collection and storage • 1 st generation Monitoring and comparison of actual bookings to historical bookings Forecasting and optimization of individual flight legs • 2 nd generation • 3 rd generation • 4 th generation Origin-destination forecasting and inventory control • 5 th generation What’s next? Passenger Seasonality PNR no show Choice based RM Cancel/rebook Pricing Science Low fare RM Hybrid RM Market priceable Fare families © 2012 PROS Inc. All rights reserved. 66 Segmentation
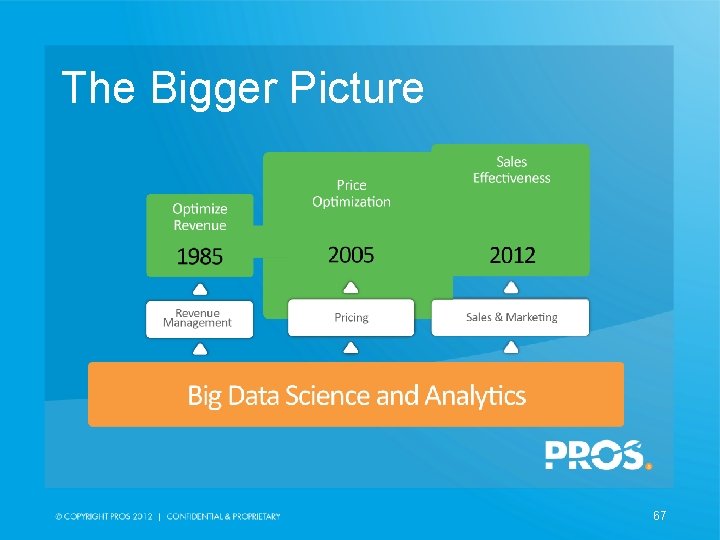
The Bigger Picture 67
World-class Companies Choose PROS Die Bahn 68
Appendix
Some References Brumelle, S. L. , and J. I. Mc. Gill (1993) Airline Seat Allocation with Multiple Nested Fare Classes. Operations Research. 41(1) 127 -137. Cross, R. G. , J. A. Higbie, Z. N. Cross (2011) Milestones in the application of analytical pricing and revenue management. JRPM 10, 8— 16. Talluri, K. , G. van Ryzin (2004) “The Theory and Practice of Revenue Management” Kluwer Academic Publishers. Walczak, D. , E. A. Boyd, R. Cramer, (2012) “Revenue Management” – in: Smith, Barnhart (Eds. ) “Quantitative Problem Solving Methods in the Airline Industry: A Modeling Methodology Handbook, ” Springer, in press. © 2012 PROS Inc. All rights reserved.
The Role of Forecasting Yield to Revenue to Pricing Why not just call it stochastic optimization? © 2012 PROS Inc. All rights reserved.
Beyond Revenue Management and Pricing are primarily centered on maximizing expected revenue or profit contribution. However, several other metrics are also of importance: • Resource utilization (load factor in airline industry, reconstrained demand) • Probabilities of certain events, e. g. sellout of capacity • Metrics related to risk and variability of expected revenue or profit contribution Most RM system do provide reporting based on (typically) static approximations © 2012 PROS Inc. All rights reserved.
Motivation RM and Pricing managers and analysts are often faced with this type of “executive” questions or requests: “I want increased yield and increased load factor” or “I want increased revenue and increased load factor” However, these are different optimization objectives which “diverge” at some point, so each can only increase at the expense of the other. Therefore what is needed is a tool that shows possible tradeoffs, sometimes called “what-if” analysis Need a set of solutions with different values of, say, revenue and load factor so that user can select the one fitting his strategic or tactical objectives © 2012 PROS Inc. All rights reserved.
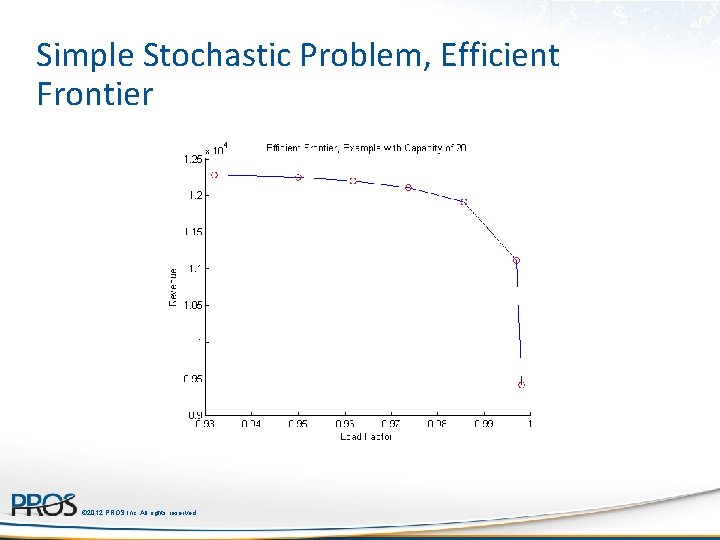
Simple Stochastic Problem, Efficient Frontier © 2012 PROS Inc. All rights reserved.
Answering the Business Question A revenue management analyst can now respond to management by presenting some alternatives: § “Best revenue of $. . . With load factor of …, ” or § “Best load factor with revenue of. $. . . ”, or § “Can give you the best revenue or increase load factor by …, with only … drop in revenue” © 2012 PROS Inc. All rights reserved.
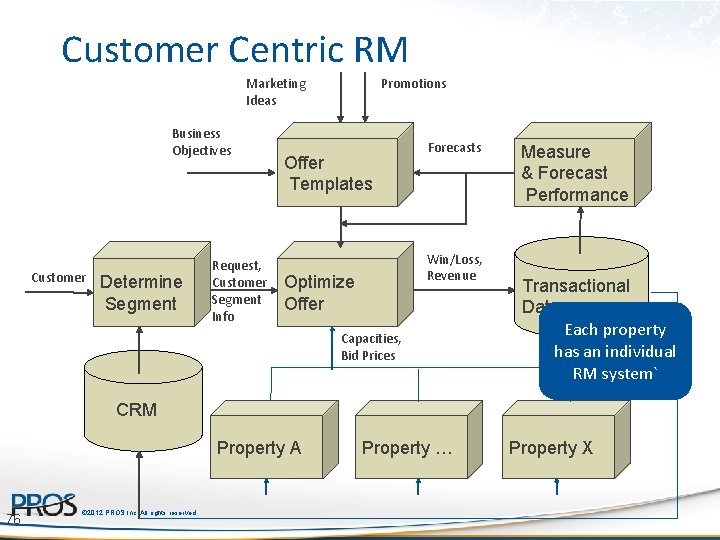
Customer Centric RM Marketing Ideas Business Objectives Customer Determine Segment Request, Customer Segment Info Promotions Offer Templates Forecasts Win/Loss, Revenue Optimize Offer Capacities, Bid Prices Measure & Forecast Performance Transactional Data Each property has an individual RM system` CRM Property A 76 © 2012 PROS Inc. All rights reserved. Property … Property X